Confluence Project Management With Native Features

Even though the PM’s job responsibilities and skills may vary in companies, all project managers initiate, plan, execute, monitor, and close projects. Various tools and platforms help project managers resolve their everyday tasks.
In this blog post, we will highlight the out-of-the-box Confluence tools for project managers:
- How to work with the native Confluence reports (Task Report, Page Properties Report, Jira Issues Macro)
- How to organize your workflows and data, collecting info with the help of labels and templates
- What options are available for planning and creating roadmaps
We’ll focus on native features first and add a few words about enhancing them. We’ll discuss the following:
- Confluence templates: how to create a full page in one click
- Project planning
- Organizing and reporting
- Enhancing the native features with apps
Feel free to watch this Confluence tutorial, where our Product Manager Natalie shows everything we described in this blog post.
You may think that Confluence is a documentation system, not a project portfolio management system. However, with all its platforms, the Atlassian ecosystem helps maintain the complete project lifecycle. For example, in Jira, we store and prioritize links within different versions, sprints, and projects for our tasks, but it’s not so well-tailored for documenting your work.
In Confluence, users can create pages or spaces for each version, sprint, or project. It allows you to store high-level details, tables from Jira with the tasks included, details about testing and deployment, target dates, and many more data on Confluence pages. Confluence helps work together, create, share, and collaborate on projects.
Confluence templates: how to create a full page in one click
It seems logical to start with documenting our work.
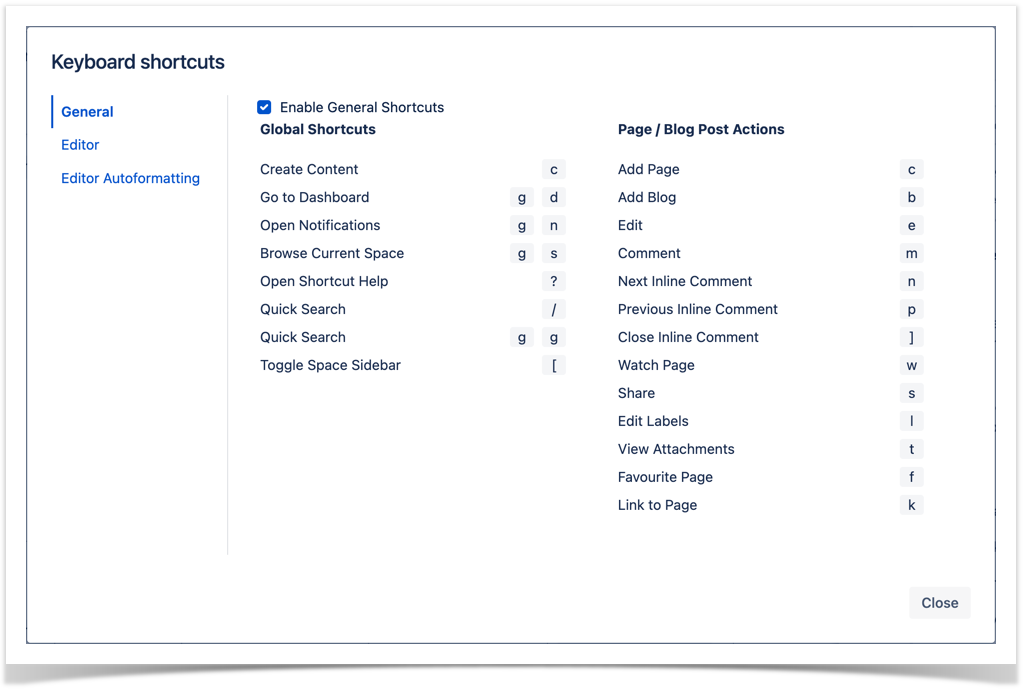
Confluence starts with a page. You can use the Confluence interface only or learn some shortcuts that speed up creating and editing pages.
Page templates
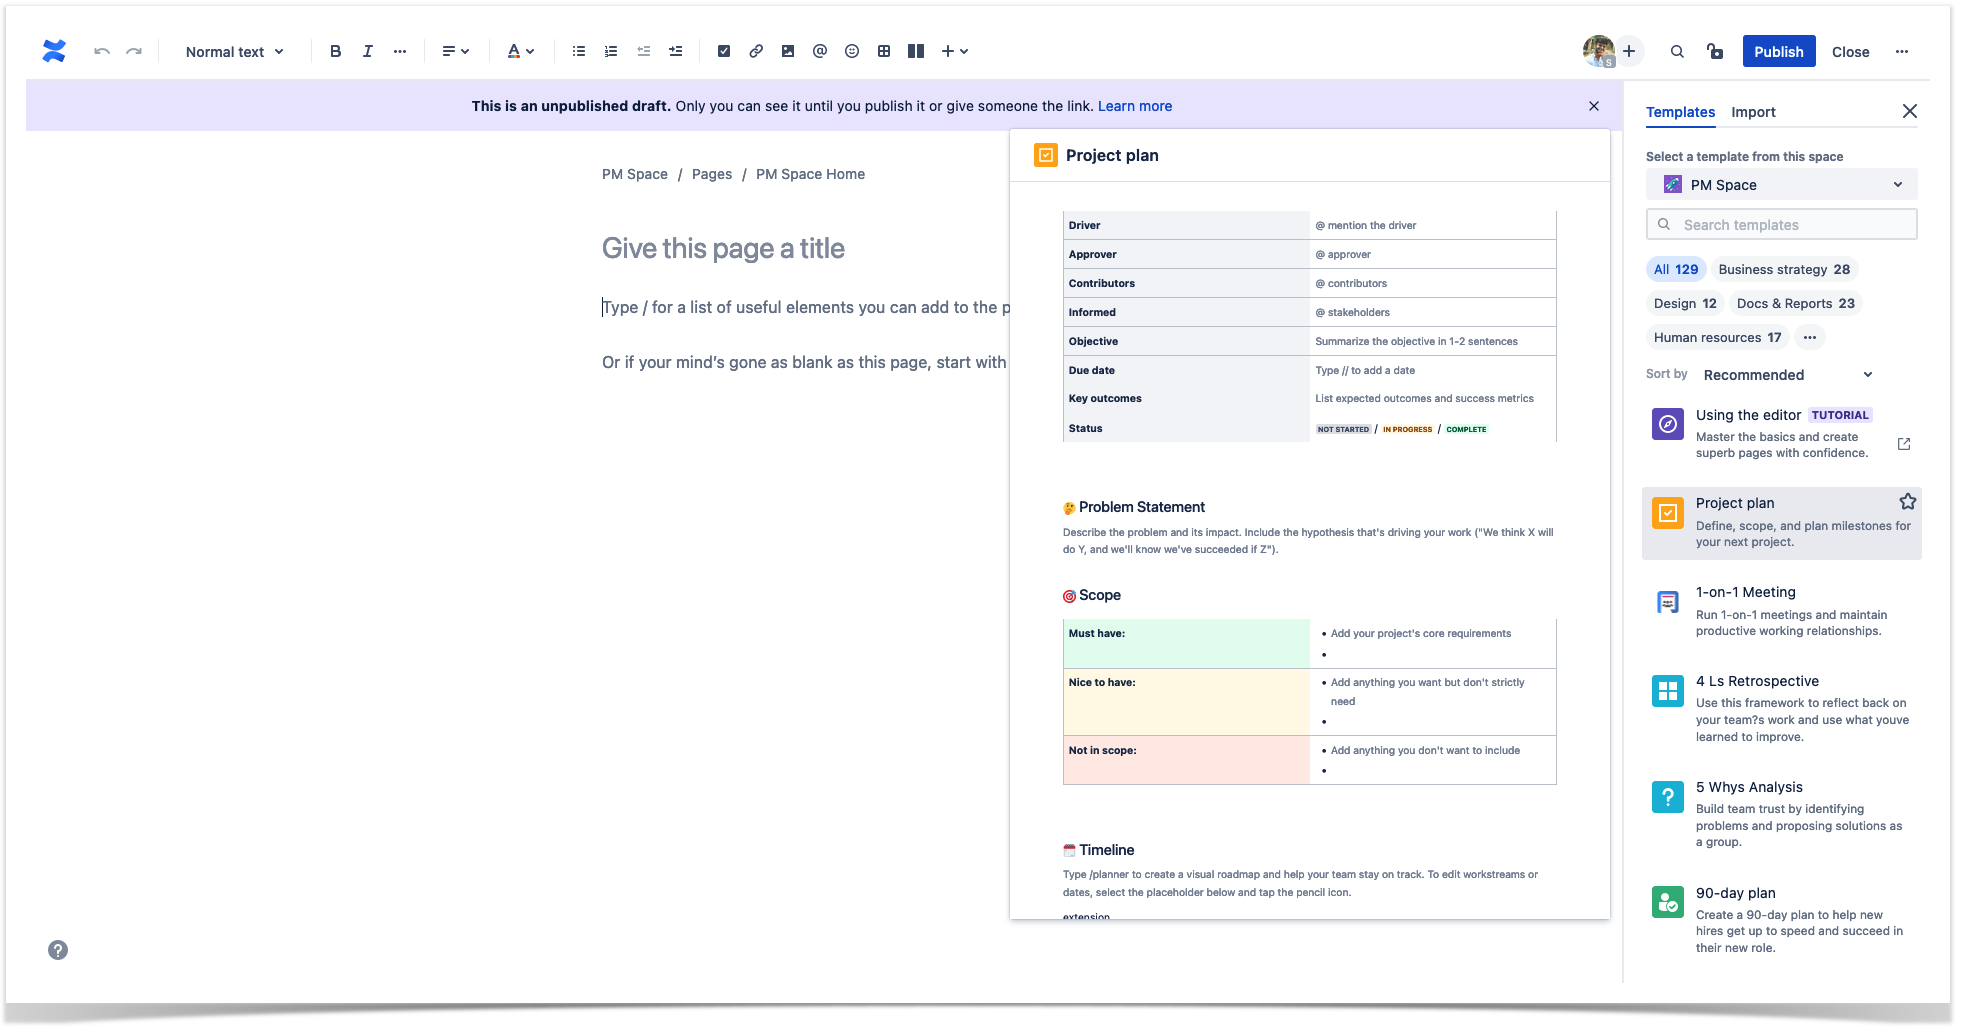
We will start with page templates. Based on tremendous experience and customers’ use cases, Atlassian suggests more than 100 templates for all teams and roles. We’ll work with one of these templates to explore uncommon features.
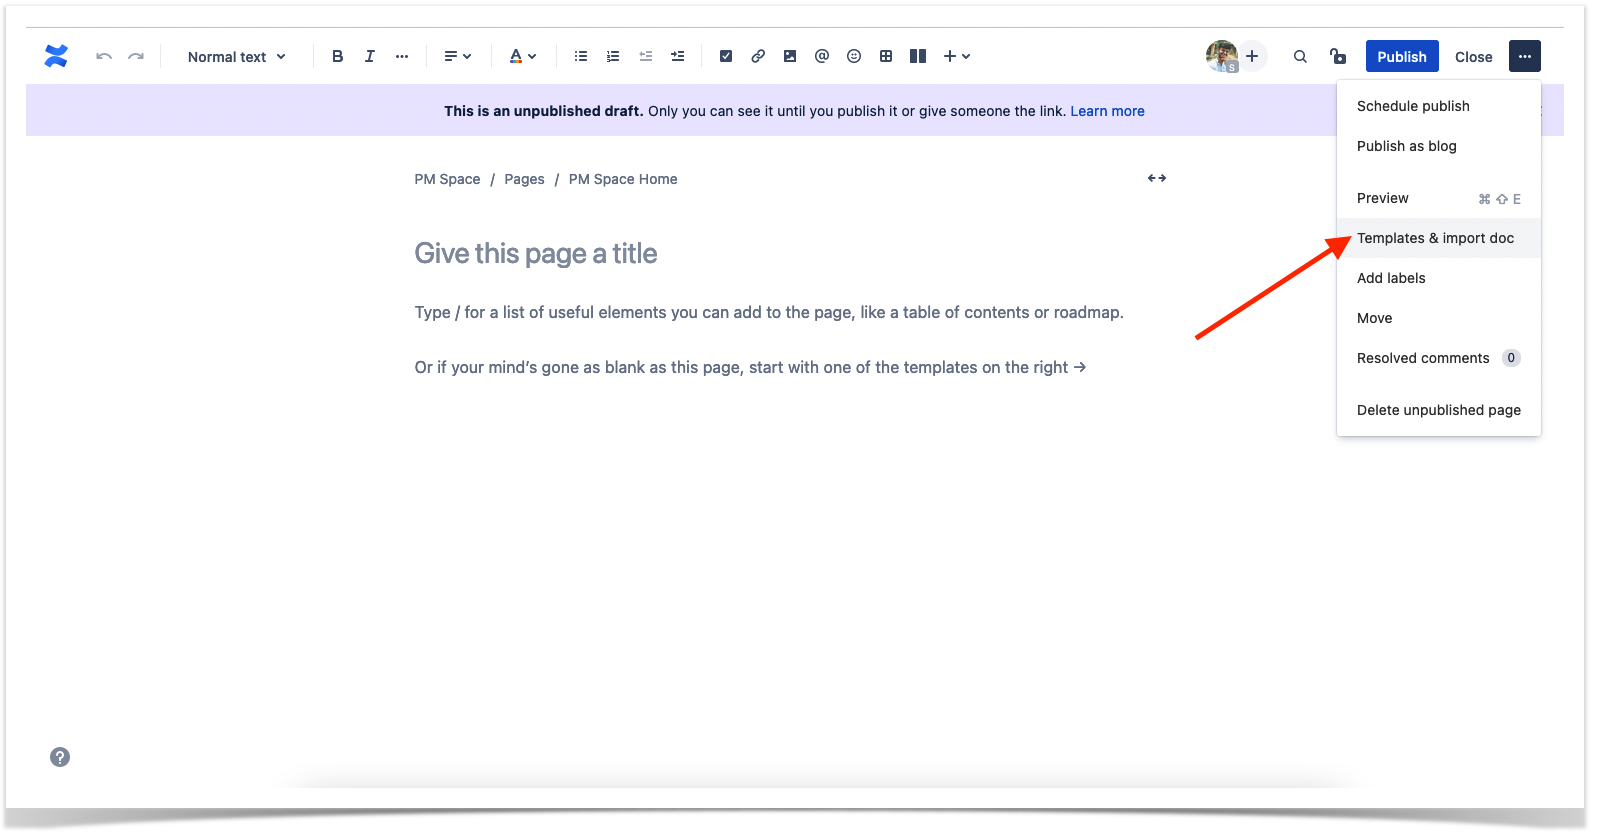
To find the list of templates, click the More actions button in the top right corner of your page and choose Templates and import doc.
Unfortunately, you can use page templates only when adding a page. It is not possible to apply a template to an already-existing page. You can edit the page itself once it is created from a template.
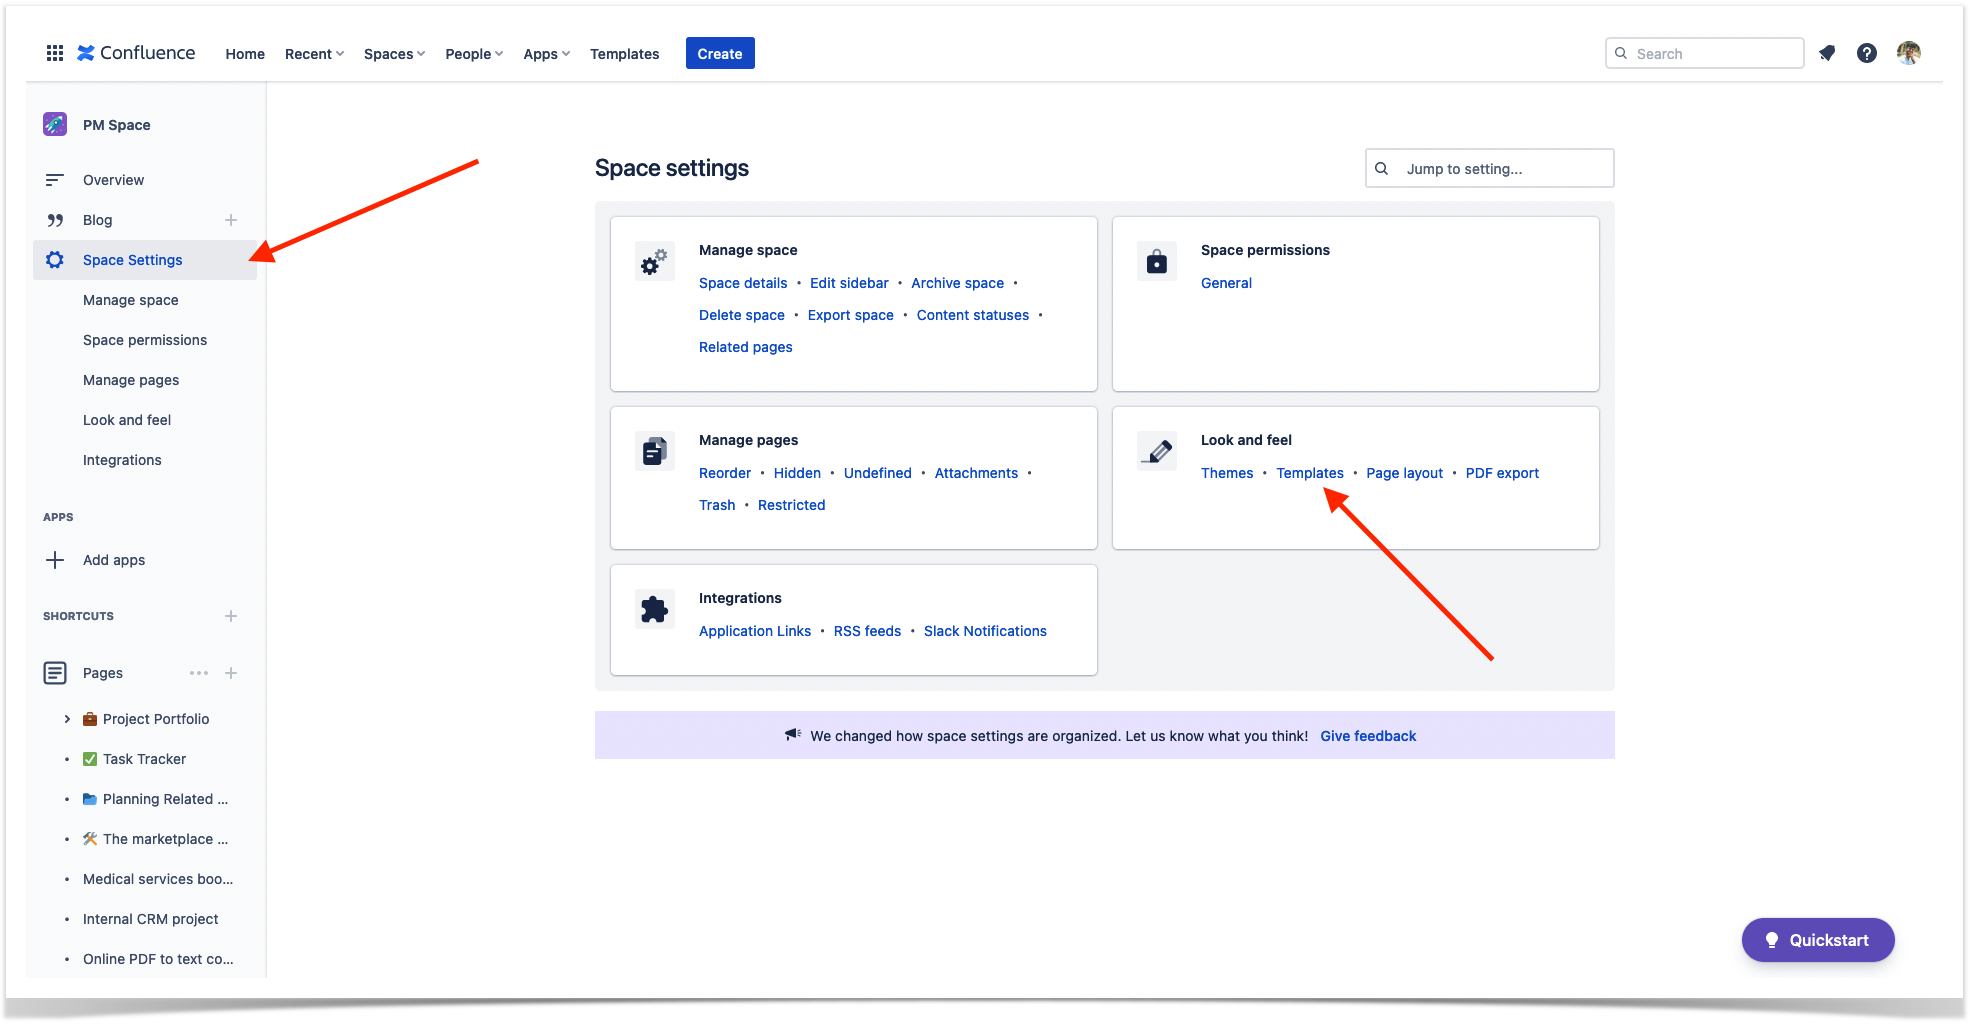
You can create your own templates in the space administration section or edit the existing ones.
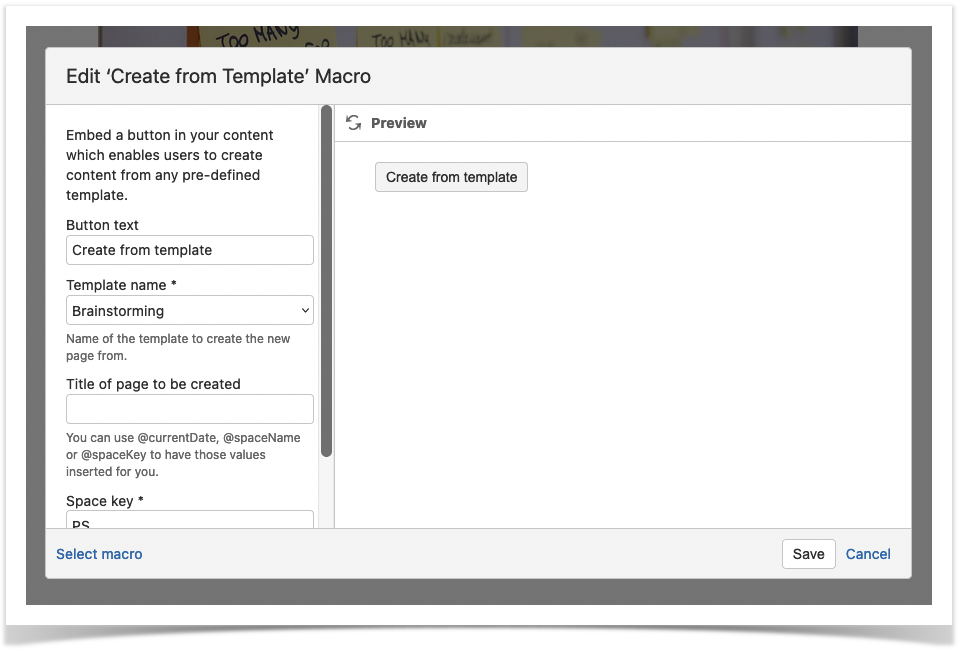
One more helpful feature when talking about templates is creating a button with the help of which you can quickly add a new page with a selected template. In the page edit mode, type /Create from Template and choose the required template from the list.
There are 18 different templates for project managers. In the predefined templates, you can find different frameworks and activities. Let’s select the project plan template.
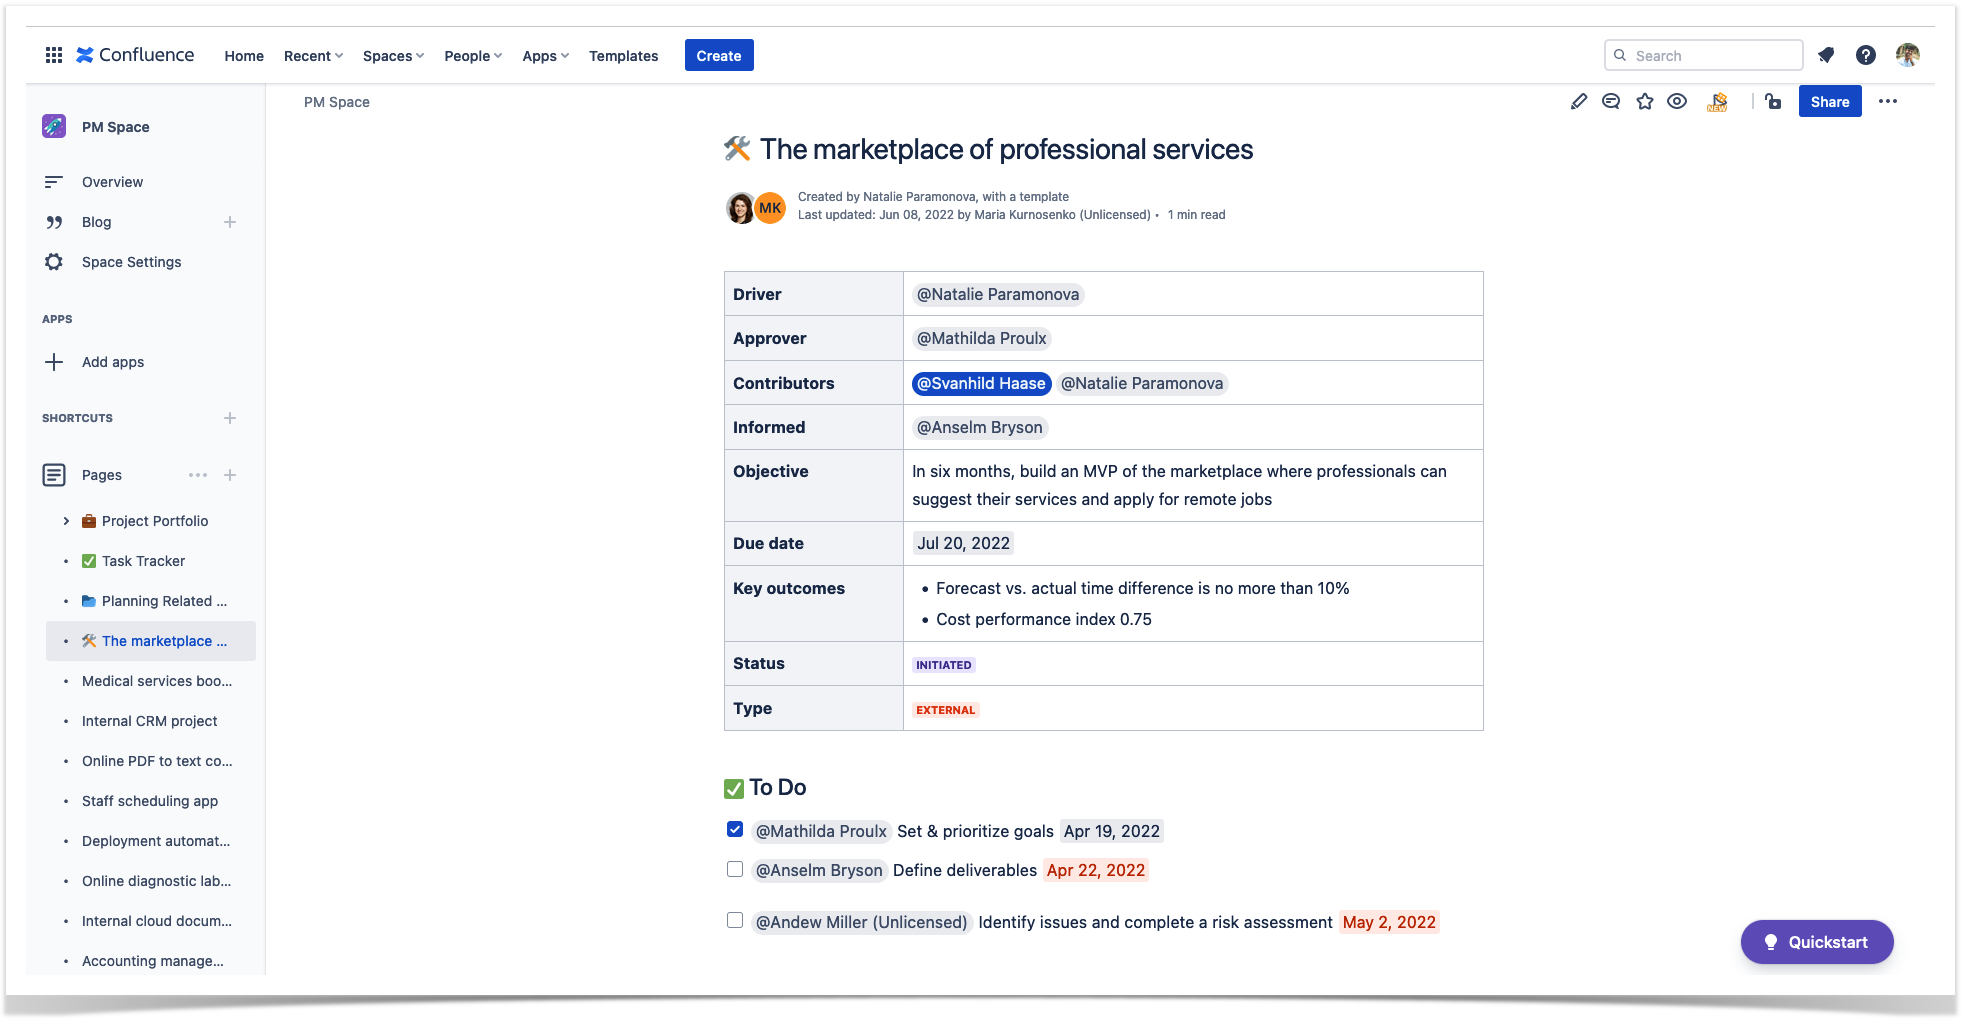
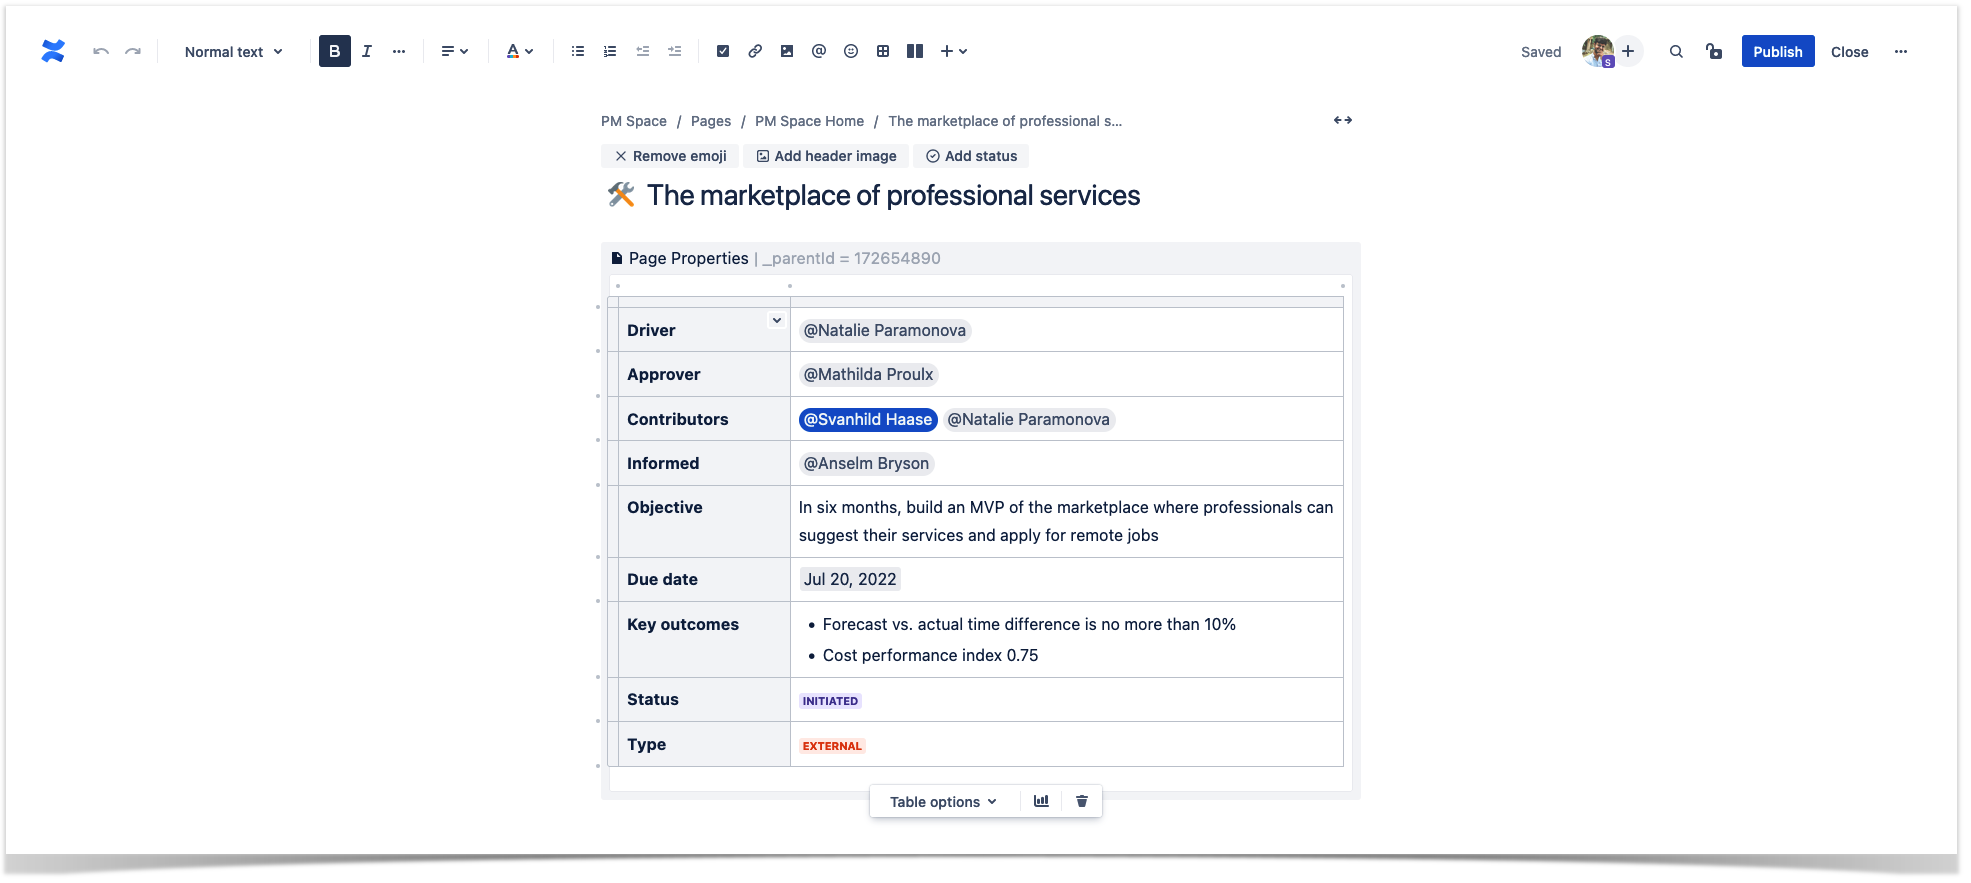
First of all, we fill in the data about our project. We can use different content types to enrich pages: user mentions (type @ and choose the person from the list), dates (type // and choose the date), and statuses (type /status and give it a name). Try adding page covers and emoticons to the page headers.
Now we have some metadata of the project. Try the Page Properties macro to collect data and create a project portfolio later. We’ll insert the macro, place the table with project data inside, and add a label to the page. We’ll describe later what we can do with these macros and labels.
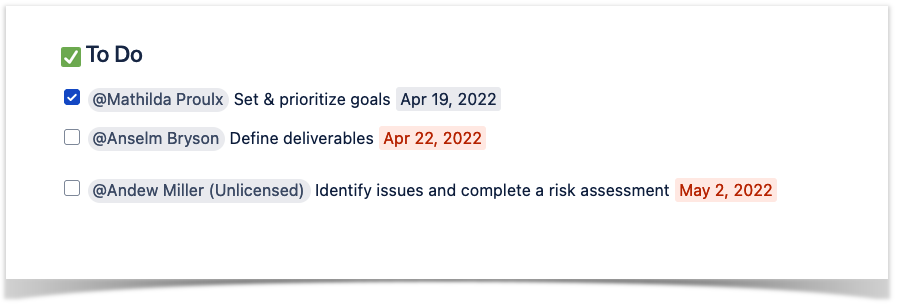
You may need to specify some tasks related to the given project with the help of the native task list feature. You can use it almost everywhere: for meeting follow-up action items, retrospective tasks for improvement, project planning tasks, and much more.
Type two square brackets, press Enter to start the list, or select the option at the editor’s panel. All the features, such as user mentions and dates, also work here.
Project planning
Project roadmap
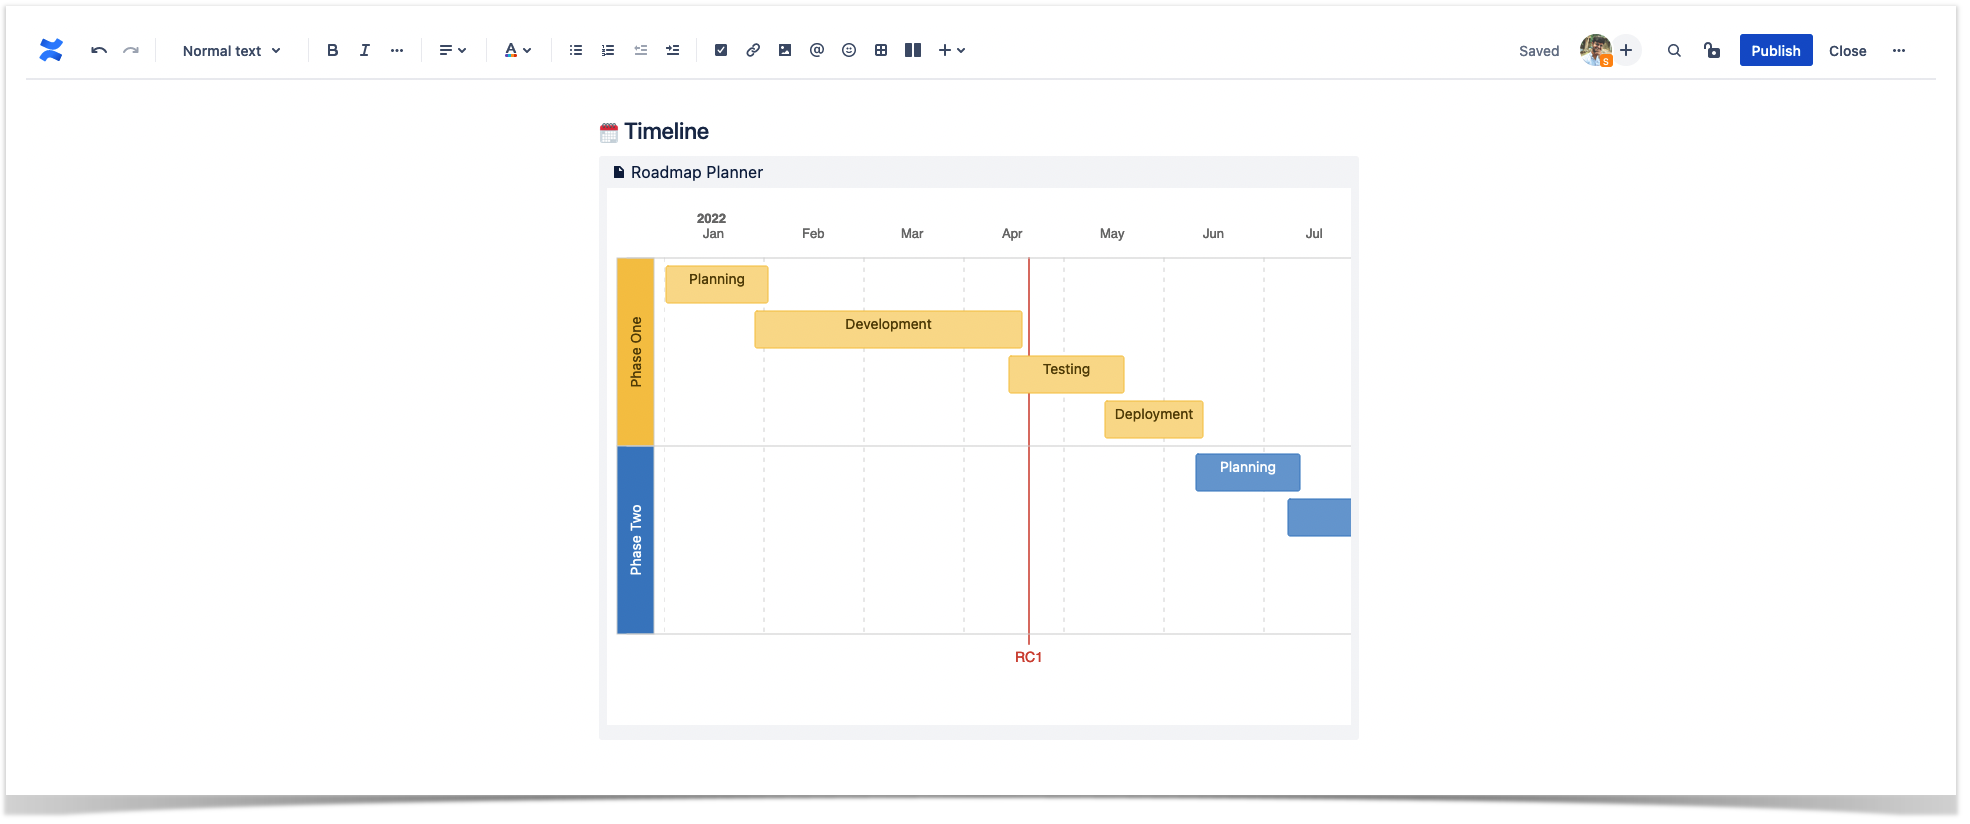
This page template suggests specifying more details. We can definitely do it. However, you can use one more uncommon feature: project roadmap. Type /planner and manually add all the swimlanes, tasks, and dates.
To enhance the native Confluence functionality, you can build the Gantt chart with the help of the Chart from table macro bundled in the Table Filter and Charts app.
If it’s easier for you to plan in a table view, you can build a Gantt chart in a couple of clicks. Watch this video to see how to do this, or read our blog post 5 Tips to Become a Gantt Chart Expert Using Atlassian Confluence.
Jira issues macro
One more option to create an approximate project schedule is using Jira data. If you already have a corresponding Jira project, you can display Jira data on the page with the help of the Jira issues macro by typing /Jira; you can use any of the native Jira gadgets.
To output a list with the Jira issues, you can type some JQL into the macro configuration or copy and paste a link to the favorite filter from the Jira project. Configure the table view of our chart macro by selecting what columns to display.
Our first project page is ready, and we can publish it.
Organizing and reporting
Of course, we don’t have only one solo project. We can store dozens of pages dedicated to different projects, requirements, tasks, meetings, etc. And here starts the reporting magic of Confluence. You can collect specific and related content together to have a bird’s eye view of what’s going on with projects, tasks, and any other content type.
Watch this video by Atlassian to learn more about creating and customizing a project requirement page in Confluence.
When you have many pages, you can easily track and control how the projects and tasks go with the help of native reports.
Page Properties Report
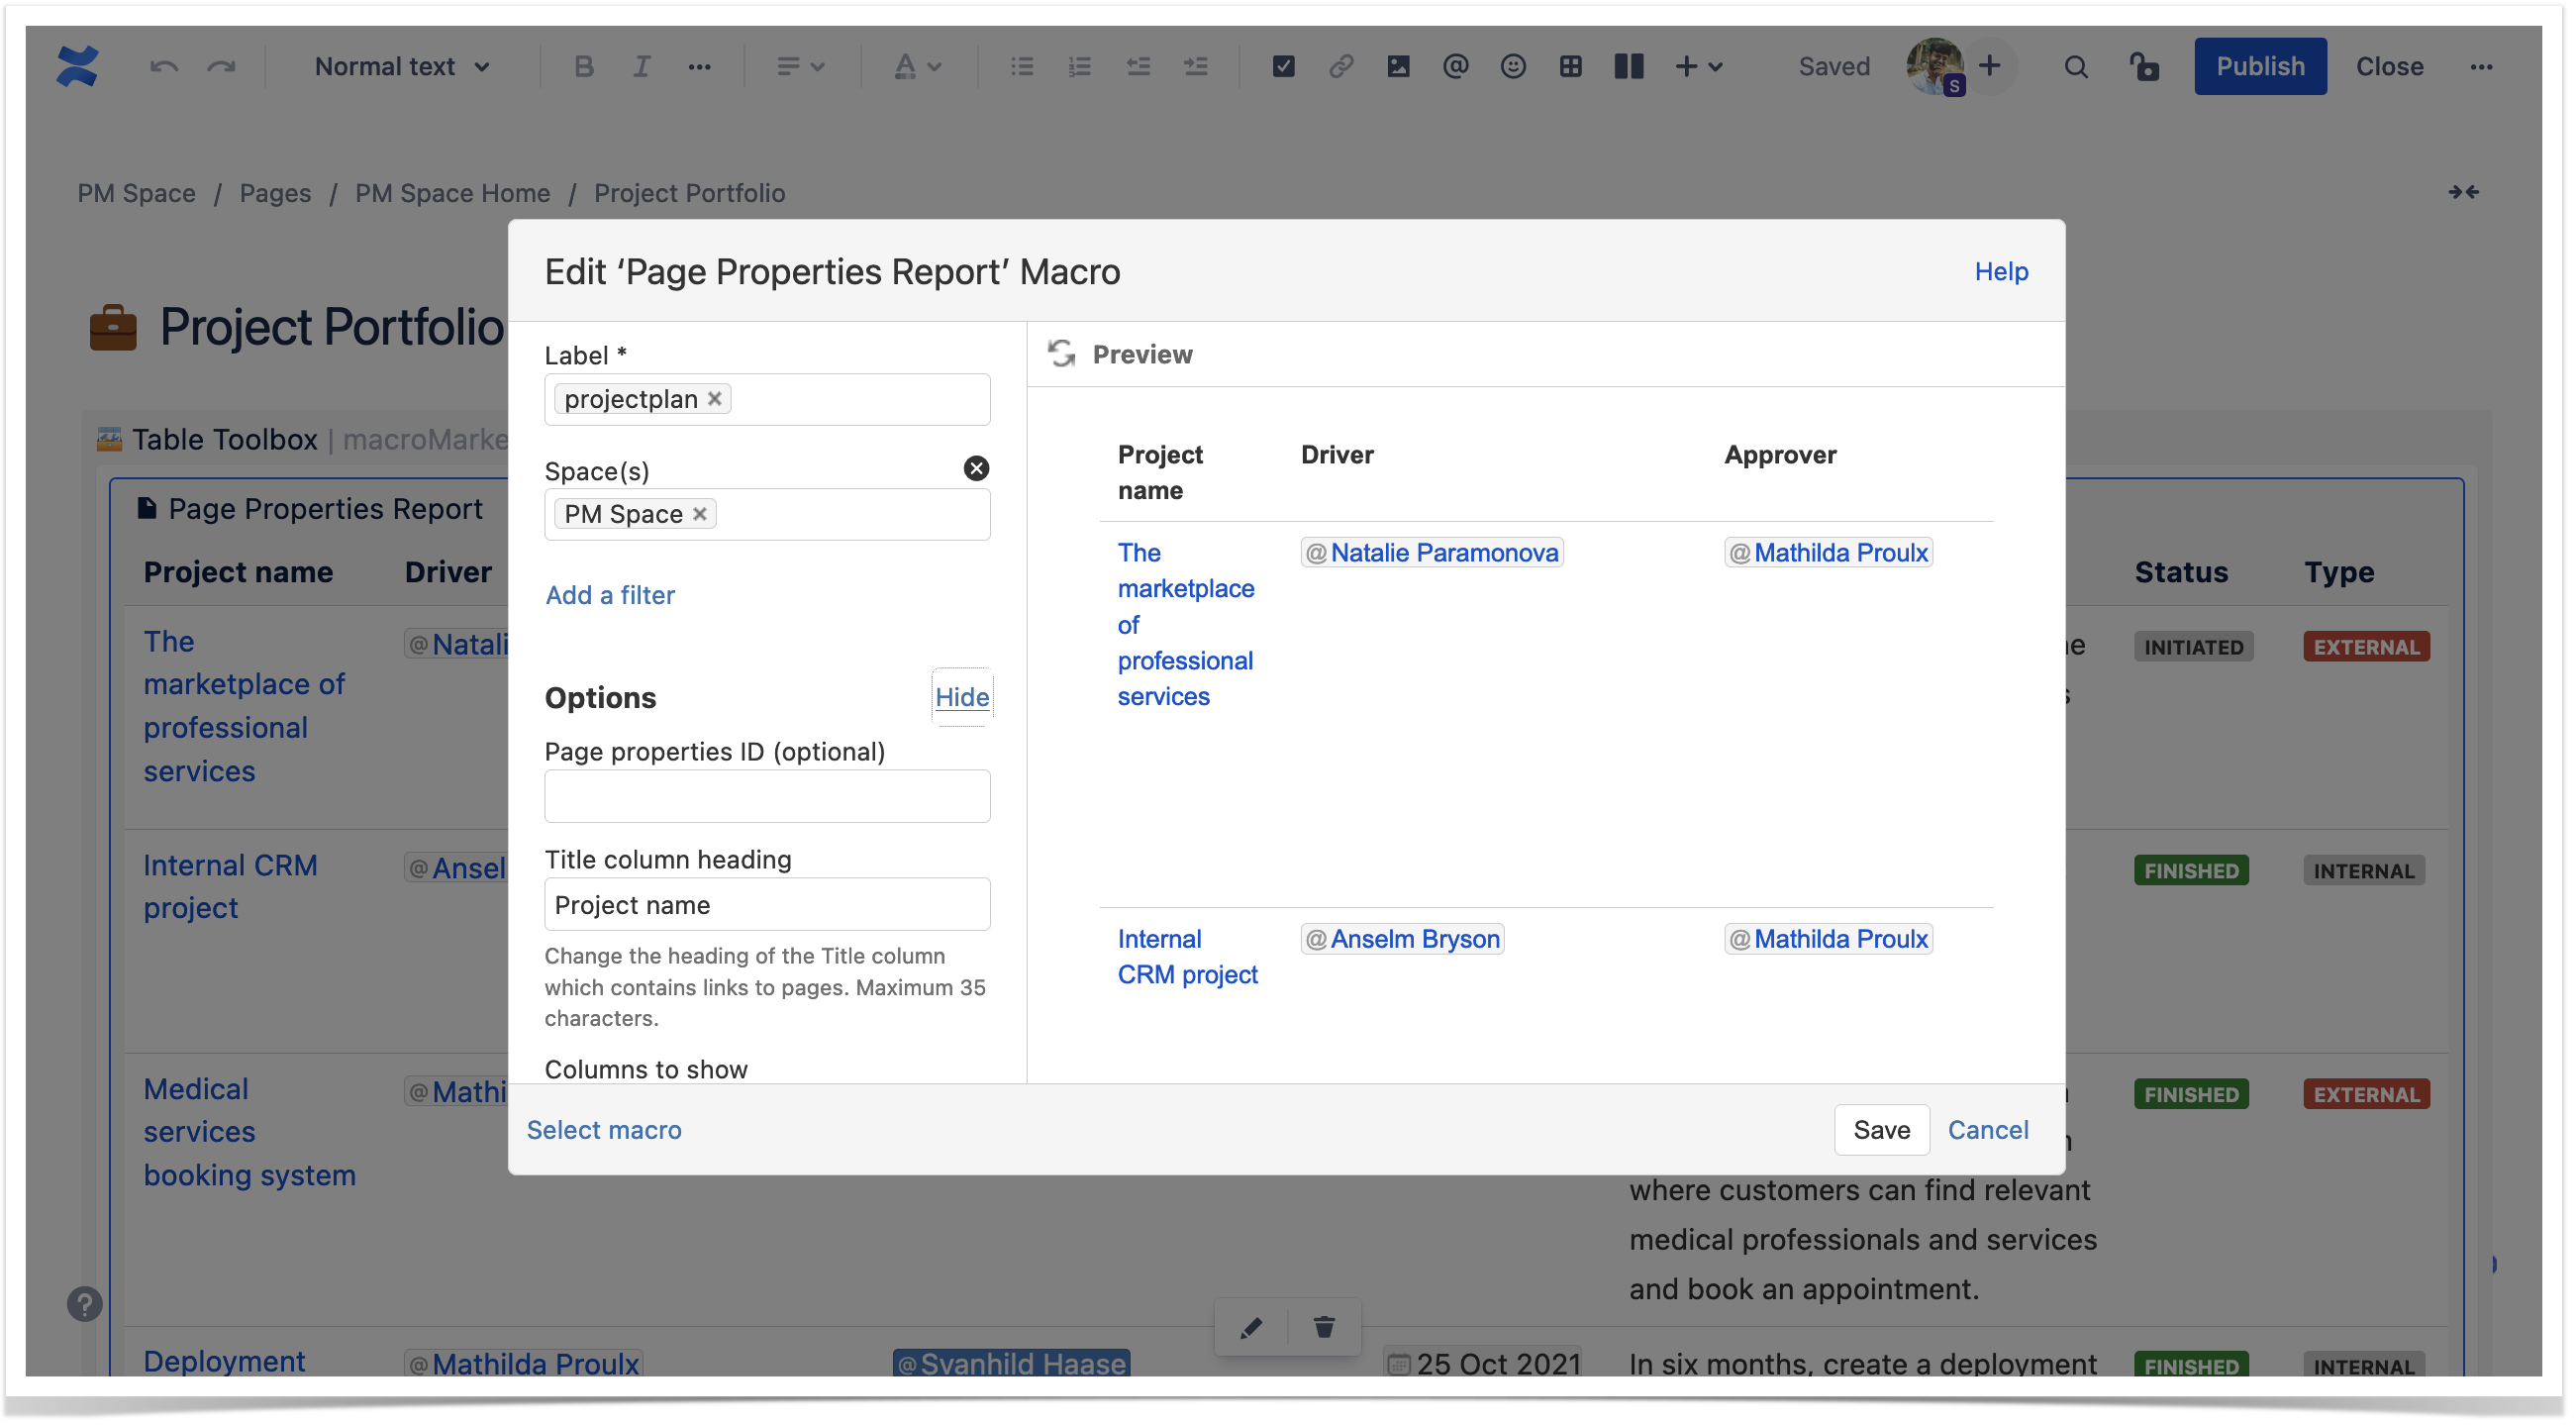
We’ll start with the Page Properties Report. Previously, we inserted page properties, placed the project data table inside, and added a label. Now we can collect all these separate project pages in one report, creating a project portfolio page. Insert the Page Properties Report macro, and specify the label.
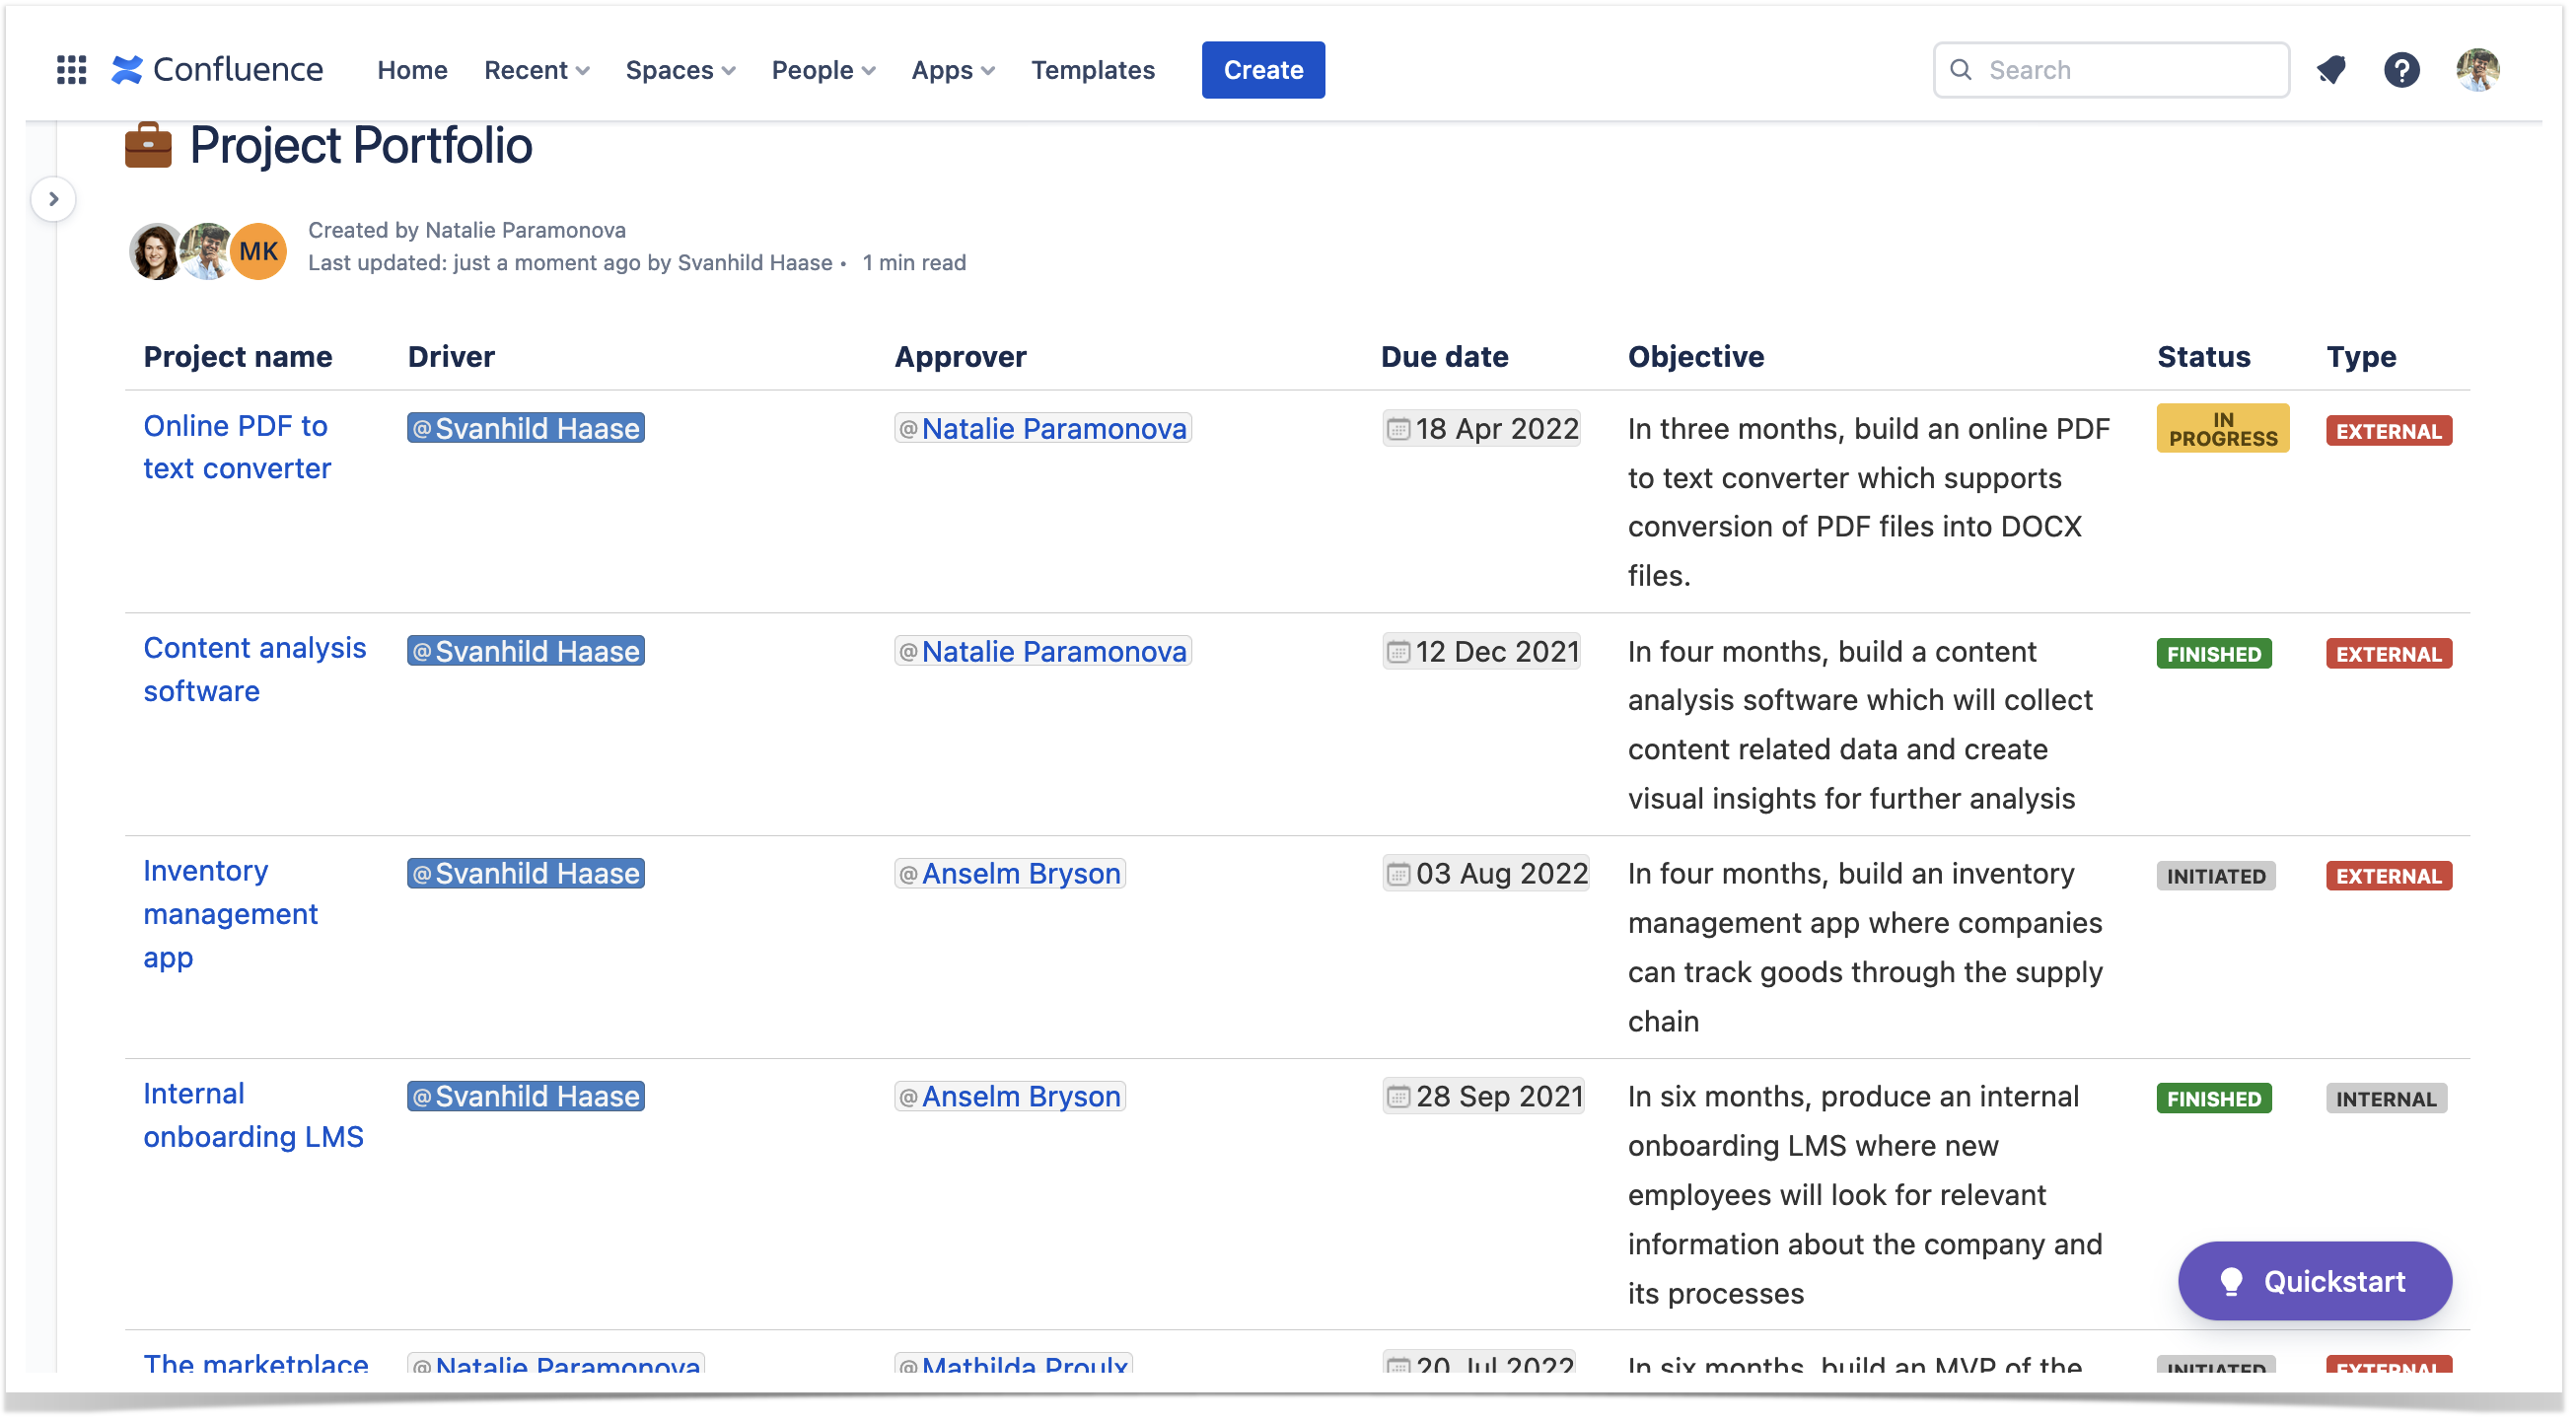
Voila, the report is here with the list of all the projects. You can click any of them and see the page with details.
Task Report
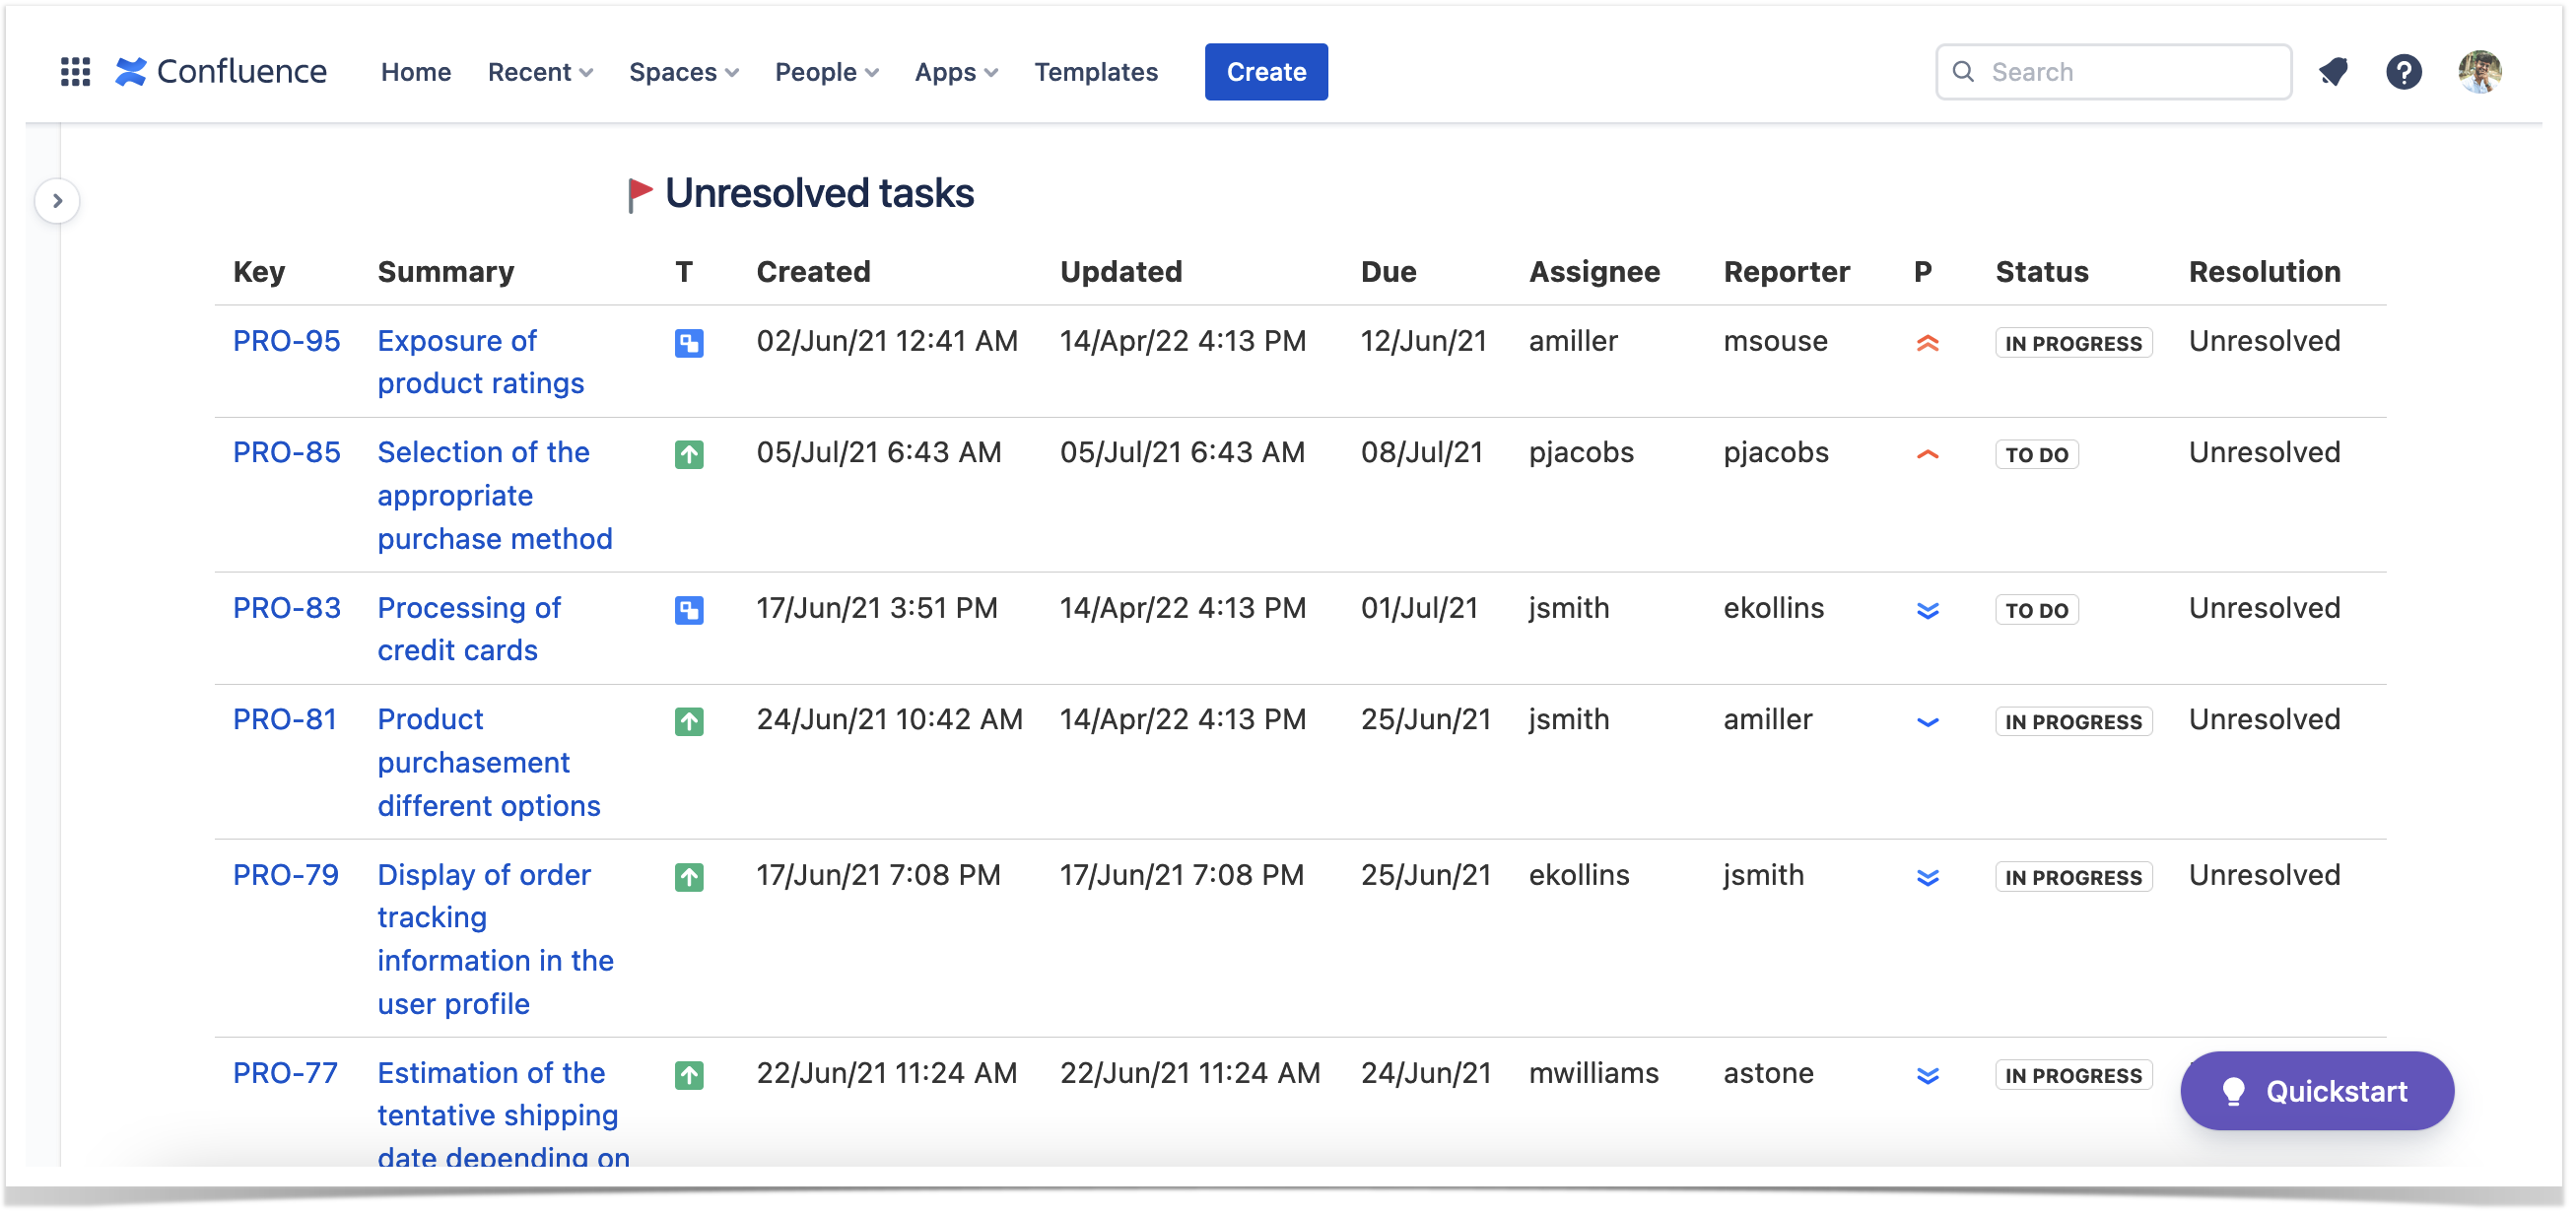
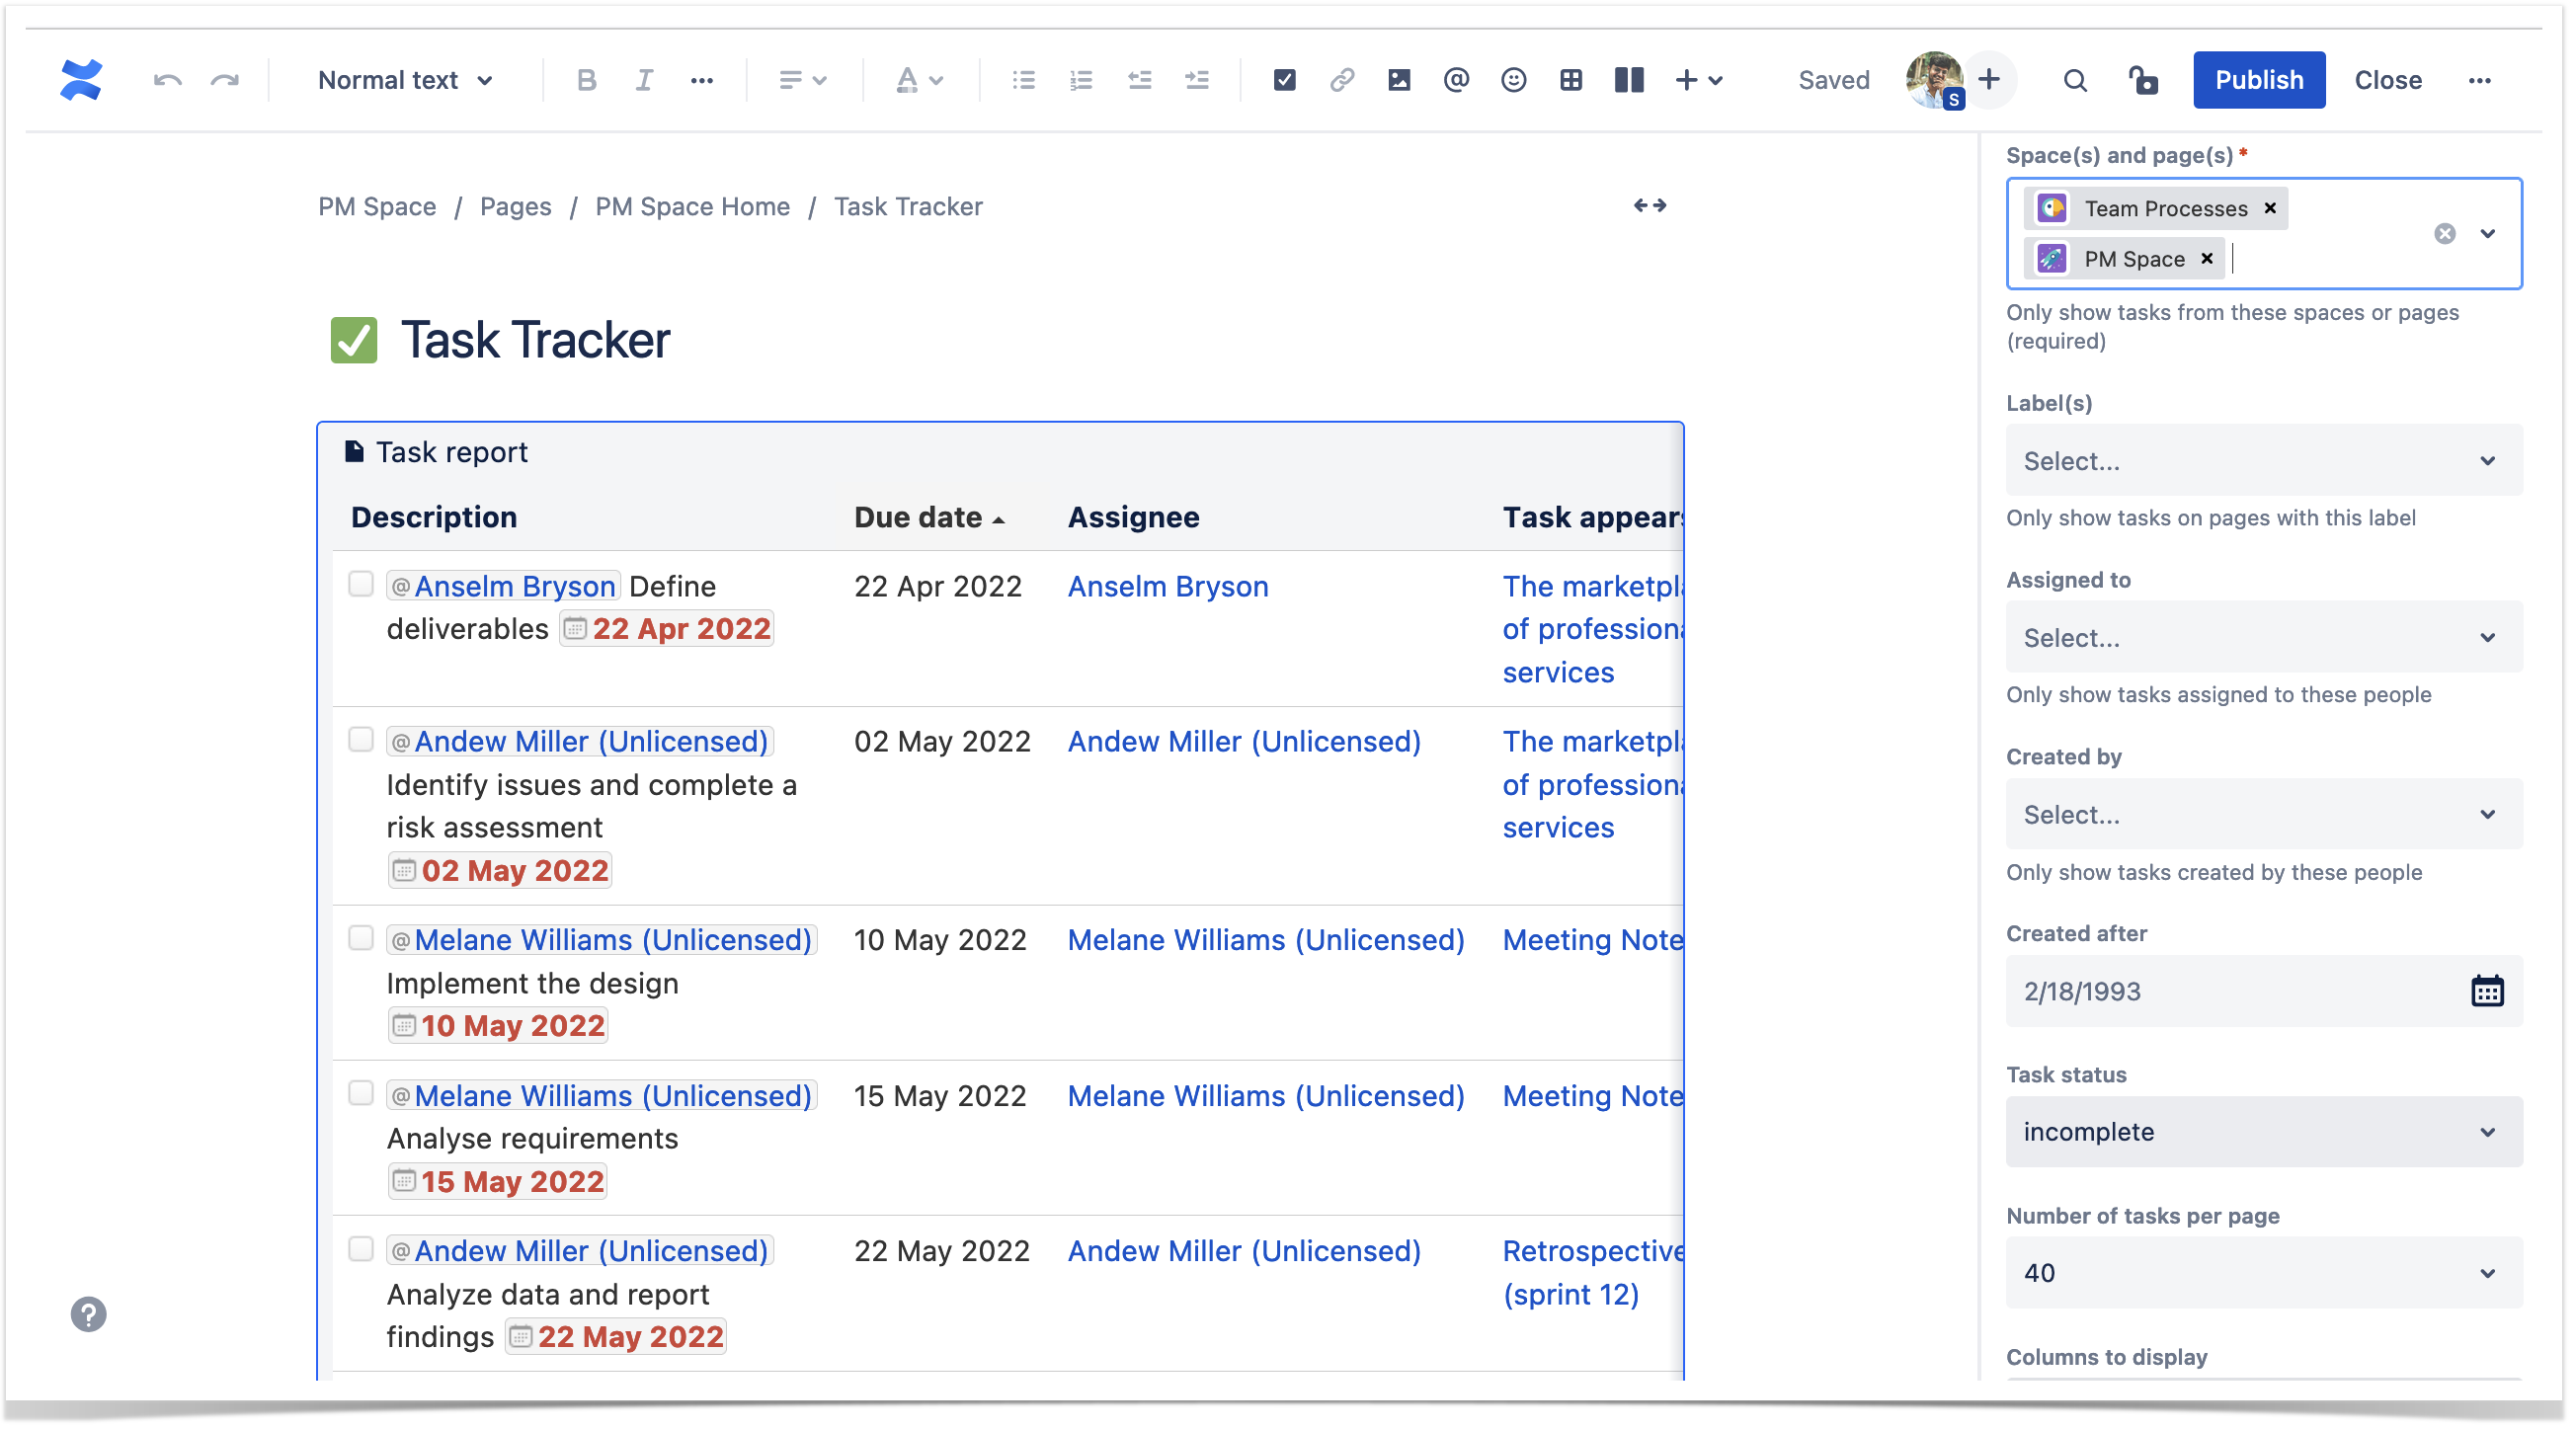
Let’s move to the second report. When you have tons of tasks across your Confluence instance, you can collect them on one page. You can create a task wrap-up using the Task Report macro to keep track of all the tasks across specific pages, spaces, or people. Note that one macro can display only complete or only incomplete tasks. To display both types of tasks, you can copy and paste this macro.
Labeled content in Confluence
Another report helps find related content by labels. You can choose any of the three options.
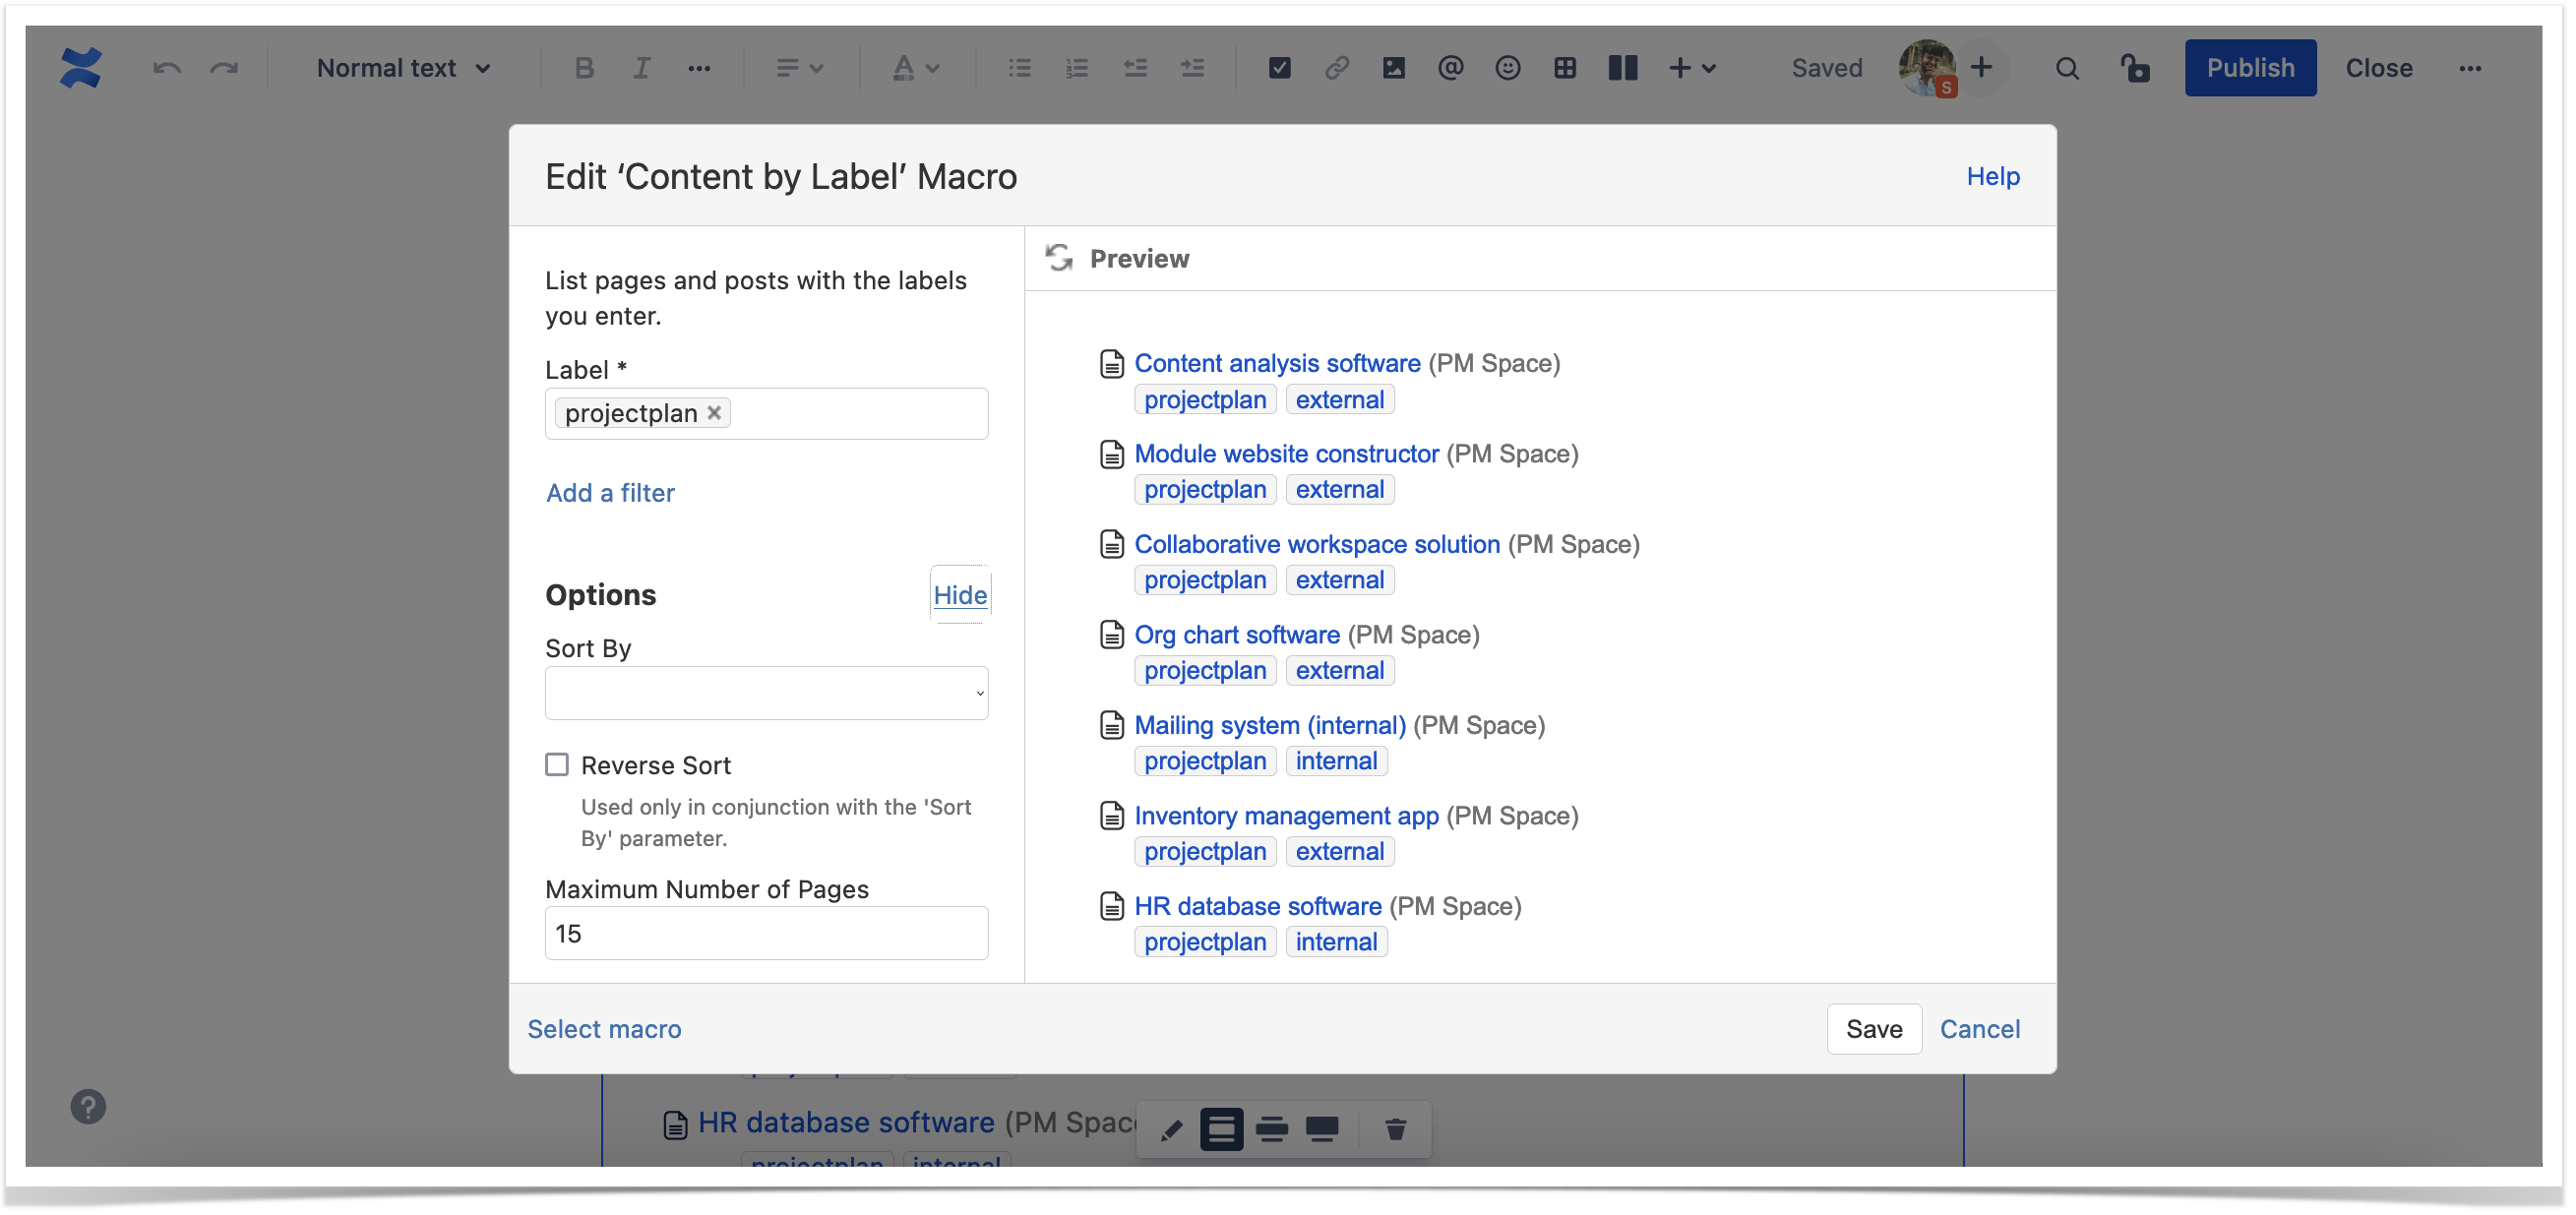
First, click the label at the bottom of the page and see the list of all the related content on all the pages with the same label. The second option is to use the default Confluence search. You can filter content by labels. And the third option is to insert the Content by Label macro that will display all the pages with the same label you need, and you can use it to create something like databases of your content.
Enhancing the native features with apps
Now you know more about the native Confluence features that help project managers almost daily.
It’s time to see what you can do with all this information about your project with the help of the Table Filter and Charts for Confluence app. Let’s compare the pages we just created and see how we can enhance them.
For example, we can replace our manually created table with project requirements by the Page Properties Report macro that collects data about all the requirements that you can store separately on different confluence pages. You can add all the new data to each of these requirements descriptions and gather them into one huge report.
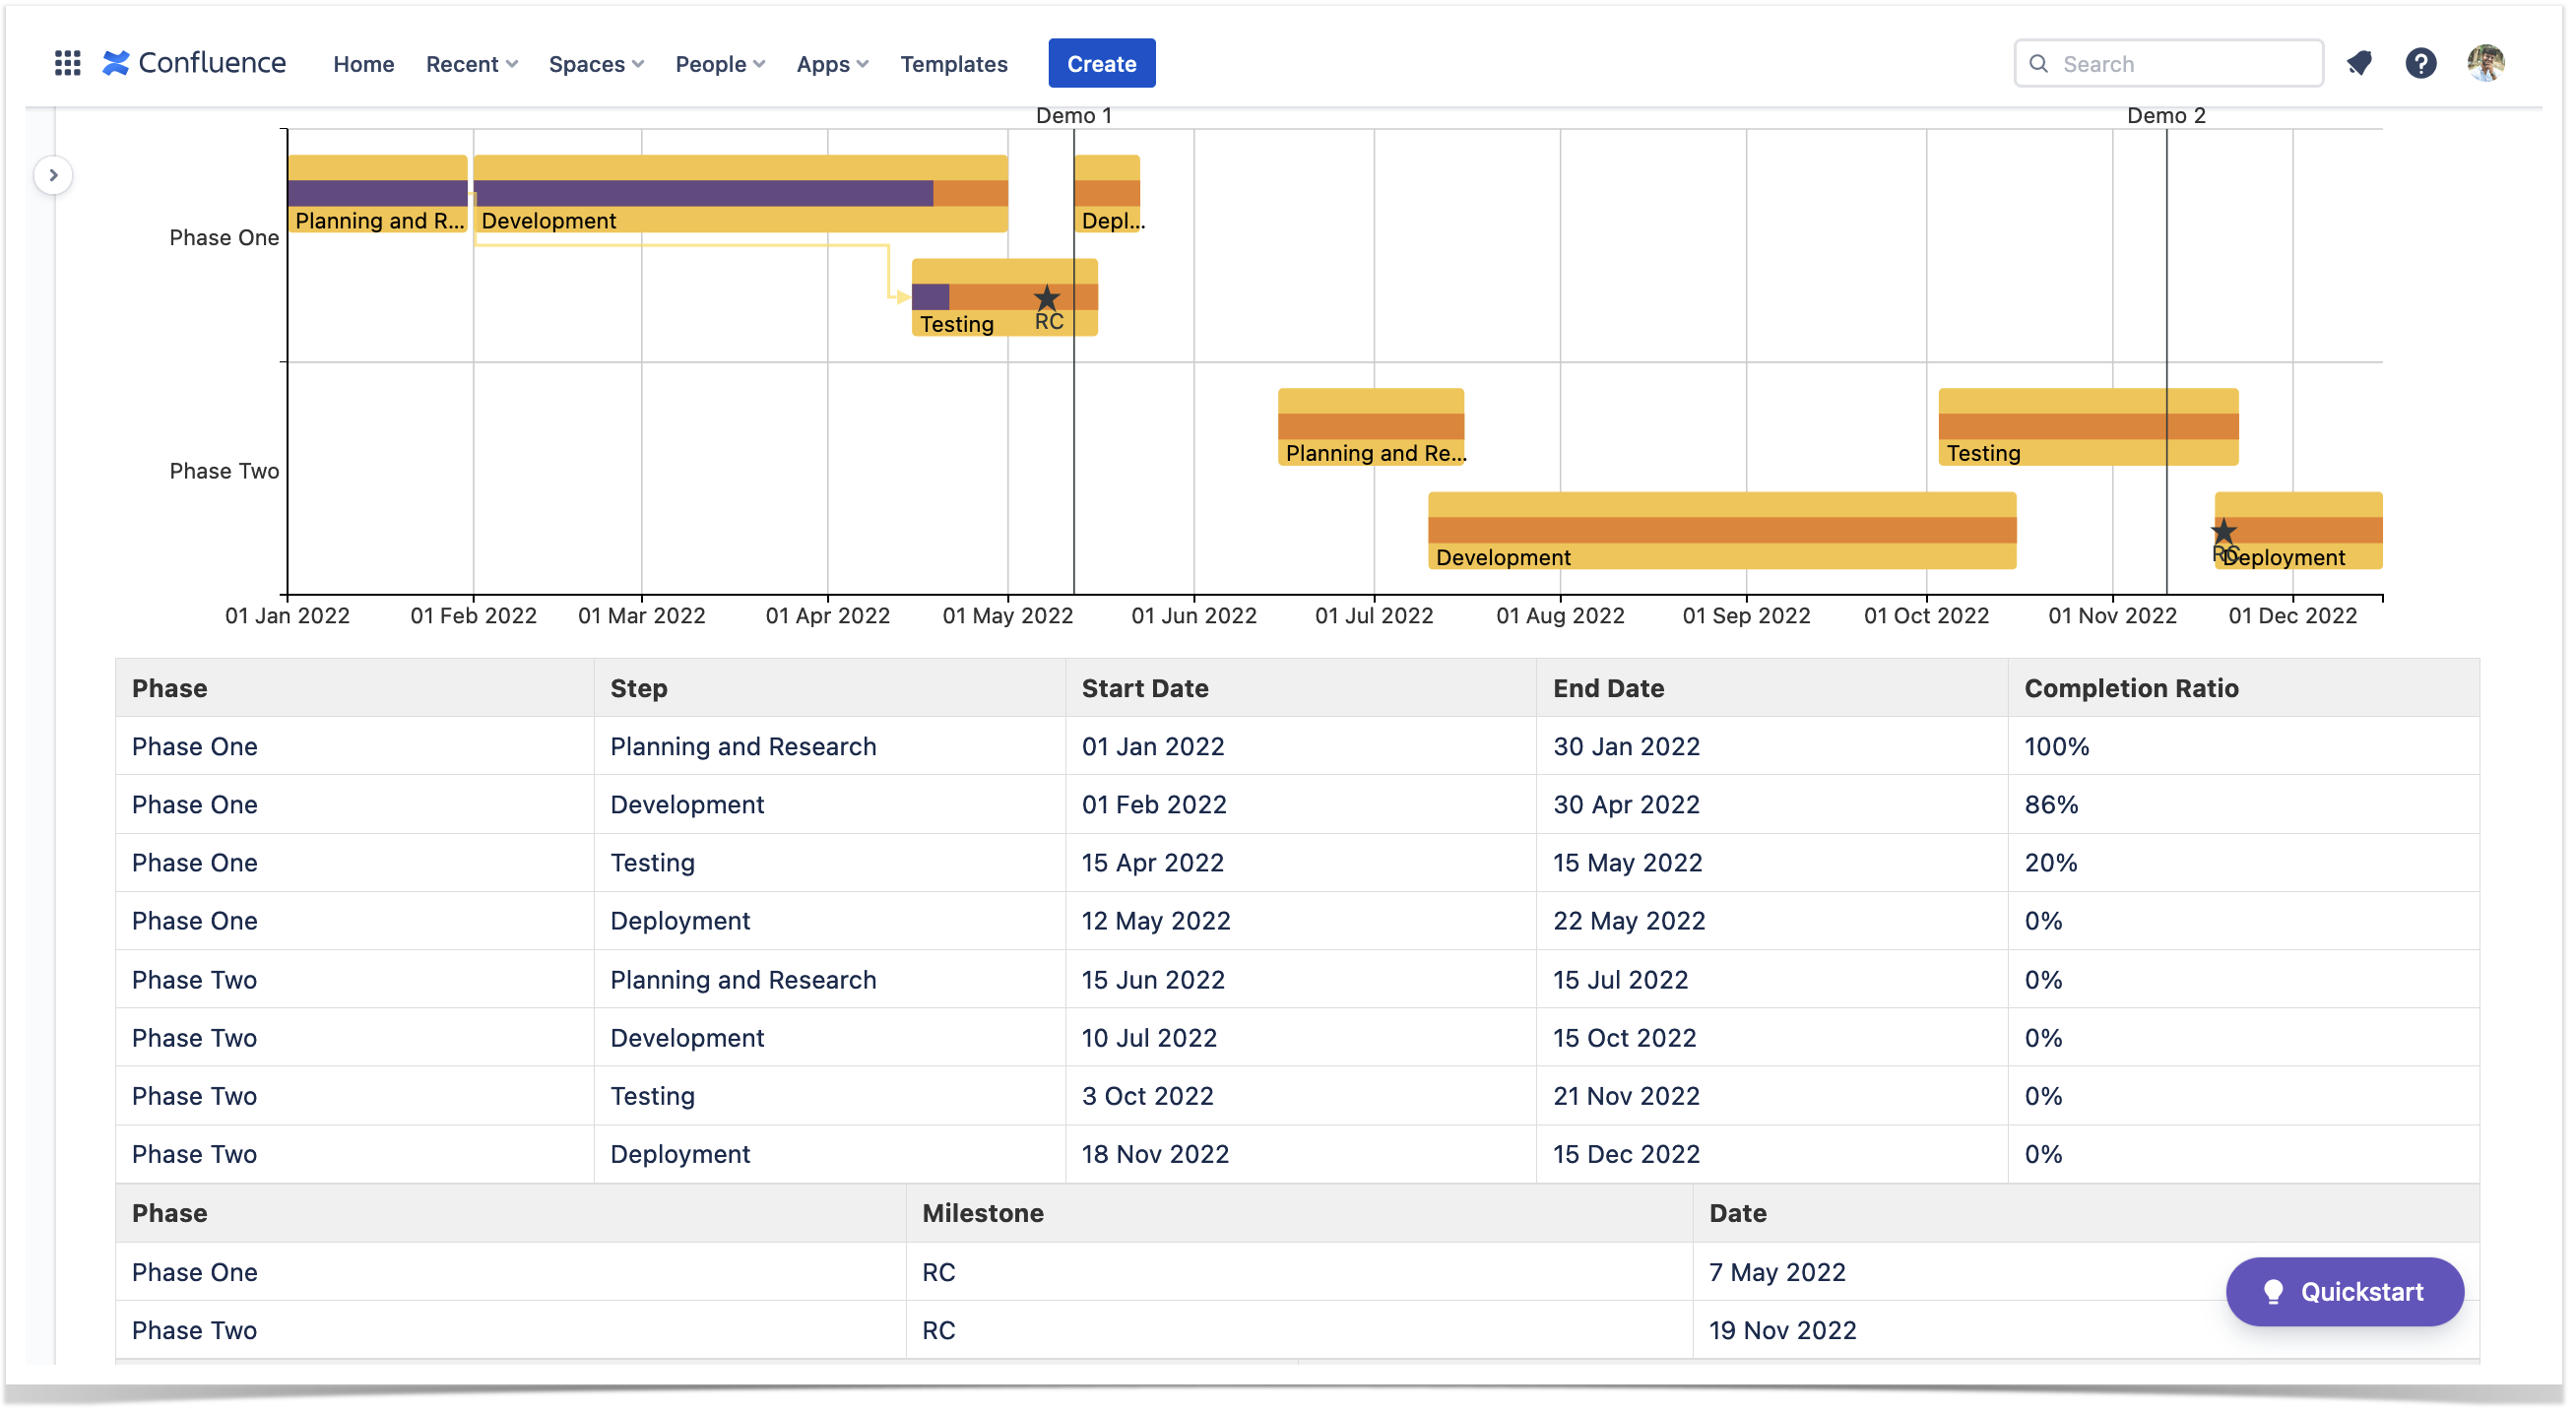
Instead of a native project planning tool, we can use the Gantt chart type from the Chart from Table macro. The Gantt chart type displays all the tasks related to your project and shows them on a timeline. You only need a source table with tasks, names, and start/end dates.
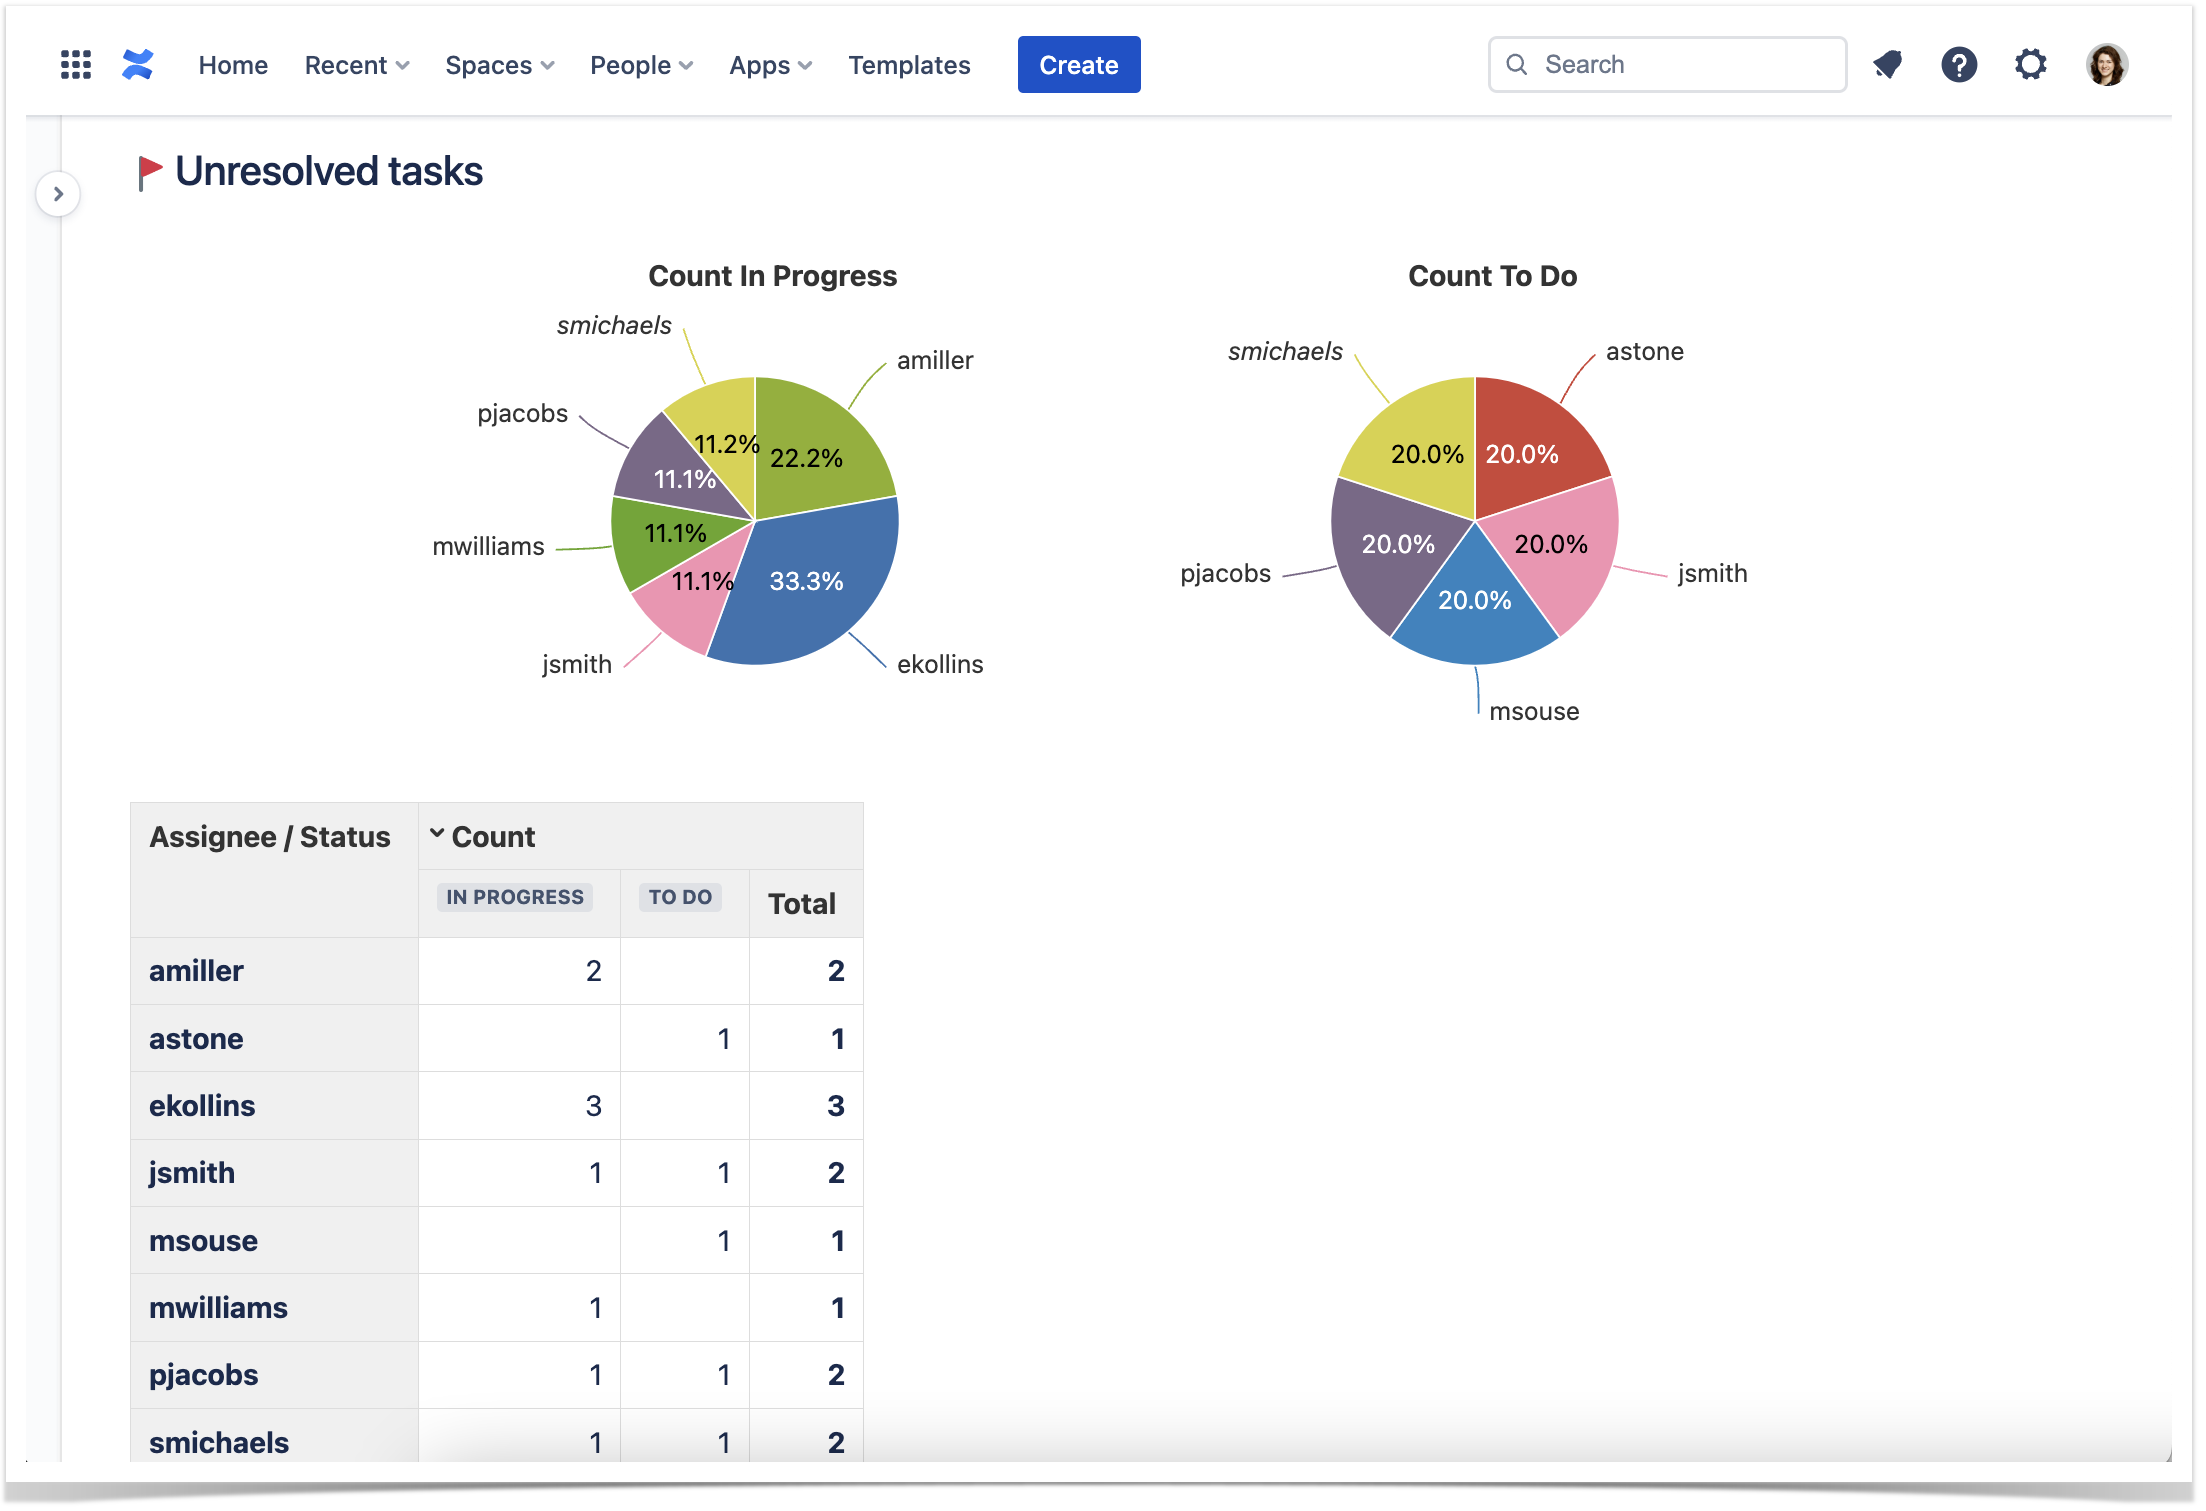
The third upgrade we can make on this page is to power up the Jira Issues macro. Now you can see that it’s not only a list of tasks pulled from Jira, but this is a list of grouped values.
We can see how many tasks are in progress and are in the backlog of our contributors and who. You can quickly visualize this data when you use charts created with the help of the Chart from Table macro. You can click on any sector or bar, and the source table will be filtered for better viewing and analysis.
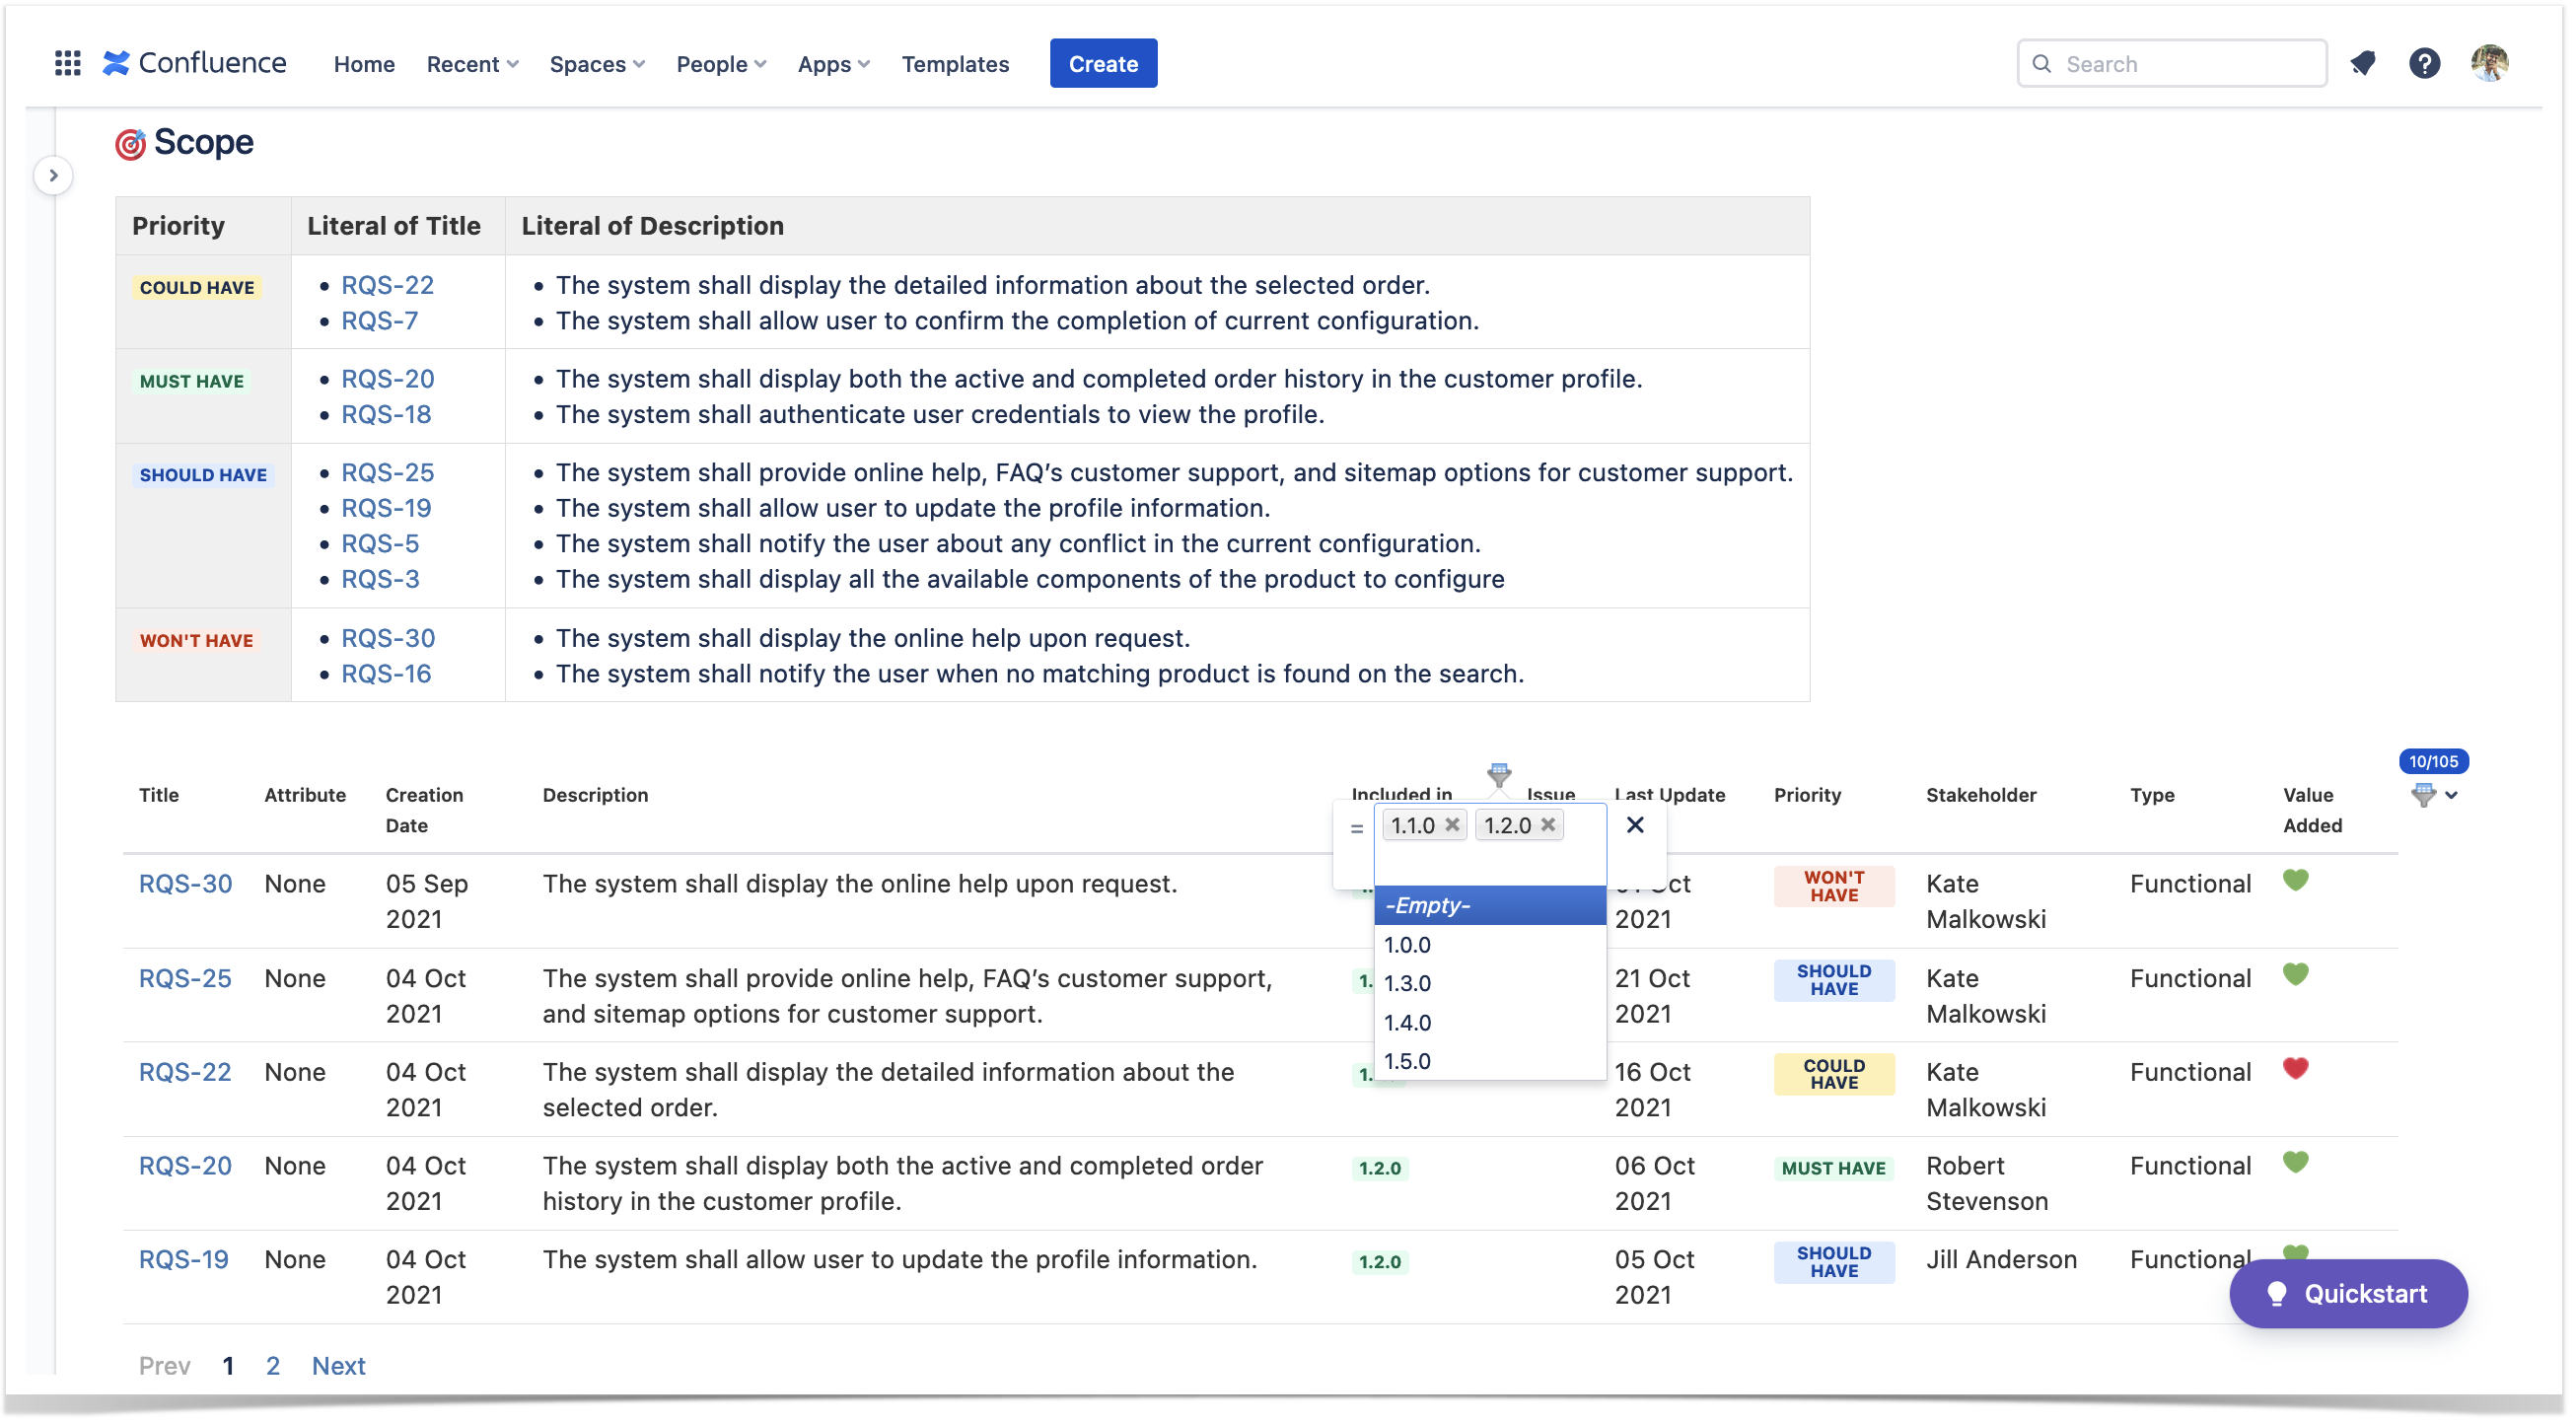
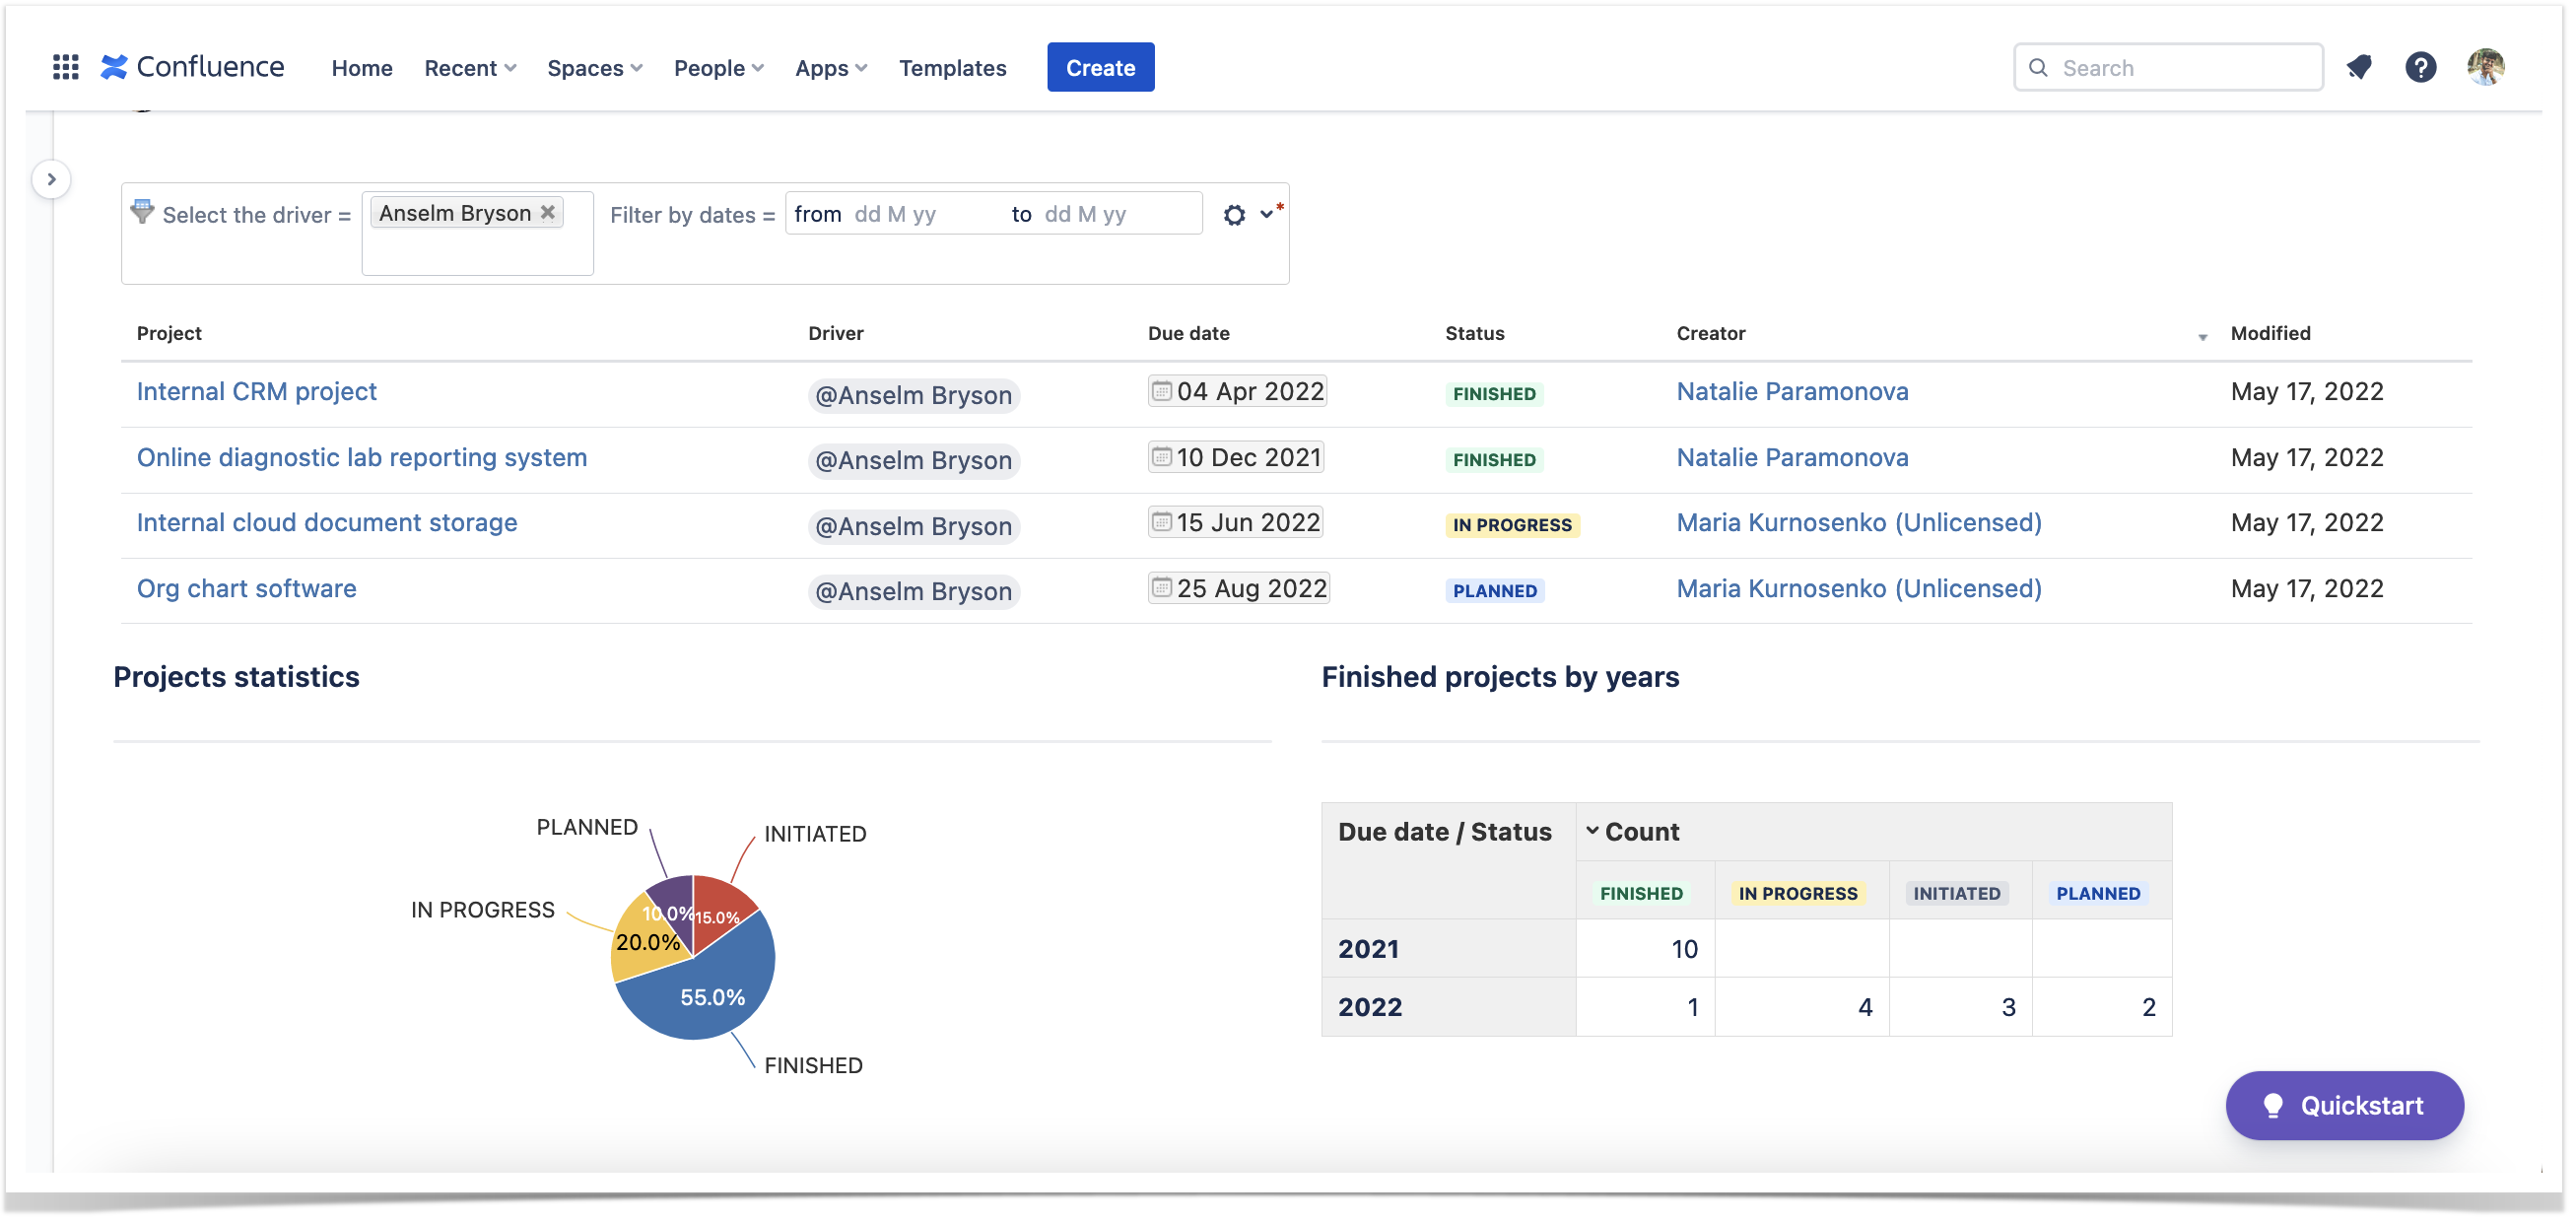
Let’s see what we can add to our Page Properties Report and Task Report macros. With the help of the Table Filter macro, you can quickly filter the data by the project drivers or due dates. Moreover, you can combine this macro with the Pivot Table macro and Chart from Table macro.
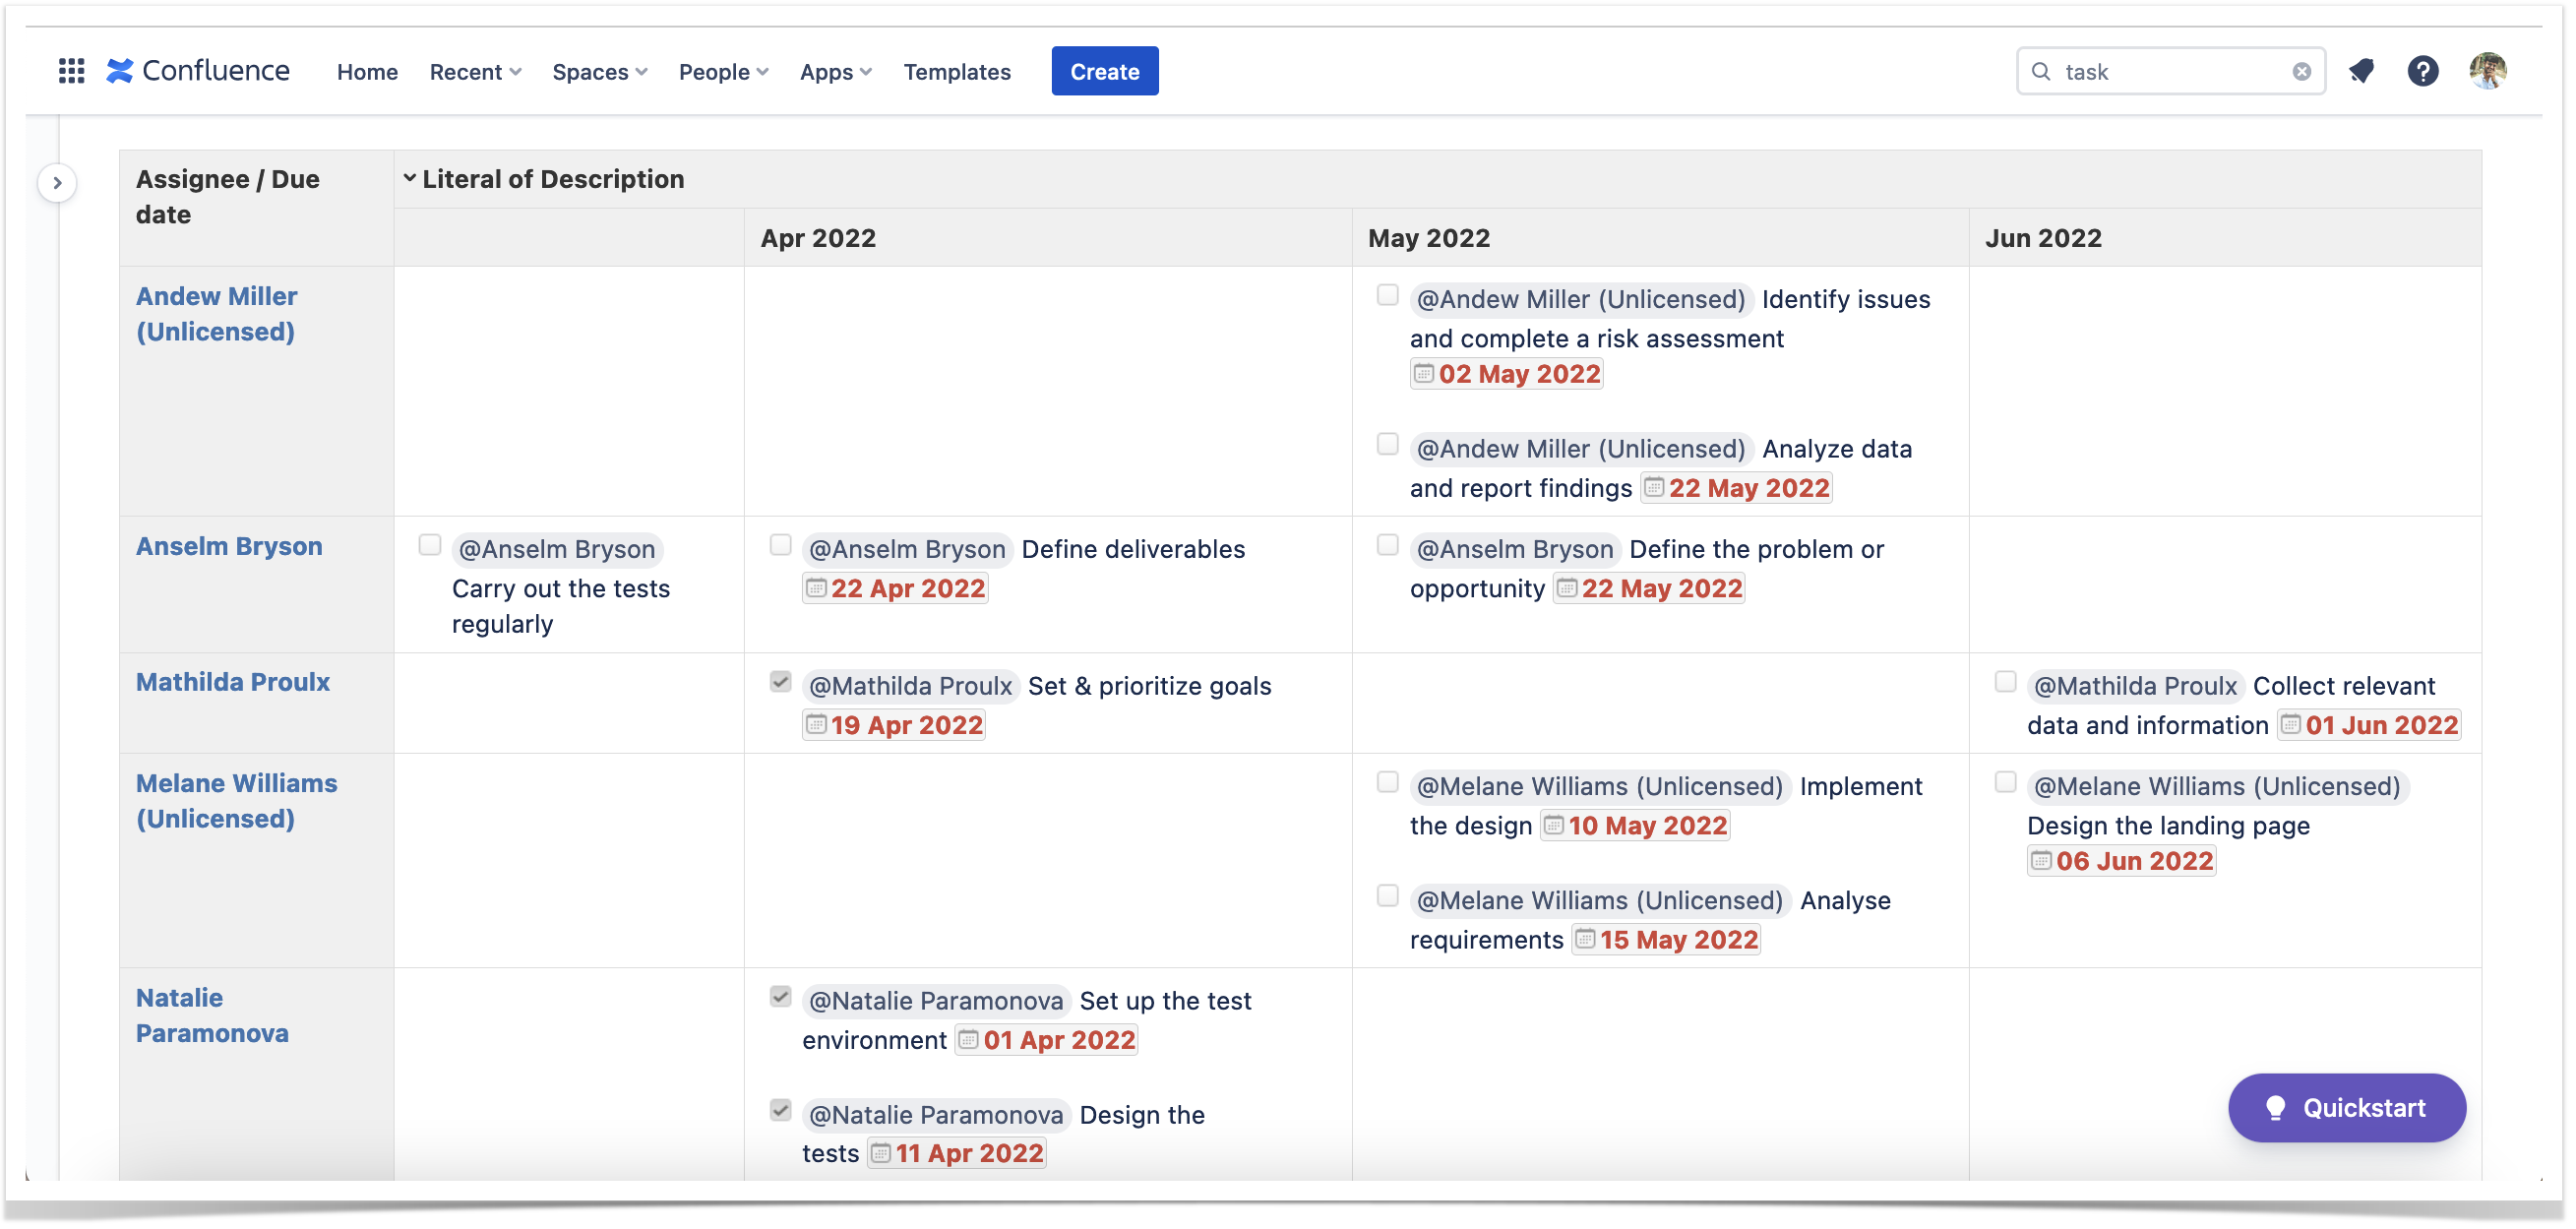
And finally, with the help of these macros, our task report turned into almost a calendar where we grouped our tasks by assignees and the due dates of our tasks by months. Here we can quickly overview all the completed or incompleted tasks.
Table Filter and Charts for Confluence works with any table data: all the regular tables, reports, and even the outputs of the third-party macros and apps. You can create a functional and structured system with all the data collected. Add new pages in one click, and new pages are automatically collected in reports. All the reports are dynamic. We use Confluence and Jira in connection to gain more value.
Use third-party tools to enhance and power up these reports to bring more value, see our workload, find the bottlenecks, and move our projects forward.


