Enhance Developer Productivity with the SPACE Framework in Bitbucket

Measuring developer productivity is a challenging task that goes beyond individual skills and the number of lines of code written. It encompasses a wide range of factors, and relying solely on a single metric or activity data cannot accurately reflect it. The SPACE framework was introduced to capture the main factors influencing developer productivity. It recognizes that productivity extends individual performance and metrics and offers five key dimensions for a comprehensive view.
In this article, we’ll cover what the SPACE framework is, explore its five key dimensions, and see how to implement it in Bitbucket.
What is the SPACE framework?
The SPACE framework is a complex approach to a comprehensive understanding of developer productivity. It was presented by a group of researchers from Microsoft, GitHub, and the University of Victoria and acknowledges that productivity extends beyond individual performance and metrics.
This framework helps organizations measure and optimize developers’ productivity by considering five key dimensions:
- Satisfaction and well-being
- Performance
- Activity
- Communication and collaboration
- Efficiency and flow.
All these dimensions should be considered on three levels: Individual, team, and system.

Source: The SPACE of Developer Productivity.
Let’s explore these dimensions in more detail.
SPACE dimensions of developer productivity
Satisfaction and well-being
The level of developer satisfaction refers to how satisfied they feel with their work, team, equipment, and corporate culture. The level of well-being refers to their health, happiness, and work impact. Measuring satisfaction and well-being not only helps understand productivity but can also indicate potential burnout or poor performance. By monitoring these aspects, organizations can take measures like “mental health” days or extra vacation days to prevent burnout and improve overall well-being.
Surveys can often be very helpful in measuring the well-being and satisfaction of your employees.
Examples of metrics:
- Employee satisfaction
- Perception of code reviews
- Satisfaction with engineering systems
Performance
Measuring software developers’ performance is challenging due to the difficulty in directly attributing individual contributions to product outcomes. A high quantity of code does not necessarily mean high-quality code, and neither does customer satisfaction always correlate with positive business outcomes. Therefore, evaluating performance in terms of outcomes rather than outputs is often a better approach. In the most simplistic view, software developer performance could be summarized as “Did the code written by the developer perform as expected?”
Examples of metrics:
- Code review velocity
- Story points shipped
- Reliability
- Feature usage
- Customer satisfaction
Activity
Activity, measured as the count of actions or outputs, gives useful but limited insights into productivity, engineering systems, and team performance. However, developers engage in a wide range of complex and diverse activities that are difficult to measure comprehensively. While activity metrics can provide some understanding, they should always be combined with other dimensions to assess developer productivity. These metrics serve as starting points and must be customized according to organizational needs and development processes.
Example of metrics:
- Number of code reviews completed
- Coding time
- # commits or lines of code
- Frequency of deployments
Communication and collaboration
Effective communication and collaboration are vital for successful project development. Collaboration within and between teams, supported by high transparency and awareness of team member activities, dramatically impacts productivity. Informed teams tend to be more effective as they work on the right problems, generate innovative ideas, and make better decisions.
Example of metrics:
- PR merge times
- Quality of code reviews
- Knowledge sharing
- Onboarding time
Efficiency and flow
Efficiency and flow refer to how quickly progress can be made with minimal interruptions or delays. Individual efficiency is achieved by setting boundaries, reducing distractions, and optimizing software development flow. Team and system efficiency embodies the process of transforming software concepts into product deliveries while eliminating any delays or handoffs in this flow. Team flow can be monitored using DORA metrics such as deployment frequency or lead time for changes.
Example of metrics:
- Code review timing
- Lack of interruptions
- Number of handoffs
- Lead time for changes
How to use the SPACE metrics
Here are the best practices on how effectively implement the SPACE framework:
- Choose multiple metrics. To obtain a holistic view of developer productivity, it is important to include several metrics from multiple dimensions. The recommended number of dimensions is at least three. For example, if you track an activity metric, add metrics from other dimensions, perhaps performance and efficiency & flow. Avoid focusing on a single aspect and consider the broader impact on the entire system.
- Add perceptual measures. Include survey data to gain a comprehensive understanding of developers’ productivity. Perceptions provide valuable insights that cannot be obtained solely from system behavior.
- Avoid excessive metrics. Capturing too many metrics can lead to confusion and decreased motivation. Select a few metrics to maintain focus and set achievable improvement goals.
- Set important metrics. Choose metrics that align with organizational values and goals as they affect decision-making and individual behavior and indicate what is important.
- Protect privacy. When reporting metrics, respect developer privacy and share only anonymized and aggregated results. However, individual productivity analysis may be useful for developers, as it will assist them in optimizing their work and identifying inefficiencies.
- Consider norms and biases. Take into account that no metric is perfect, and some may have limitations or biases like cultural aspects or parental leave for metrics counted over a year. Consider these factors and the broader context when interpreting chosen metrics.
How to Implement the SPACE Framework in Bitbucket
Implementing the SPACE framework in Bitbucket can be facilitated using Awesome Graphs for Bitbucket. It is an on-prem solution that transforms invisible engineering activities into actionable insights and reports empowering managers and their teams to gain a deeper understanding of the development process and drive continuous improvement.
Awesome Graphs seamlessly integrates into Bitbucket and provides the following capabilities:
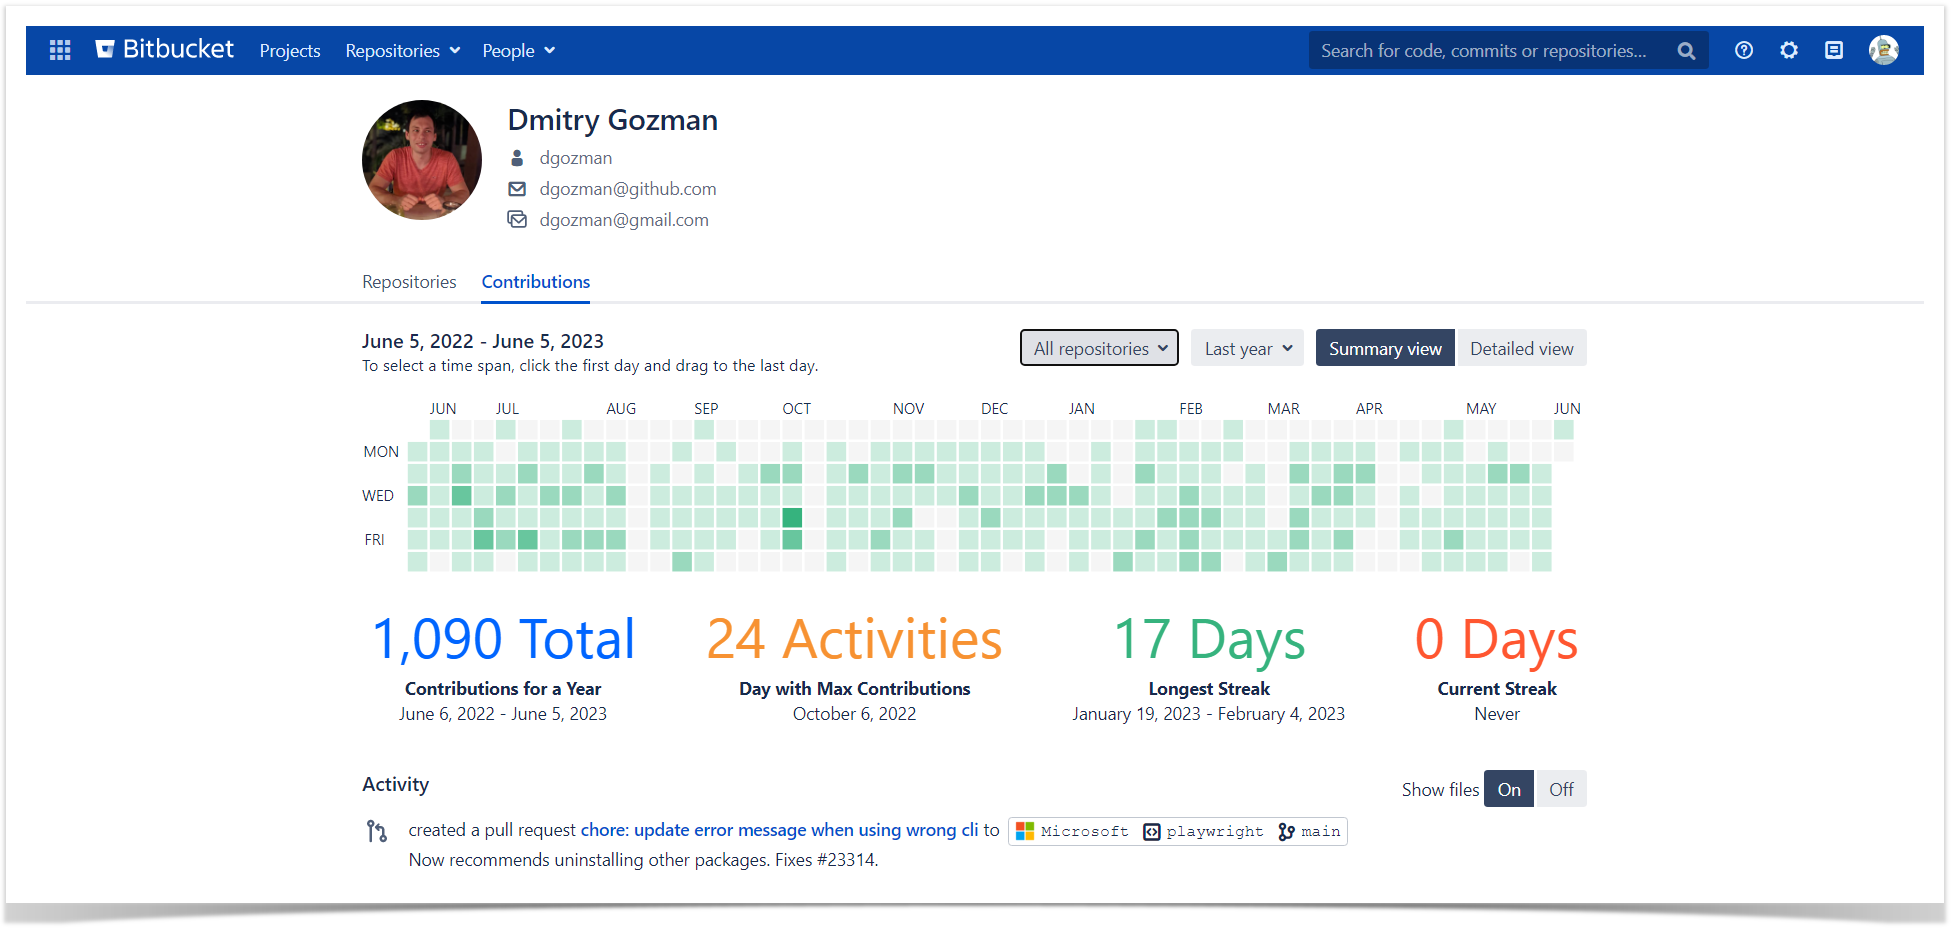
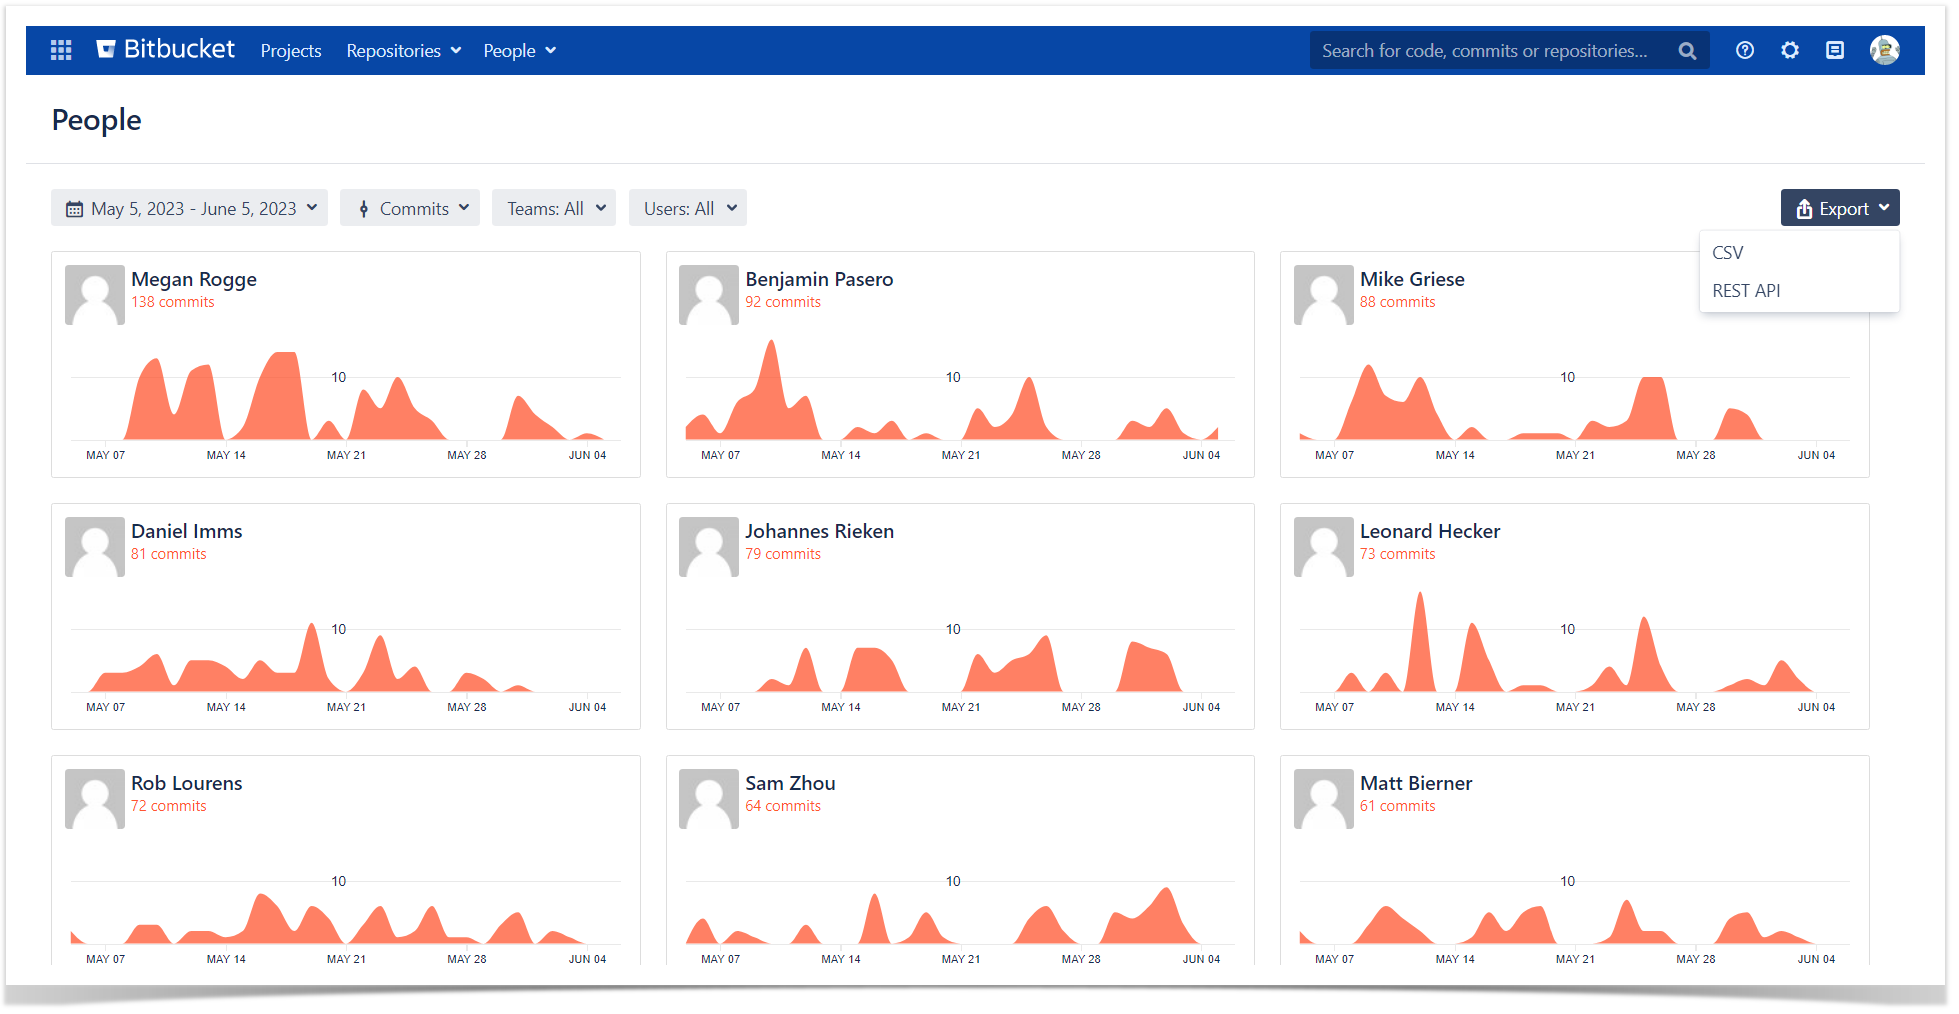
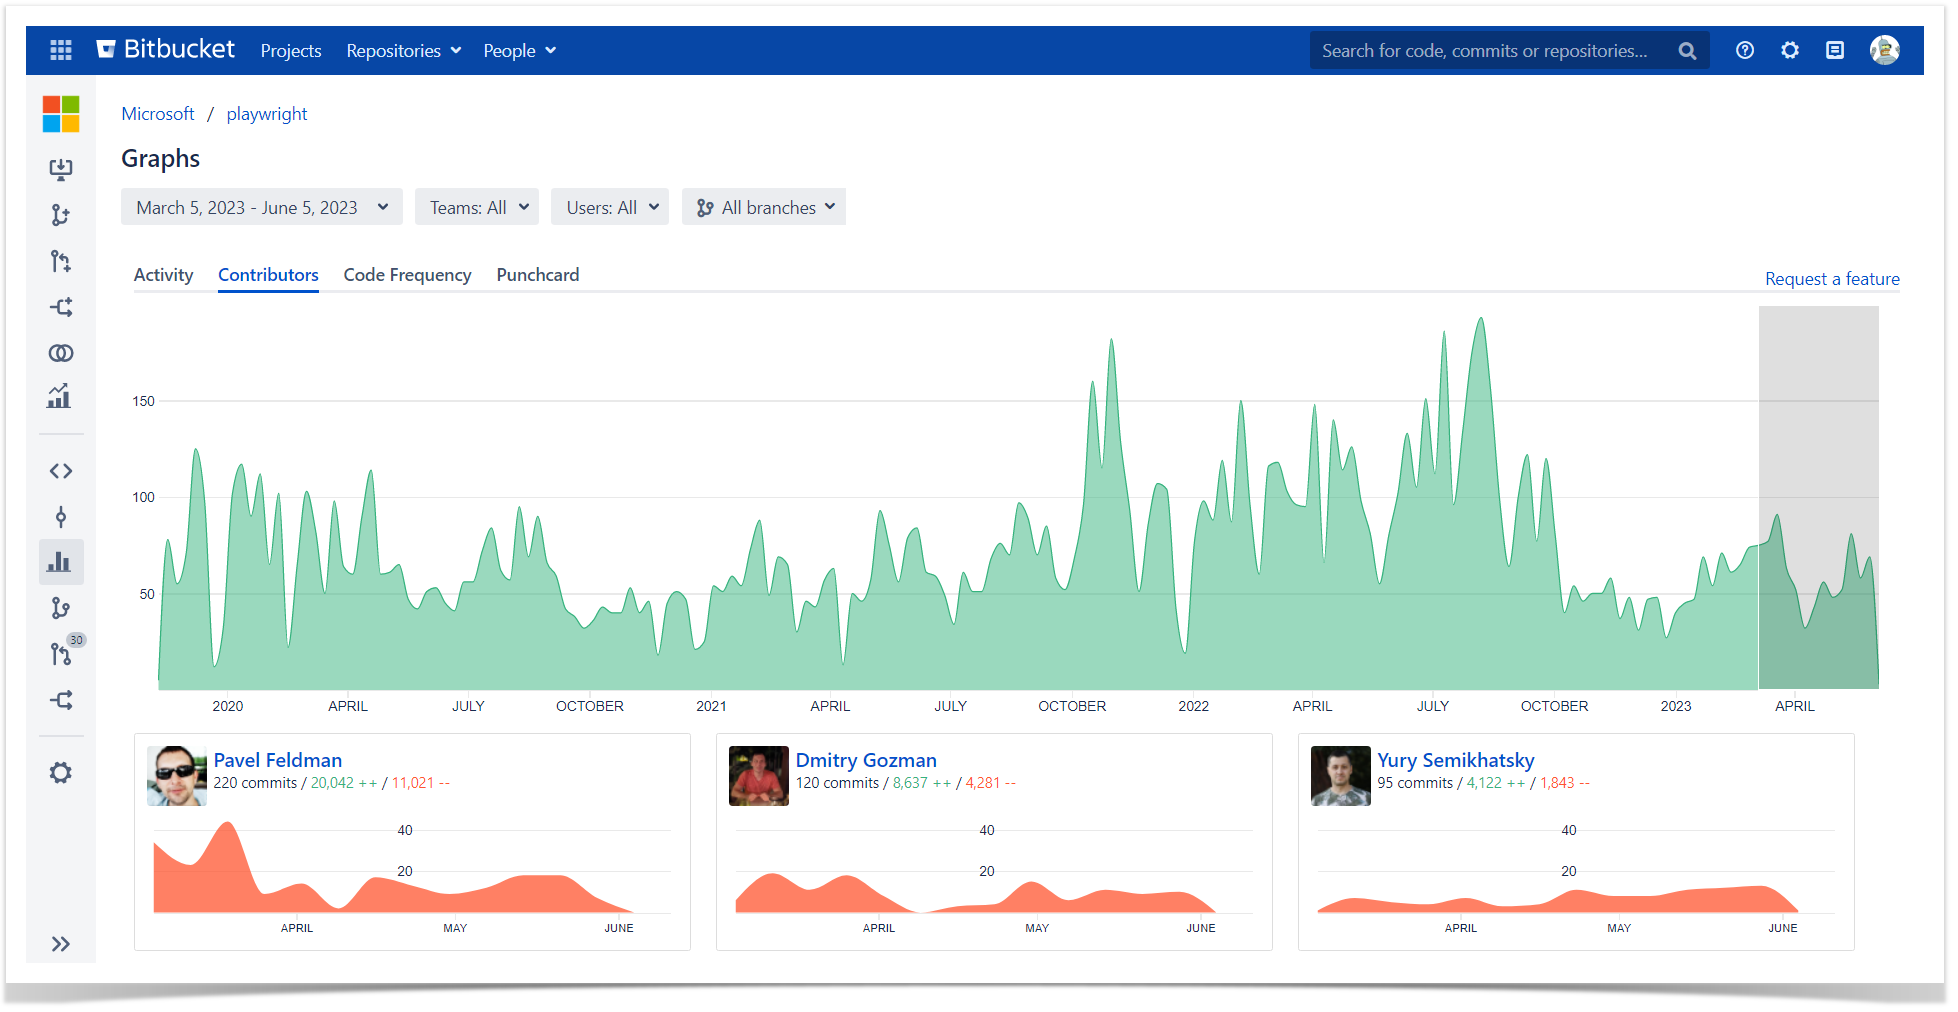
- Tracking commits, pull requests, and lines of code. You can monitor the number of commits or pull requests on the instance, team, or user levels, analyze and compare progress to past sprints or quarters, and see the engineering contribution for each repo and project. Thus, you can easily track, for instance, activity metrics from the SPACE framework, such as commits or lines of code.
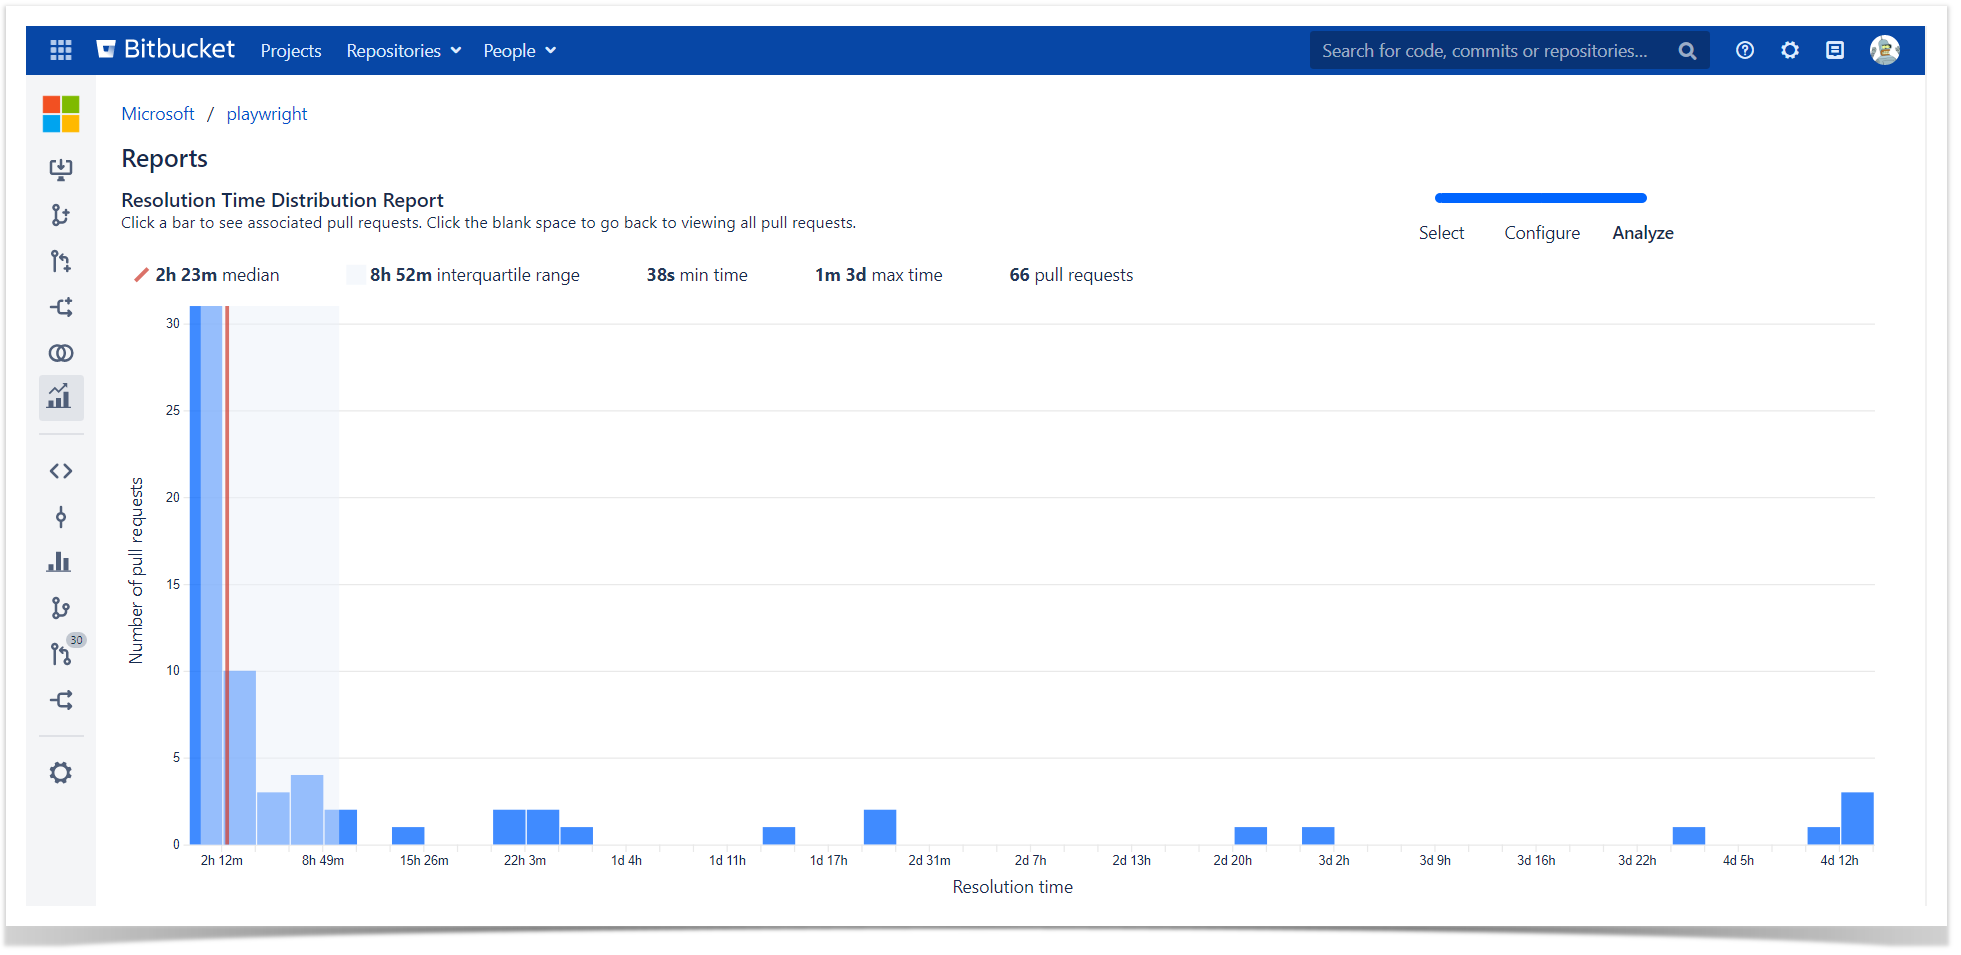
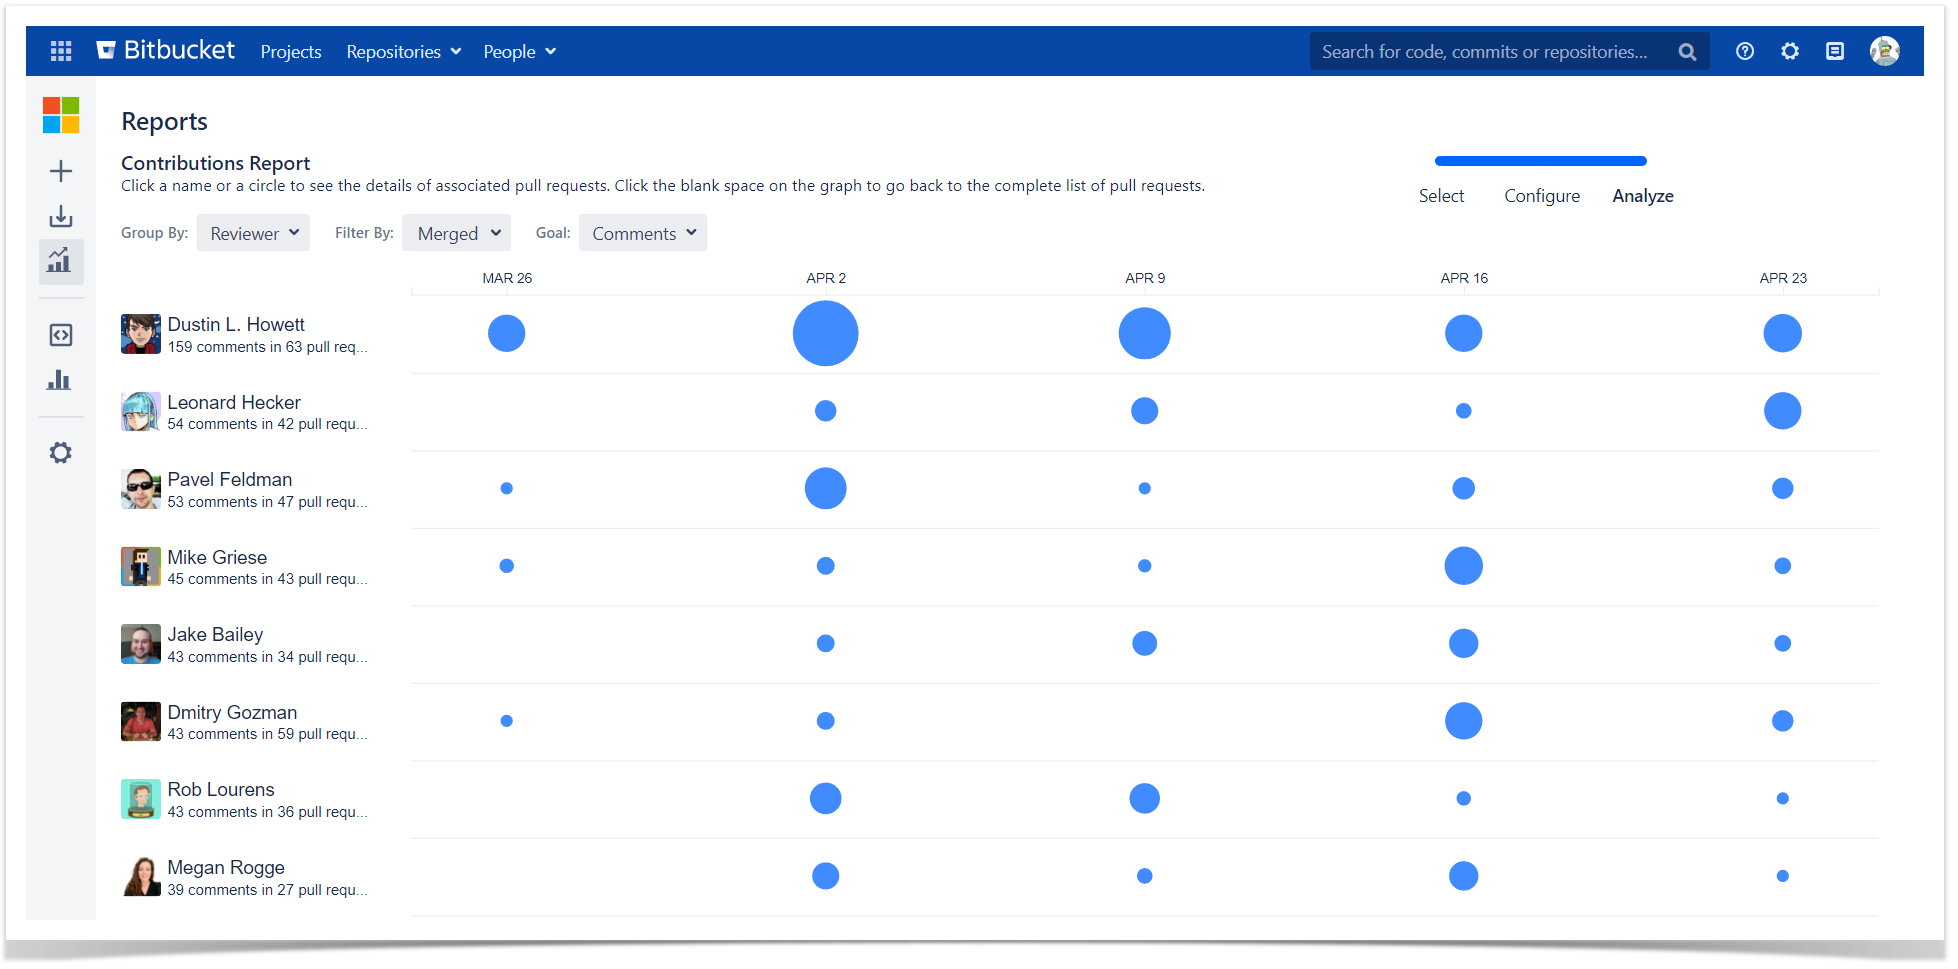
- Analyzing code review process. Awesome Graphs shows how the code review process is going. You can analyze PR merge times, see the quality of code reviews, find the most active reviewers, and identify areas for improvement. It helps in monitoring performance as well as communication and collaboration metrics.
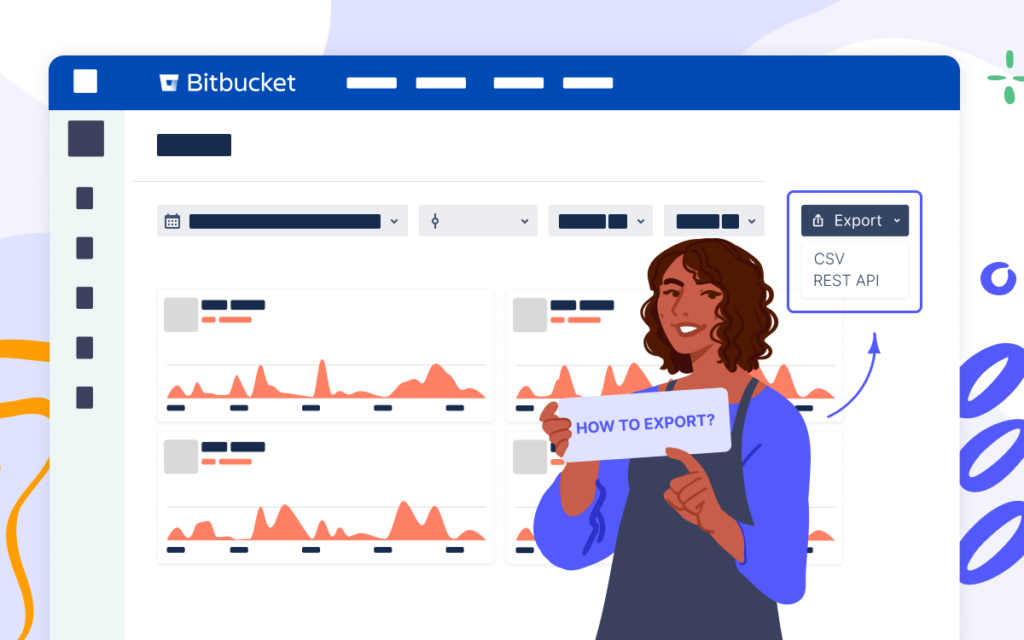
- Exporting data to a CSV file or via REST API. You can retrieve raw data about commits, lines of code, or pull requests at different levels and blend it with information from other applications to gain deeper insights. This feature allows you to build custom reports and track metrics aligned with your organization’s values and goals.
The SPACE framework offers a holistic approach to tracking the development process, empowering engineering managers and their teams with valuable insights into developer productivity. Awesome Graphs opens up opportunities to effortlessly implement this framework in your Bitbucket and effectively measure and improve teams’ productivity.
Start your free trial and reach a new level of visibility and efficiency in your development process and productivity.