How to Make Charts and Graphs in Confluence

Visualizing data can significantly enhance how your audience understands information. If you use Confluence as a central source of truth, charts will become real helpers. Whether managing project timelines, analyzing sales figures, or monitoring team performance, adding Confluence charts and graphs to your pages can turn them into dynamic, interactive dashboards. In this blog post, we’ll explore four ways to create graphs in Confluence and their pros and cons to help you choose what suits you best.
Option 1 → Use Native Confluence Charts
Confluence provides built-in tools to create charts. To start, you need to create a table and then insert the chart with a few clicks. You can:
- Select from bar, line, or pie chart types.
- Customize settings, like choosing columns to display and adjusting style, title, or legend.
Pie chart in Confluence

✅Pros:
- Easy to set up
- Comes for free as a part of Confluence Cloud
⛔Cons:
- Limited to three chart types.
- Need to work outside Confluence to prep your chart data. Suppose you have raw data and must aggregate, summarize, calculate, or filter it before making charts. In that case, you might find yourself exporting it to Excel, preparing it, then crafting a final table in Confluence just for the chart. It can be a real pain, with all the manual double work – copying, pasting, and jumping between different tools. If you want to avoid this hassle or use charts for an automated dashboard in Confluence, consider exploring the following option.
Option 2 → Create Advanced Confluence Charts with the Chart from Table Macro
The Chart from Table Macro is one of the 12 macros from the Table Filter, Charts & Spreadsheets for Confluence.
The app is the most complete solution for working with table data in Confluence, with 3 million active users and hundreds of reviews. You can filter, pivot, chart, merge data, and much more.
Its powerful data processing features allow you to create charts and graphs tailored to your goals. These aren’t just decorative charts to make the Confluence page look better; they can be part of a specific automated report or answer your boss’s question.

✅Pros
- 15 chart types, including Gantt.
- Extensive options to prepare data for charts directly in Confluence, eliminating the need
. We will name just a few:
-
-
- Filter your table to show something specific in your chart.
- Create a pivot table from the raw table and then create a chart view for your audience.
- Merge data from different Confluence pages and create a chart from the combined data later.
- Calculate metrics in Excel-like spreadsheets within Confluence and create a chart from the combined data.
-
-
- Multiple data sources for charts. This basically means that you don’t need to leave Confluence when it comes to table data. You can also make it a place for reports. Charts can be created not only from Confluence tables, but from:
-
-
- a macro like Jira Issues, Content/Task Report, or Page Properties Report
- a CSV file, static or via URL
- a JSON file, exported or generated by an API call.
-
-
⛔Cons
- Comes with additional costs. Pricing depends on your team size.
Graph samples with the Chart from Table Macro
You can use the Chart from Table Macro to create the following chart types:
- Gantt chart
- Pie and Donut chart
- Bubble Pie chart
- Column, Stacked Column, Bar, Stacked Bar chart
- Line, Area, Stacked Area chart
- Time Line, Time Area, Stacked Time – Area chart
- Radar (Spider) chart
- Contiguity / Barcode chart
- Scatter plot
- Punchcard
For example, let’s create a pie chart showing the distribution of tickets by status for Q2. Then, we’ll create a stacked bar chart to see how this distribution changes across quarters:

Or create a stacked bar chart to see the metrics by agent in Q2:

Or build a Gantt chart to track the workflow of a project:

You can instantly modify the chart settings while viewing the page by using the settings panel on the side. If you need to change the source table, the chart will update automatically. After you finish setting up the chart, you can download it as a picture, or export it into a PDF or a Word file.

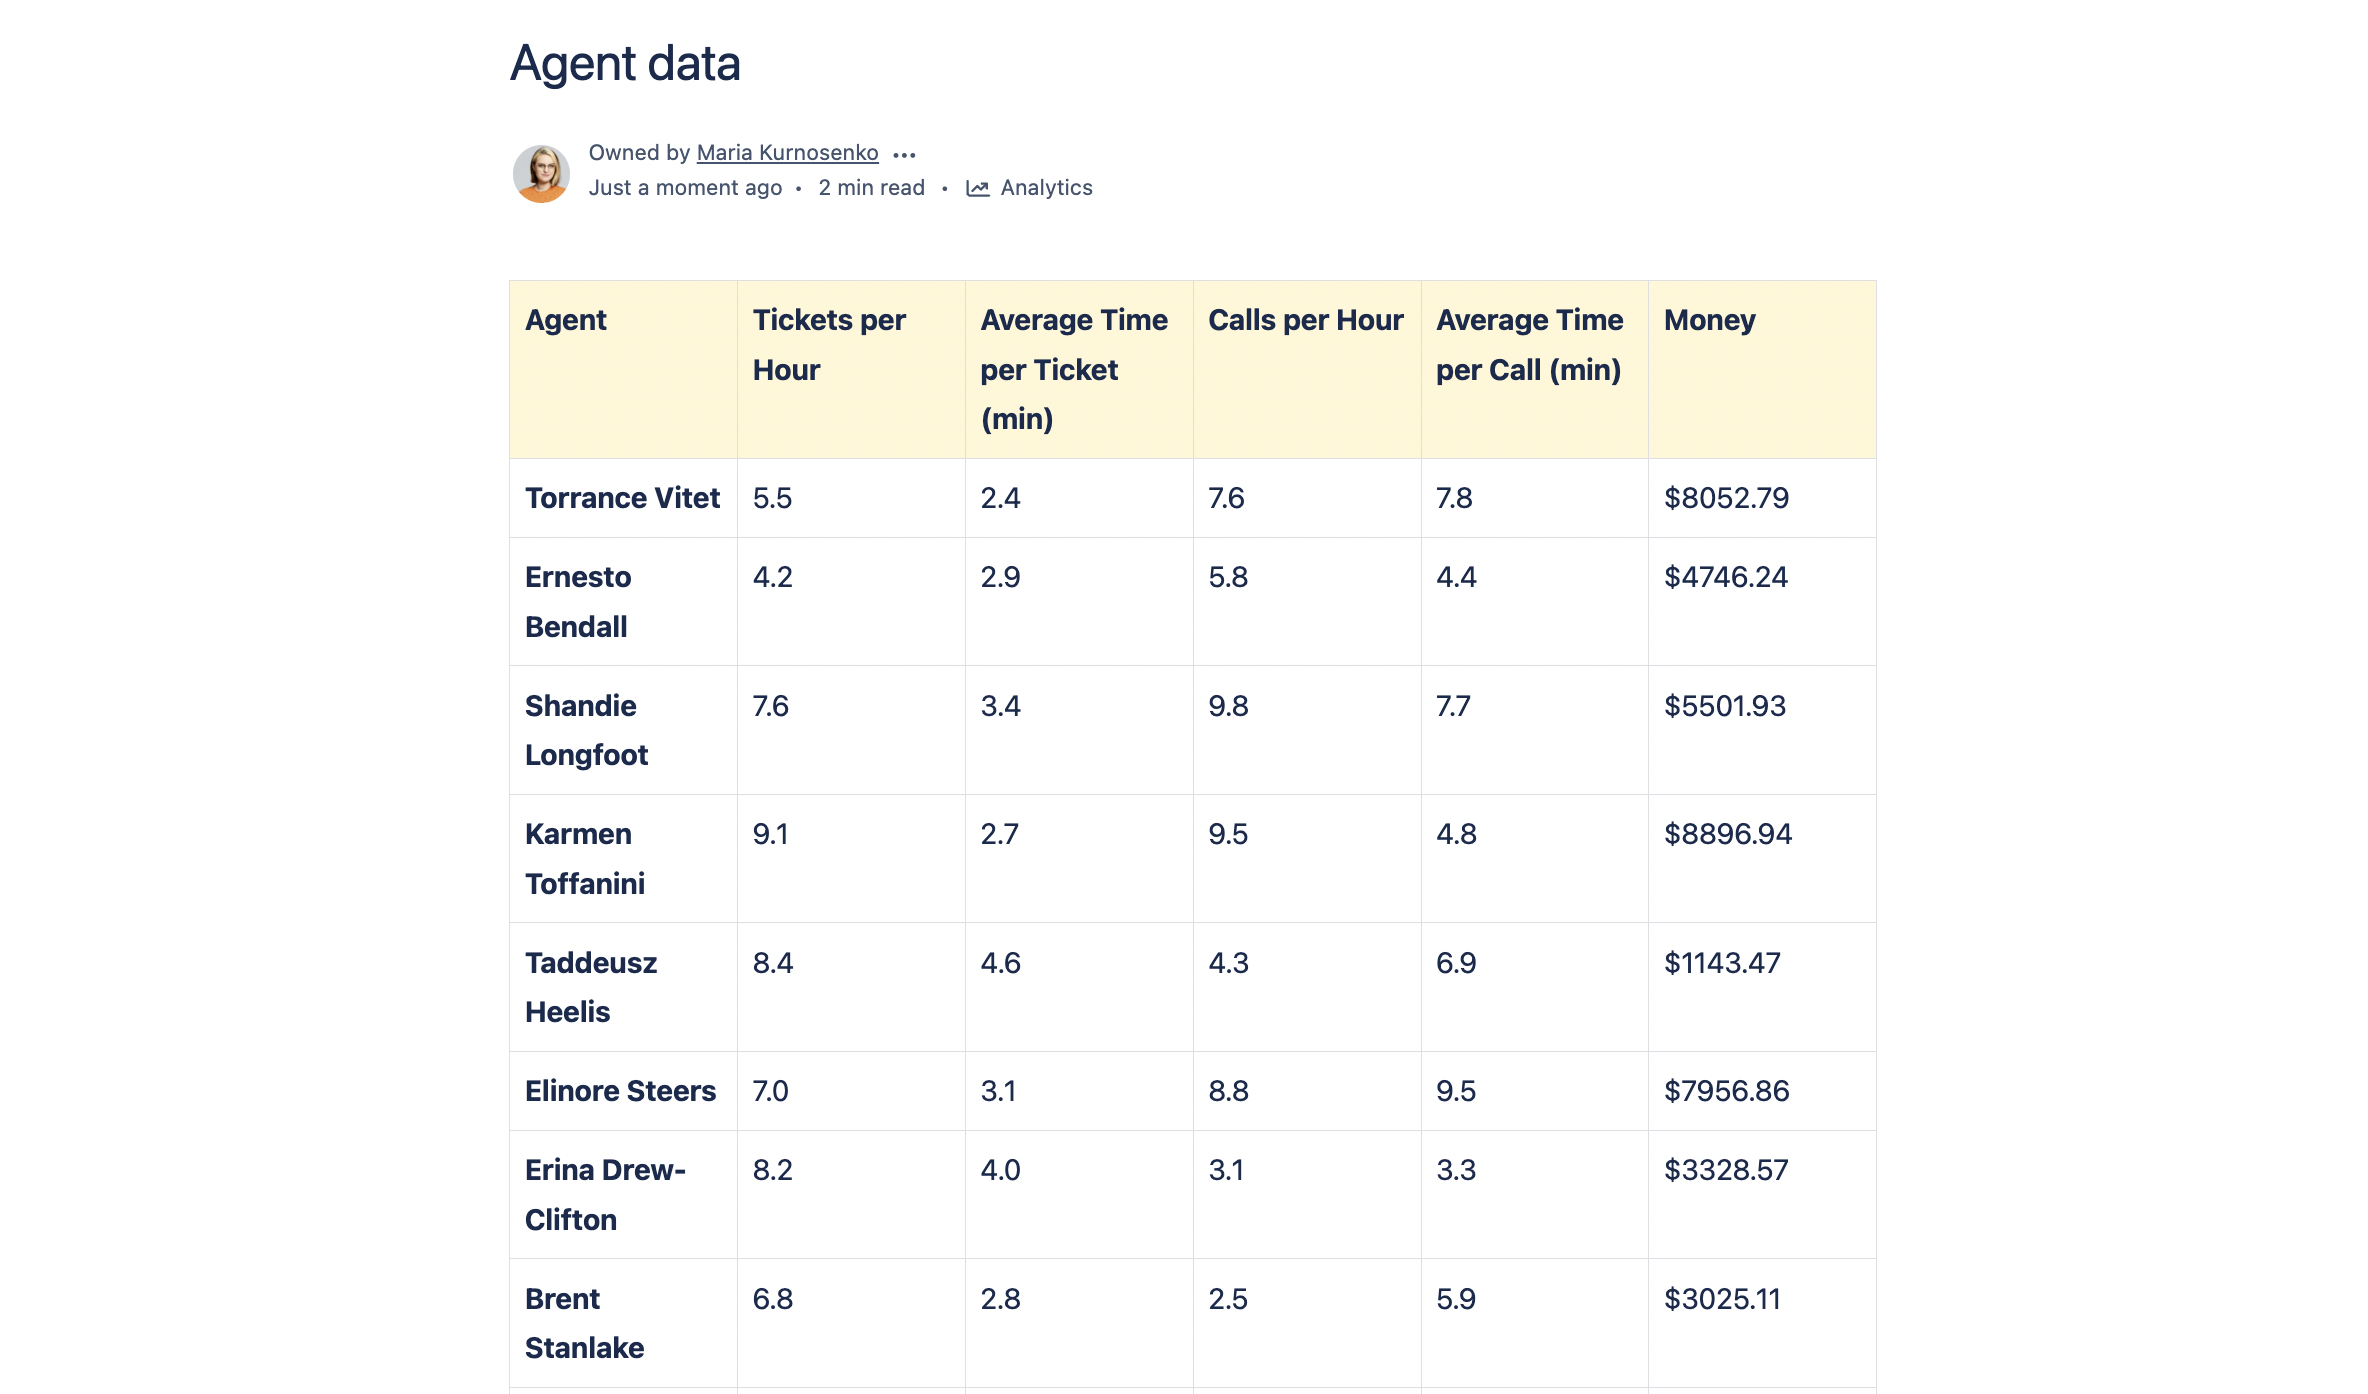
Preparing data for charts in Confluence
Let’s see how you can use the other macros from the Table Filter, Charts & Spreadsheets bundle to improve your charting.
The Table Filter macro allows you to filter any table right in the page view or edit modes. The table will be immediately redrawn depending on the specified filter values. The rich set of filters helps you easily handle multi-format data turning large and complex tables into smaller, simpler ones.

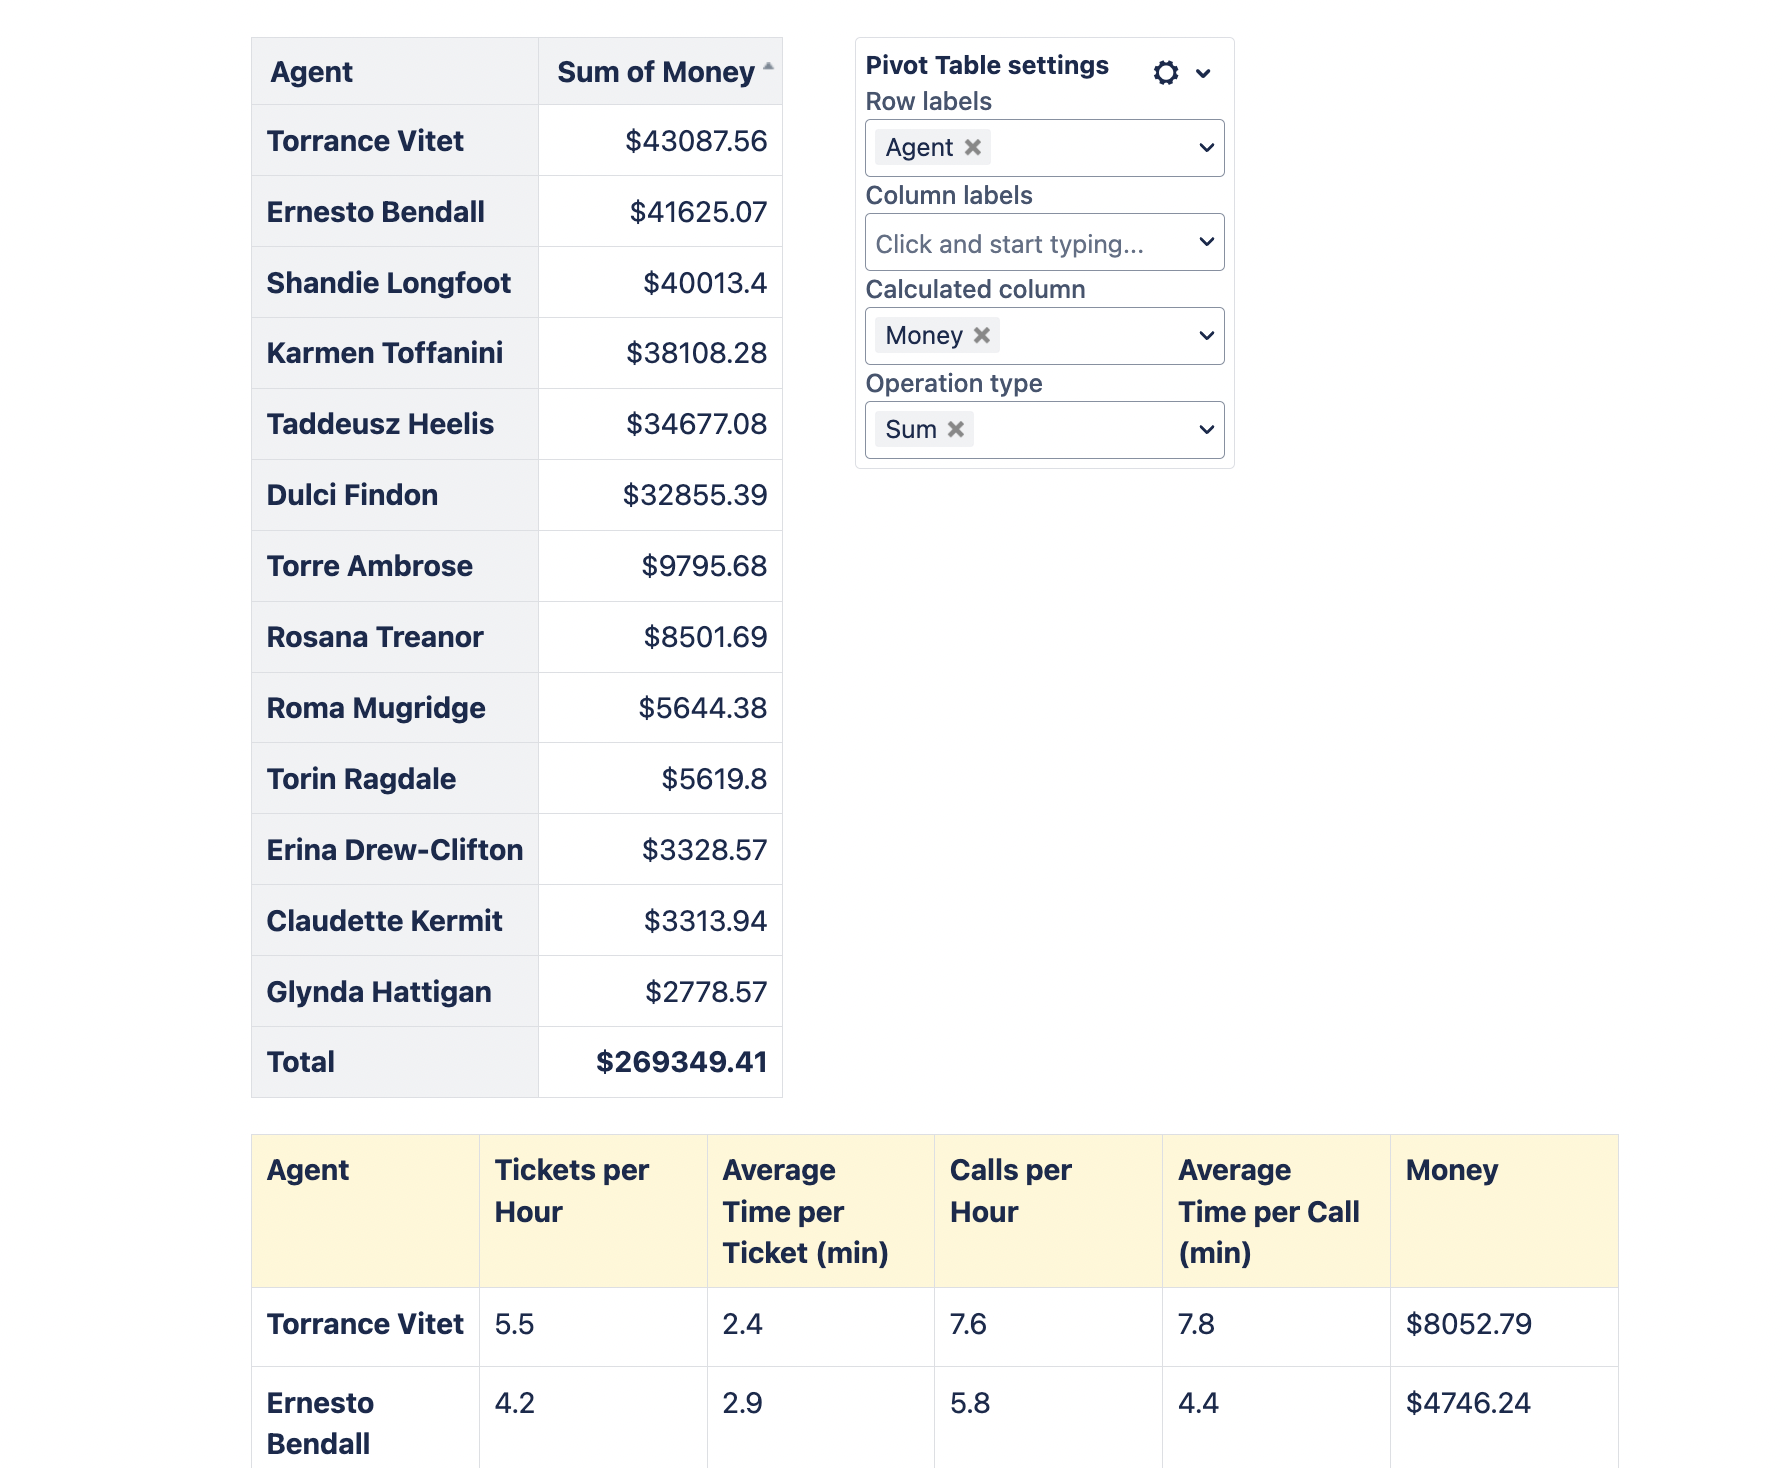
With the Pivot Table macro, you can aggregate data from bigger tables with repeated values. Pivot tables help you simplify the information in a table before turning it into a chart.
You may combine all these three macros from the Table Filter, Charts & Spreadsheets app into a single data processing mechanism using the Table Toolbox macro (in Cloud). In such a way, you can even draw graphs from the filtered pivot table. And, of course, if you make some changes in filtration or graphs settings, the dashboard will be automatically updated according to your changes.

Alternatively, you can process your table data as a spreadsheet by wrapping a table into the Spreadsheet from Table macro. It will transform the table into a spreadsheet which you can process similarly to Excel or Google Sheets further on. It also has various visualization capabilities, so if you prefer working with spreadsheets while analyzing data through charts and graphs, it can be done too.

Option 3 → Visualize Jira Data with Built-in Confluence Graphs
Of course, Atlassian supplies you with the out-of-the-box Jira integration in Confluence. If you use Confluence Server or Data Center, you need to set up an application link to your Jira instance. In Confluence Cloud, you can simply paste a URL to Jira into the page, and it will convert into the Jira Issues macro. Then you’ll be able to receive and handle your Jira data. You can visualize it with the Jira Chart macro. Three types of charts are available:
- Pie Chart from Jira
- Created vs. Resolved Chart from Jira
- Two Dimensional Chart
The pros and cons are the same as those in native Confluence charts.
✅Pros:
- Comes for free as a part of Confluence
⛔Cons:
- Limited to three chart types.
- No ability to customize settings.
- Limited flexibility to manipulate raw Jira issues to show something specific on a chart. Yes, you still can create charts from Jira and even apply filters. However, if you want to gain deeper insights from the data by summarizing, grouping, or calculating it first and then showing it as a chart —something that people often do working with table data—you will likely need to find an alternative workaround.
Here’s an example showing a created vs. resolved issues chart alongside a pie chart of issues by status.

Option 4 → Build Flexible Jira Dashboards in Confluence
As previously described, the Table Filter, Charts & Spreadsheets for Confluence work not only with native Confluence tables but with data from Jira as one of the sources. Before making a chart, you can process the incoming Jira data – filter, pivot, merge data from different tables, or calculate additional metrics. After that, create a chart to show your findings or results and integrate it into a dashboard. And the best part is that you will not leave Confluence doing it.
Here is an example of a dashboard built in Confluence on Jira data with:
- The Jira Issue Macro with the ability to sort and filter a table directly on the page.
- Stacked column and pie charts to visualize the team’s time allocation between new features and improvements.
- A bar chart shows the estimated and actual time spent on tasks by the assignee.

✅Pros:
- Ability to make a chart a part of a dashboard to find real insights or demonstrate your impact, rather than just a decorative chart to enhance the visual appeal of your page.
⛔Cons:
- Comes with additional costs. Pricing depends on your team size.
Final Word
In short, you have four different ways to create charts and graphs in Confluence, and the right choice depends on your goals.
-
If you need a basic visualization of raw data or just a one-time chart, the native Confluence charts or the Jira Chart Macro are a great starting point.
-
If you want to process data more flexibly or build an automated dashboard with charts in Confluence, the Table Filter, Charts & Spreadsheets app will serve you better.
Interested in trying the Table Filter, Charts & Spreadsheets for Confluence?
![]()