Revolutionize Employee Performance Evaluation in Jira and Confluence

Measuring employee performance demands more than traditional quarterly reviews and subjective feedback in today’s rapidly digitalizing work environment. Companies are turning to integrated, data-driven solutions to objectively track performance, boost productivity, and drive continuous improvement. By harnessing the power of Jira and Confluence, along with specialized apps like Smart Attachments for Jira, Table Filter, Charts & Spreadsheets for Confluence, and izi – LMS for Confluence, you can create a seamless performance management ecosystem that supports both real-time analytics and ongoing employee development.
The Digital Shift in Employee Performance Evaluation
The transformation to remote work and digital collaboration has reshaped how companies monitor team performance. With in-person interactions limited, managers face challenges in capturing real-time, objective insights into employee contributions. Traditional review methods—often dependent on sporadic meetings and anecdotal evidence—can miss the nuances of day-to-day work. Now, a robust digital strategy is essential:
- Continuous Feedback: Real-time data capture at key workflow stages helps eliminate the bias of retrospective evaluations.
- Data-Driven Insights: Automated metrics provide clear trends, helping managers pinpoint strengths and areas for improvement.
- Integrated Systems: Leveraging the power of Jira and Confluence ensures that performance metrics are not siloed but become part of everyday operations.
Optimizing Employee Performance Analytics in Jira
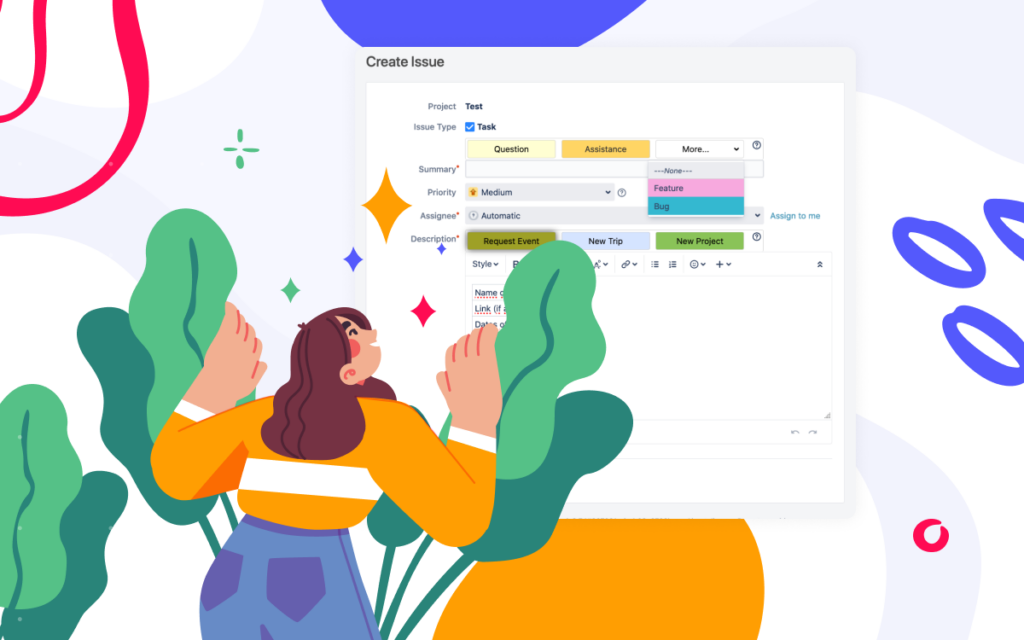
Jira has long been the go-to platform for task tracking and project management. Its flexibility makes it an ideal hub for gathering employee performance data. As tasks are completed and closed, performance metrics—such as delivery speed, work quality, and process adherence—can be automatically captured within your existing workflows.
The Smart Attachments for Jira app elevates employee performance tracking by streamlining attachment management. It helps you link relevant documents, work samples, feedback forms, and project artifacts to corresponding Jira issues. This ensures that every performance record is enriched with contextual evidence, making it easier for managers to review contributions and make informed decisions.

Key benefits include:
- Automated Documentation: No more manual uploads—relevant files are linked to each task.
- Enhanced Visibility: Managers can quickly access supporting documents, facilitating objective performance analysis.
- Seamless Integration: The Smart Attachments app works directly within Jira, complementing existing workflows without added complexity.
Visualizing Employee Performance Data in Confluence
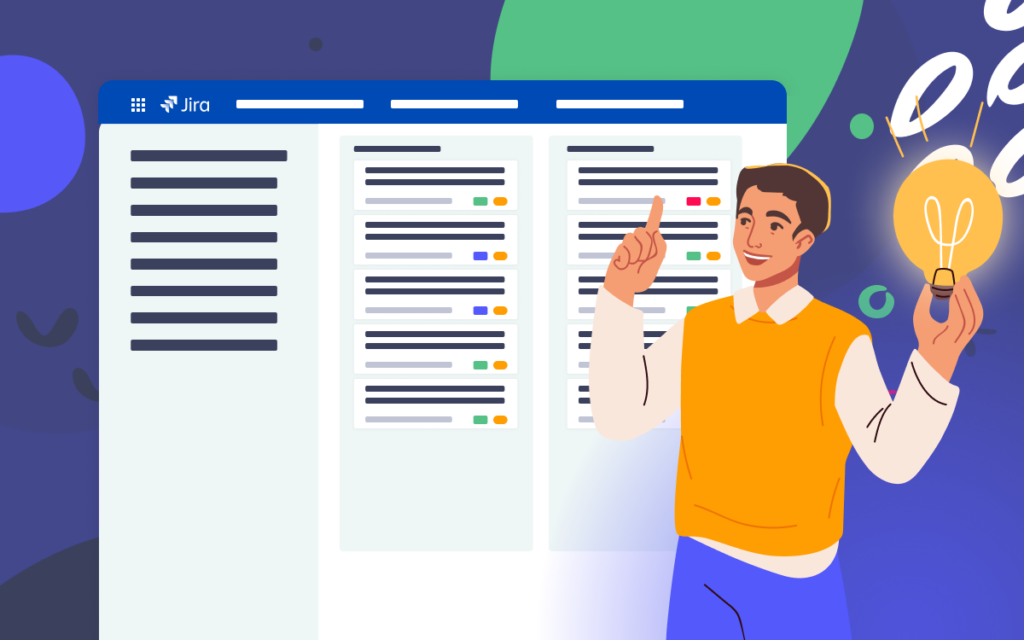
Raw data is only as valuable as your ability to interpret it. Once your employee performance data is captured in any form, exporting it to Confluence allows for dynamic visualization and deeper analysis. The Table Filter, Charts & Spreadsheets for Confluence app is designed to transform CSV data into interactive dashboards, pivot tables, and charts that track performance over time.
How It Works:
- Data Export: Save your performance metrics as a CSV file.
- Confluence Integration: Attach the CSV file to a Confluence page and use the CSV macro to display the data in a table.

- Dynamic Visualization: Enclose the table within the Table Filter and Charts macro to:
- Create pivot tables that group data by sprint, assignee, or issue type.
- Generate charts that illustrate trends in delivery speed, code quality, and efficiency.
- Enable trendlines to visually track performance improvements or identify setbacks.

Benefits:
- Immediate Insights: Instantly identify trends across multiple sprints or projects.
- Custom Reports: Tailor visualizations to highlight specific employee performance metrics.
- Actionable Data: Use insights to inform targeted training and process improvements.
Upskilling Teams with izi – LMS for Confluence
Objective performance analytics are only one side of the coin. To ensure continuous improvement, companies must invest in employee performance and development. The izi – LMS for Confluence app transforms your familiar Confluence workspace into a full-featured learning management system.
What izi – LMS Offers:
- Course Creation: Build interactive courses, quizzes, and tests directly within Confluence.

- Seamless Integration: Utilize existing Confluence pages and content to create engaging training materials.

- Progress Tracking: Monitor employee progress with detailed reports, ensuring that training efforts are aligned with performance gaps.


By merging training with performance data, managers can tailor educational programs to address specific skill deficiencies and promote career development, ensuring that every team member has the resources needed to excel.
Integrating Tools for Employee Performance Management System
A comprehensive performance management system is built on the synergy between data capture, visualization, and continuous learning. By integrating Jira and Confluence with the right apps, companies can:
- Streamline Performance Reviews: Capture real-time data in Jira and enrich it with contextual documents using Smart Attachments for Jira.
- Visualize and Analyze Trends: Leverage Table Filter, Charts & Spreadsheets for Confluence to create dynamic, customizable dashboards.
- Enhance Employee Development: Utilize izi – LMS for Confluence to provide targeted training based on data-driven insights.
This holistic approach improves the objectivity and efficiency of performance evaluations and fosters an environment of continuous learning and growth—vital for staying competitive in today’s fast-paced business landscape.
Conclusion
Incorporating digital tools into your employee performance evaluation process is no longer optional—it’s a strategic imperative. By harnessing the power of Jira and Confluence along with apps like Smart Attachments for Jira, Table Filter, Charts & Spreadsheets for Confluence, and izi – LMS for Confluence, your organization can achieve a more objective, transparent, and effective performance management system.
Empower your managers with real-time insights, streamline the feedback process, and invest in your team’s growth to drive overall success. Start transforming your employee performance evaluations today and unlock the full potential of your digital workplace.
Discover how these innovative tools can revolutionize your performance review process and propel your organization to new heights.