Employee Performance Assessment and Training in Jira and Confluence

April 13, 2021
#Reporting#How To#Learning Management
12 min

The year 2020 has brought many new challenges that humankind did not expect. It has reshaped our vision and approaches towards life, communication, and, of course, work. We encountered problems that were unnoticeable when we were able to communicate with each other directly.

More and more companies have proceeded to robust digitalization of their businesses. Unfortunately, all these transformations were performed so fast that not all people could quickly get used to these abrupt changes. After a while, teams noticed that their internal communication and team collaboration were not so efficient as before. The management teams got another problem with making the companies work when there is no peer-to-peer communication, and all the processes must run remotely.

Companies have understood that they need to invest more into performance analytics, employee education, and training programs. Only these things can help them adjust their businesses to the changed circumstances and succeed in the new reality.

Shaping the problem is half the solution

Identifying the problem is a key to its solving. In most cases, we collect feedback about the work of our employees every quarter, which makes it almost impossible to track all the occurred issues and positive achievements. It is hard to recall all the good and bad moments that happened over a quarter. Some of our memories are polished, some are completely forgotten, some are replaced with our own hallucinations. As the result, we get some averaged assessments (or points of view) that may be far from reality.

How can we make the gathering of feedback on individual performance an ongoing process? So all the time we can track the actual information with minimal bias.

Realtime feedback collection in Jira Cloud

What is the most convenient moment to collect feedback about the completed task? Of course, once the task was checked and closed by a person who requested its execution. Here you can take advantage of the Employee Performance Ratings app.

For example, we have a development team that has started working remotely, and something has gone off course (smile) They cannot deliver within the expected timelines, and the quality of the implemented solution is not so good.  As a project manager, you need to identify the problems that do not allow your team to perform better. You can do this by identifying the metrics that can explicitly indicate whether your team performs well or has some issues to address.

Identifying the metrics that indicate team performance

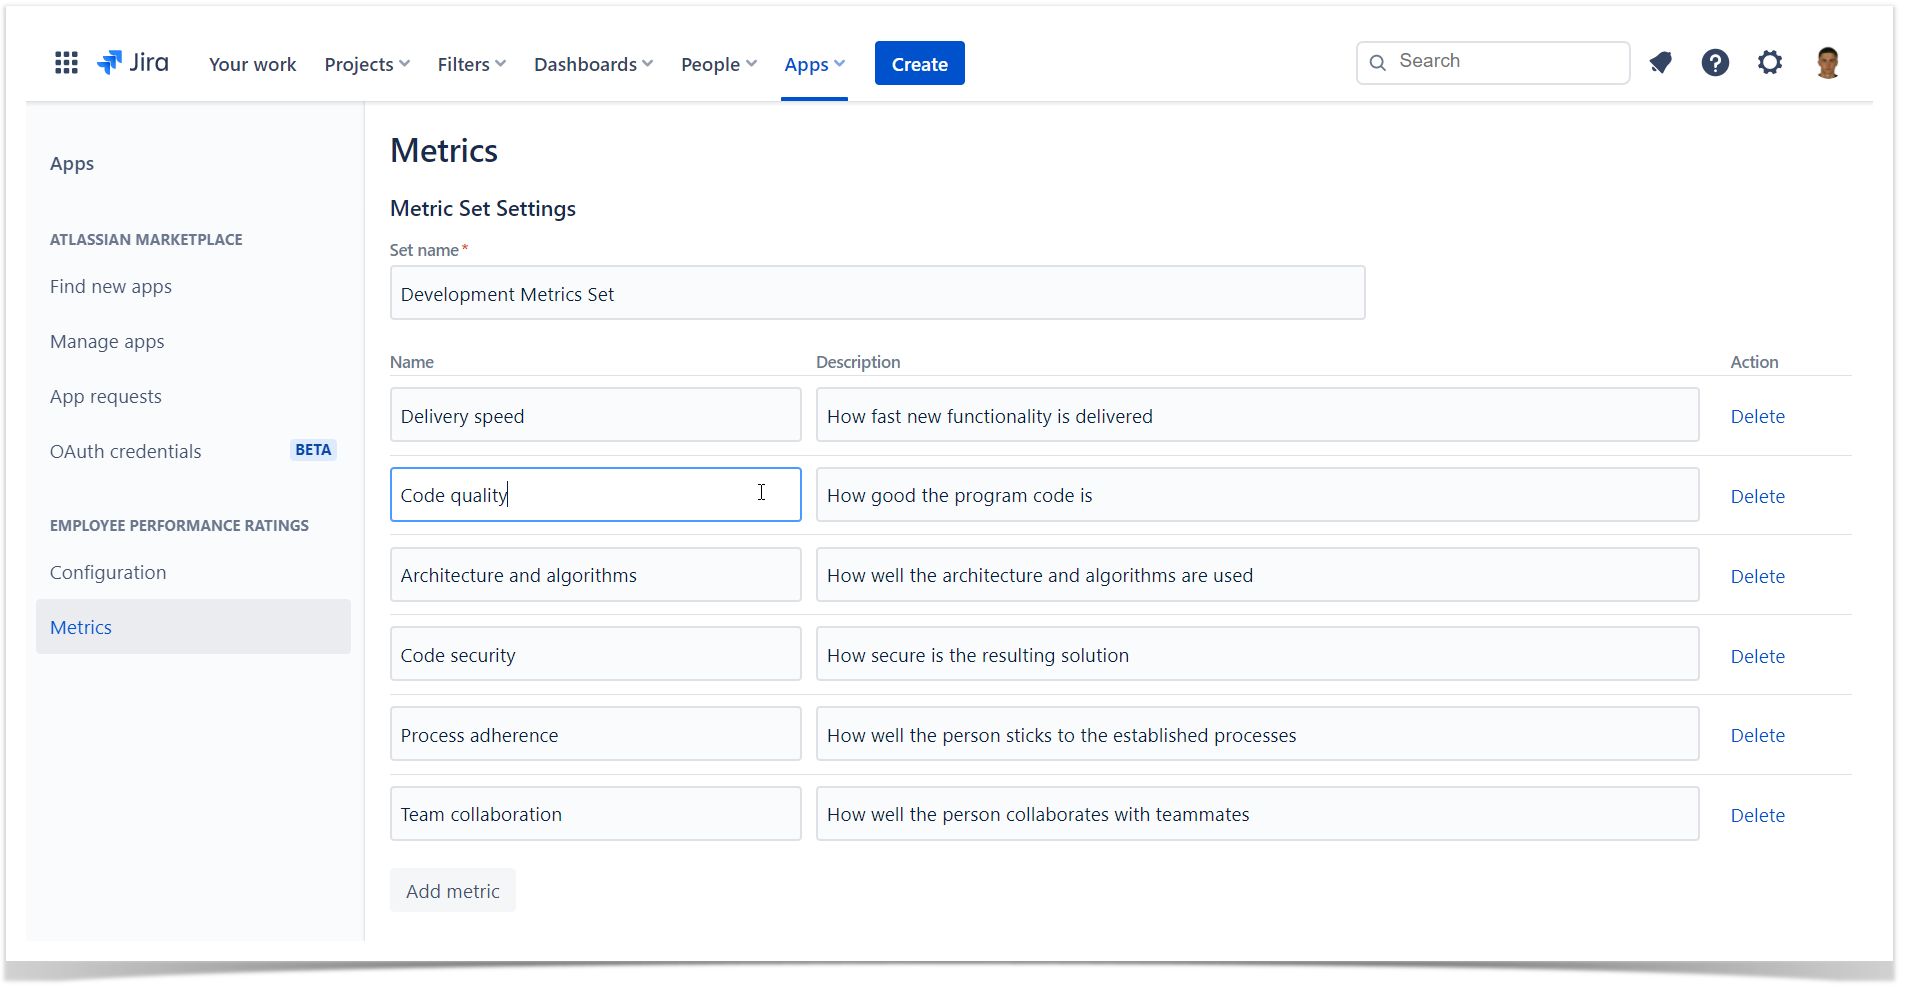
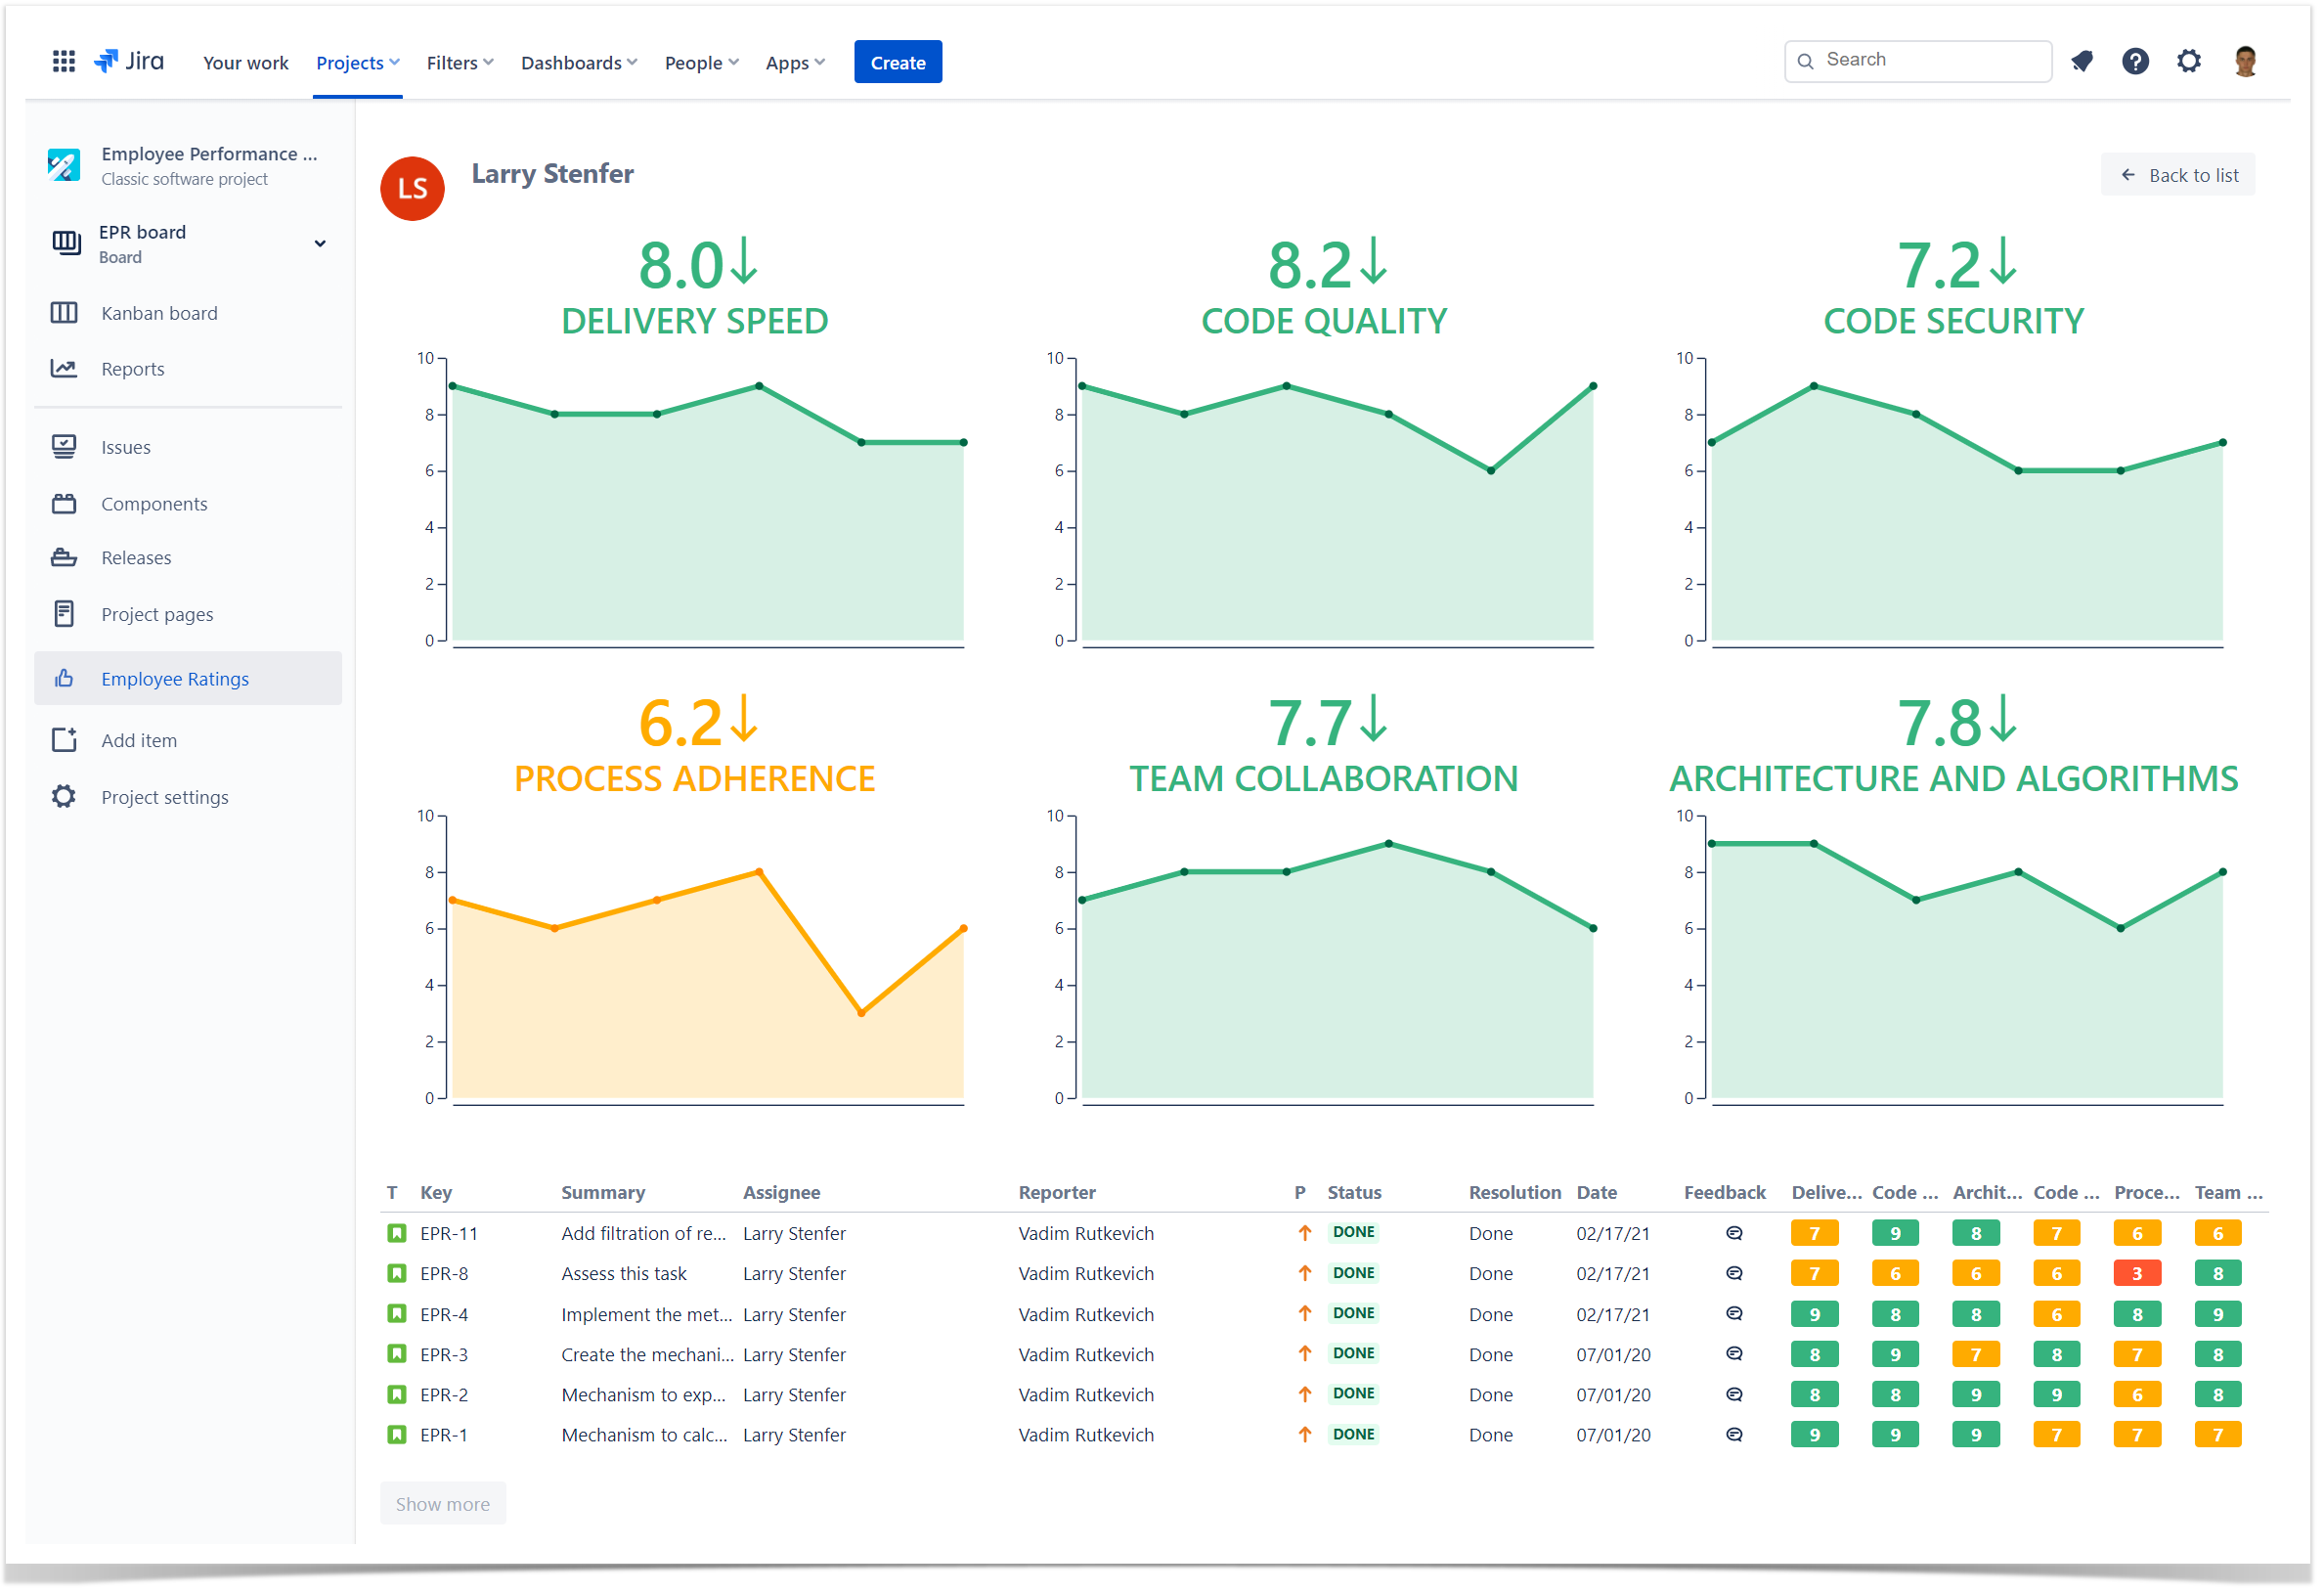
Once this step is complete, all you need to do is create these metrics and enable their tracking for the project. Let’s say we want to track delivery speed, code quality, architecture and algorithms, code security, process adherence, and team collaboration. We save them as a metrics set and assign them to the project which our development team works with.

Tracking delivery speed, code quality, architecture and algorithms, code security

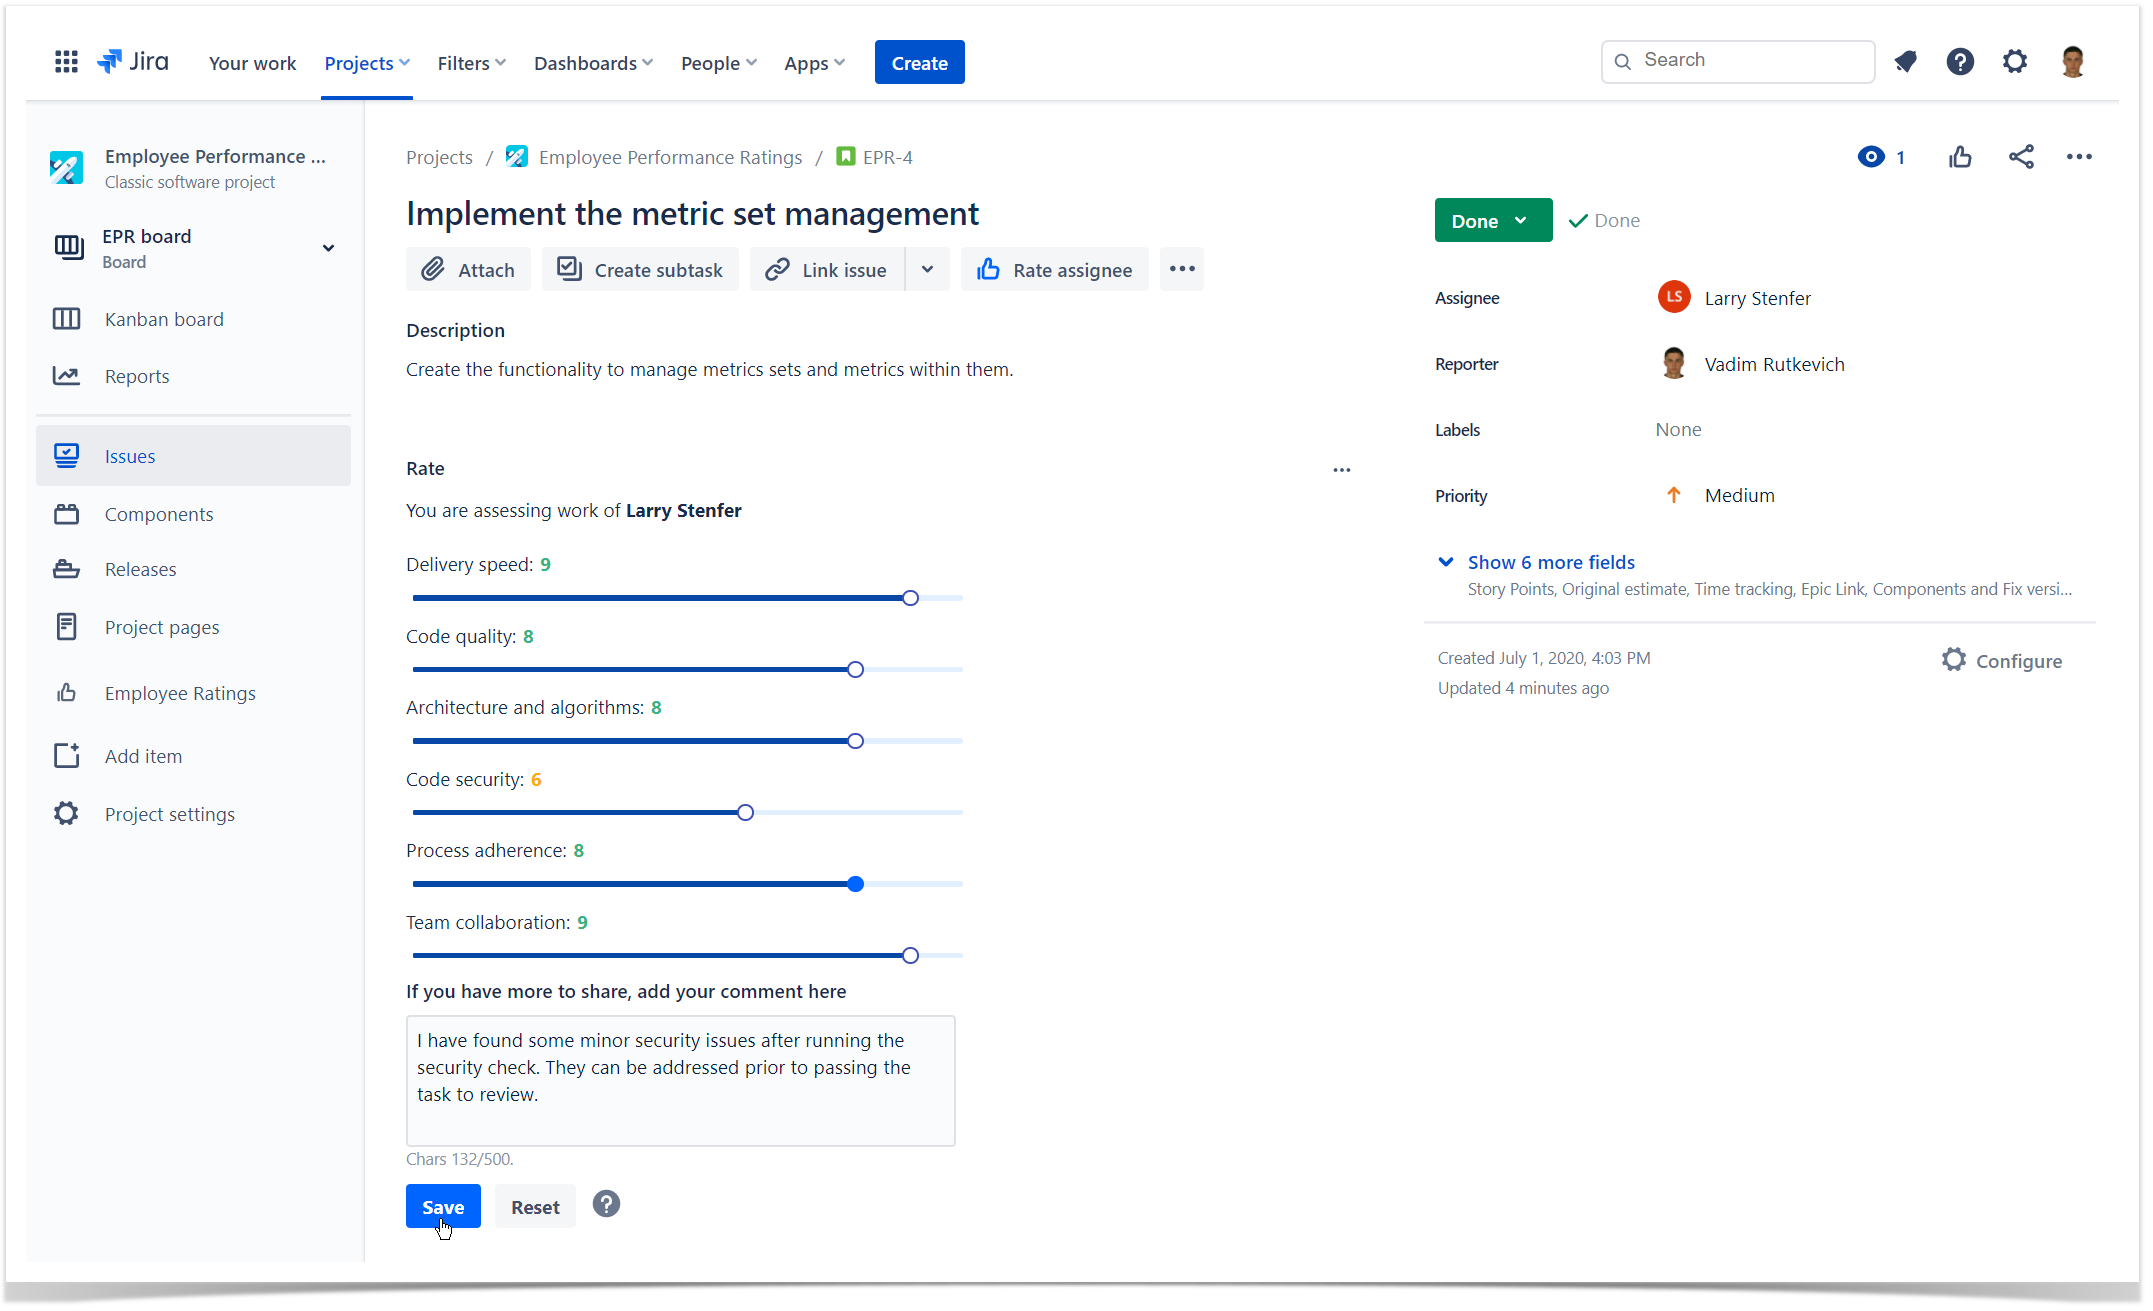
That’s done. Now you as a project manager or a team lead can proceed to the assessment of tasks in Jira. The performance evaluation process is pretty simple. You just need to put the score from 0 to 10 for each metric. While assessing a task, you need to pay attention to different factors, such as the difference between estimations and spent time, code smells, found security vulnerabilities, comments within pull requests, communication with teammates, and so on.

Assessment of tasks in Jira

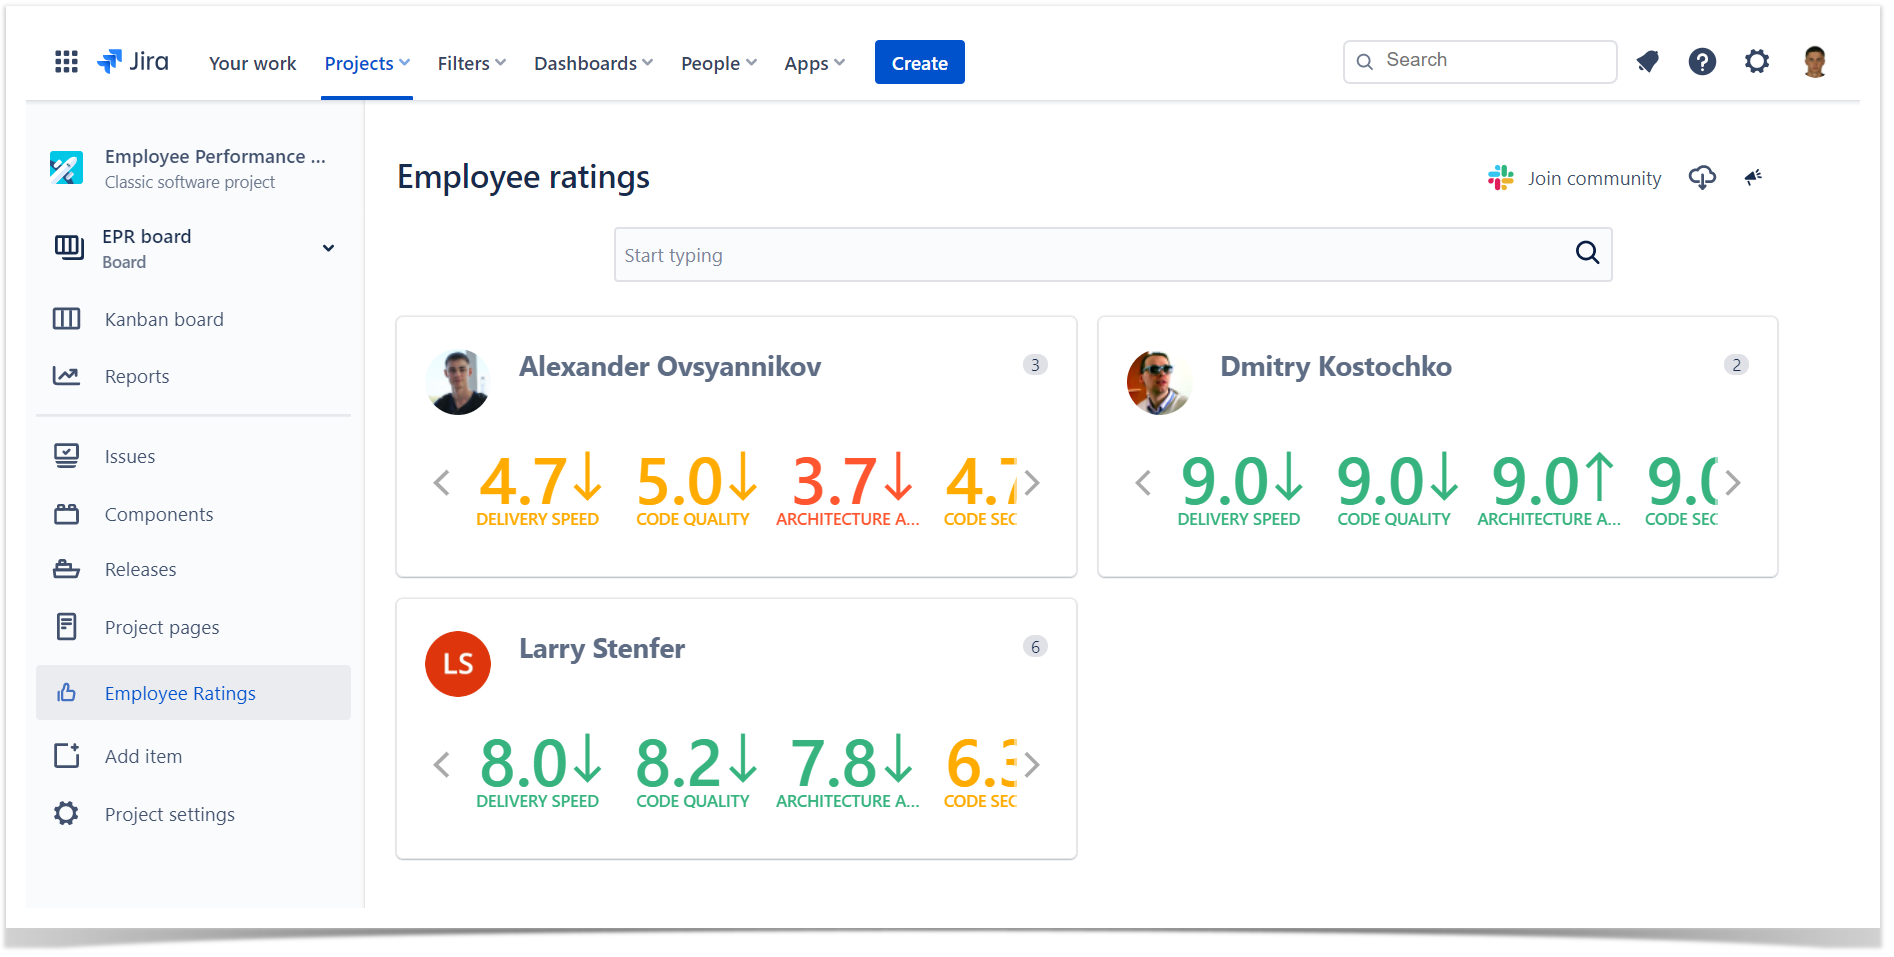
Having assessed multiple tasks for the same person, you can check the individual progress over time and the overall trend. This way, you can quickly and easily elaborate a metric-specific development program for each teammate to increase the overall team performance and effectiveness.

If your team is working on multiple projects or products, you can track the individual performance in each project, in particular, to better see what tasks inspire your teammates.

Track the individual employee performance in each project

Once you have collected sufficient performance analytics, you can see what things you need to improve within your team processes and how every teammate can contribute. In addition, you can compare the metric changes over time for individual teammates and continuously improve them if noticing any problems.

In the next section, we will tell you how you can educate your development team and train employees with the learning management system (LMS) in Confluence Cloud.

My team has some problems. What should I do next?

Once you have found that your team does not perform as you expected, it’s time to help them by providing them with resources for self-education.

Since many of us are working from home, it’s almost impossible to organize an onsite training. At the same time, sharing related books or articles is not the case either as you can’t track understanding of the material.

Having a comprehensive e-learning solution can come in handy. Managers all over the world use different learning management systems for internal training. LMS not only helps managers stimulate their team’s self-development but also saves their time as well as automates the process of training.

In this blog post, we’re describing solutions for Atlassian products, and we’d like to tell you how to turn your Confluence into an LMS.

Team training right in Confluence

izi – LMS for Confluence is a tool the can simplify employee training and improve your team’s performance in the short term. With this app, you can create courses, quizzes, and tests right in Confluence. Moreover, your team continues working with the tool they are familiar with, and you don’t need to configure anything to start since it works out of the box.

create courses, quizzes, and tests right in Confluence

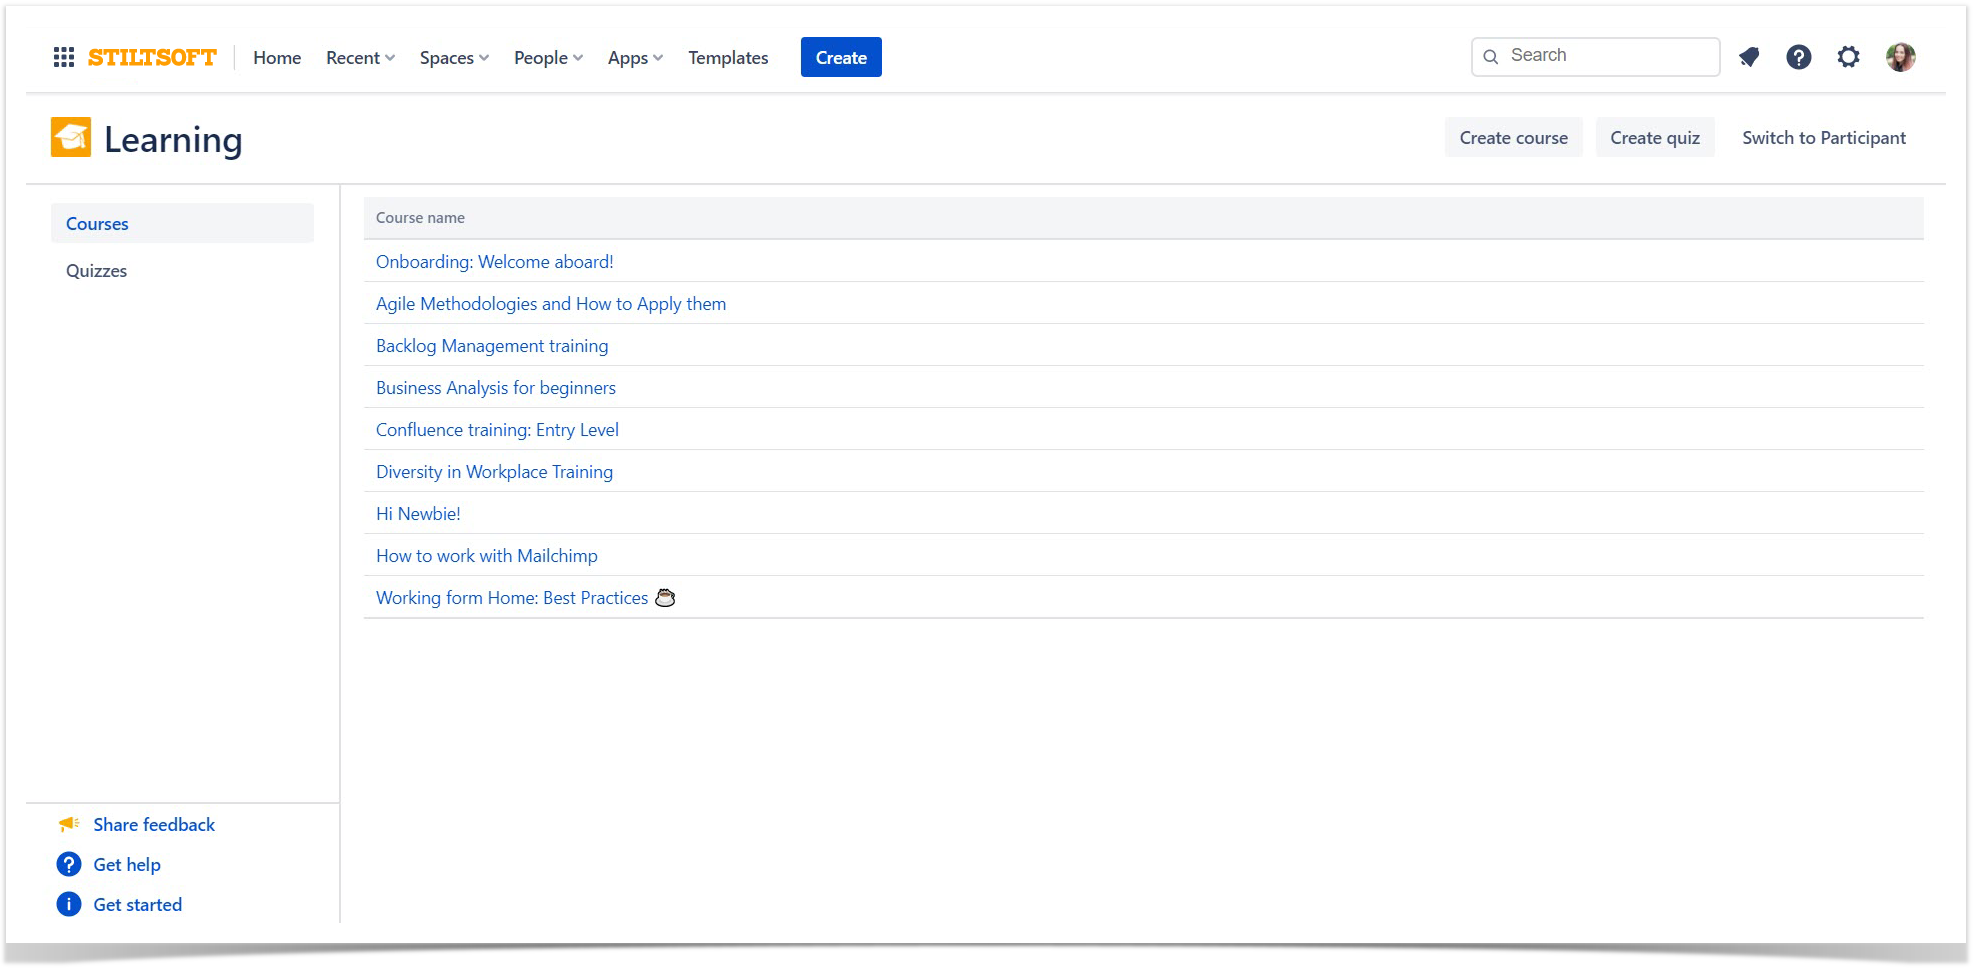
Start from the Learning portal – a place where you can administer your courses and quizzes. Here you can also create training that will cover your team’s knowledge gaps. A familiar interface will help you build it from scratch like a shot.

Enrich course pages with eye-catching pictures and educational videos to make content easier for understanding. You can also add PDF, Word, Excel, and Powerpoint documents.

Engaging content in Confluence courses

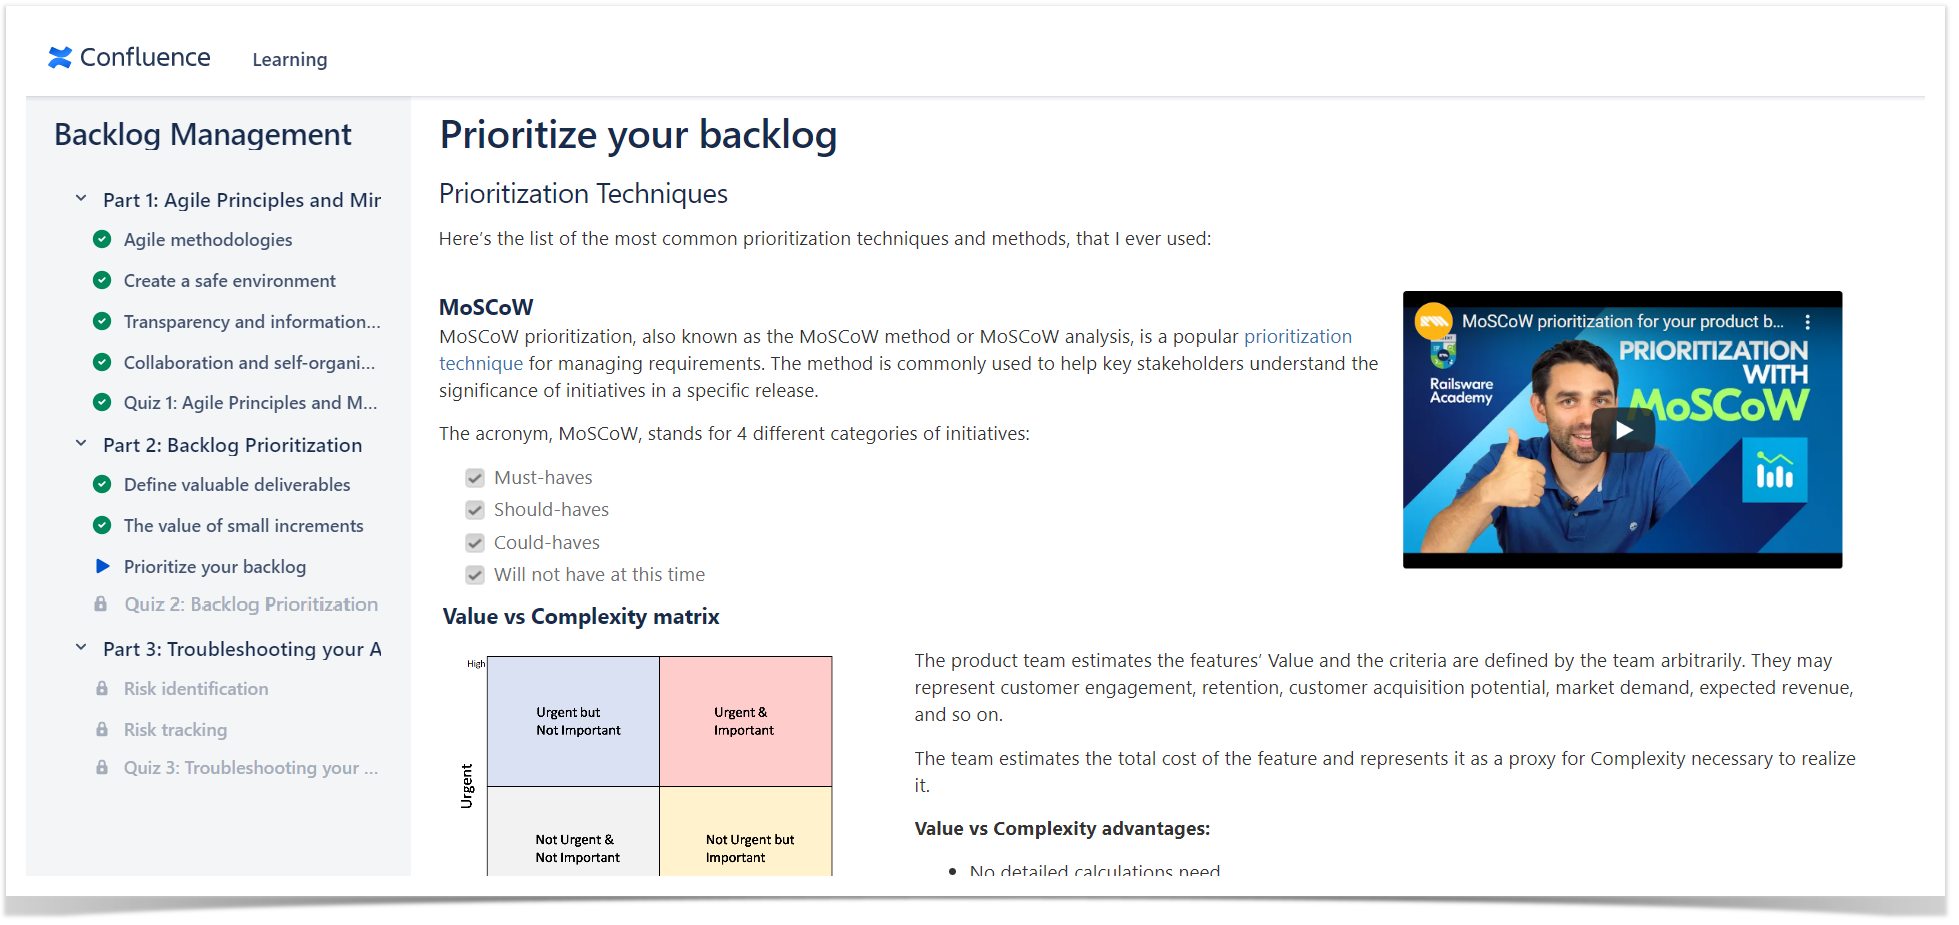
Reuse existing Confluence pages for your training to save your team time and effort. It can be worthwhile if you already have some useful content in your Confluence.

When done with the course part, add a quiz for your teammates to test their knowledge. Adjust the quiz to your needs with plenty of settings, and don’t forget to include a few tricky questions (because life is a rollercoaster 🙂).

 add a quiz for your teammates to test their knowledge

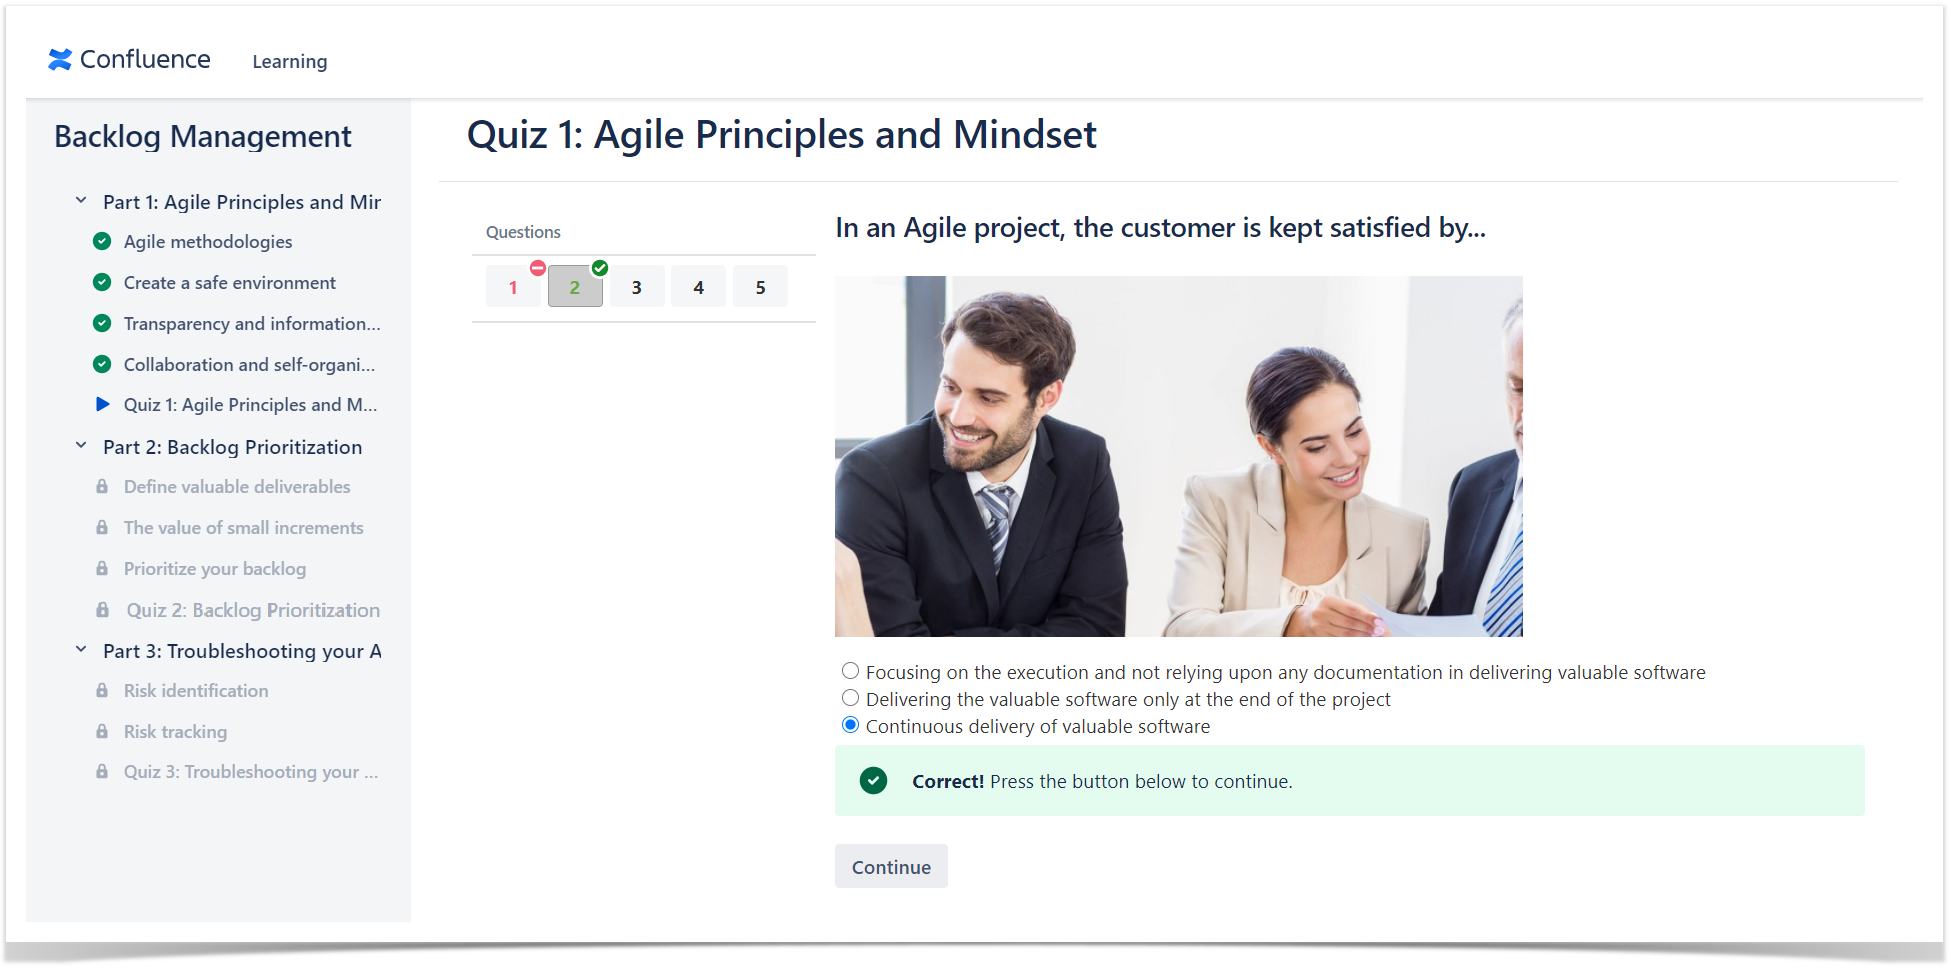
That’s it; your training is ready. It’s time to assign it to your team and wait for the results. Each course or quiz has a report where you can track your team’s progress. Analyzing the results, you can decide if they need another training session.

 track your team's progress in courses and quizzes

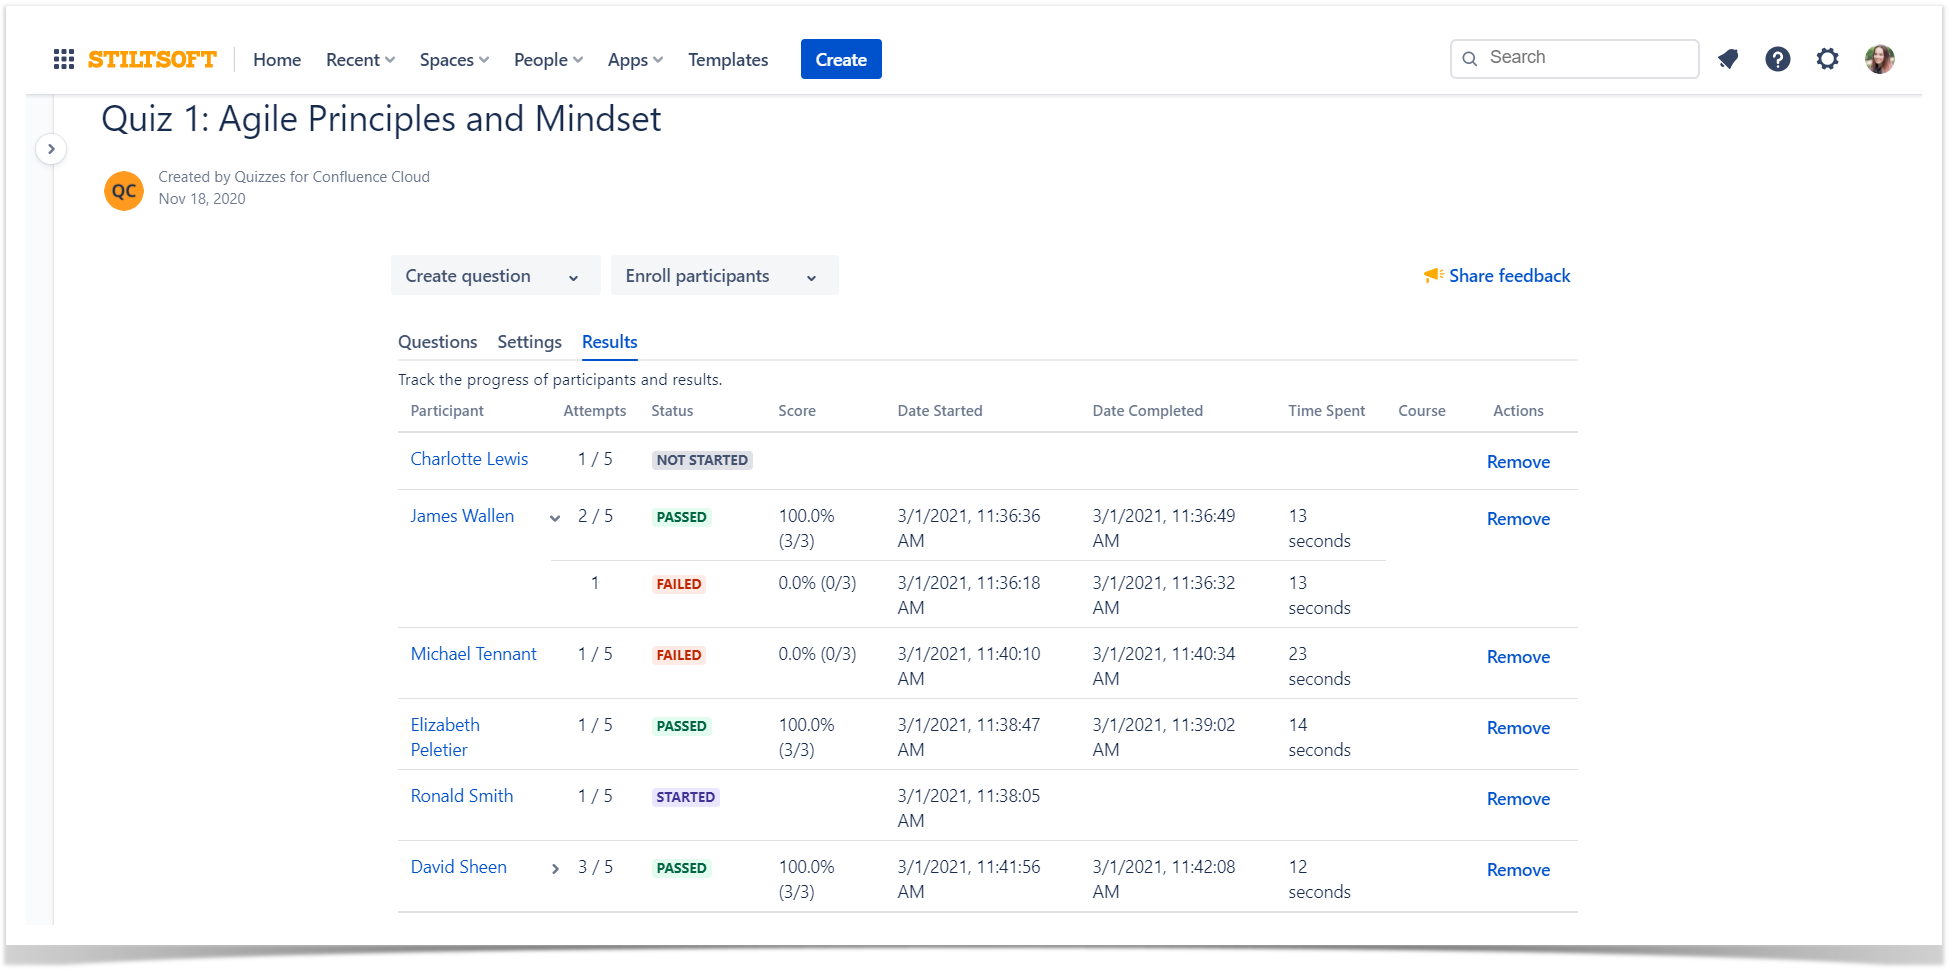
Your teammates can track their performance themselves. On the Learning portal, they can find the list of all courses and quizzes they need to take and see their progress and results.

Having an LMS in Confluence, you don’t need to learn how to use another software, integrate anything or spend time for complex configurations. The app gives you a perfect balance between a familiar interface and powerful features that can cover many use cases as onboarding, internal and external training, pre-employment testing, or employee certification.

Track and improve your team’s efficiency

Nurturing high-performing teams is always a challenge, especially when we see each other only during video meetings. Basing on the experience of the hundreds of teams, we believe that only constant analysis of your team’s performance and improvement of their skillset leads to successful product delivery.

We hope that a combination of Employee Performance Ratings and izi – LMS for Confluence will help you deliver top-quality products and build a team with a strong knowledge of what they’re doing.

How to Assess Performance of Support Teams in Jira Cloud

August 18, 2020
#Jira
6 min

Every company does its best to deliver high-quality and robust support services to its customers. This lets every company establish reliable long-term relationships with customers and increase brand loyalty.

Jira Service Desk from Atlassian allows companies to set up an effective support portal and handle all sorts of support requests coming from customers.

For every business its vital to understand the quality of provided support services and continuously work on their improvement. For doing this, there are several ways how you can get insights on support effectiveness and collect feedback on what to improve from customers.

Satisfaction feedback

Jira Service Desk provides the native satisfaction feedback module which sends emails to customers once their tickets are closed. This module can be enabled within the project settings.

Every customer is prompted to leave feedback once the ticket is closed and add a comment about the support agent and provided services.

Then you can view the customer satisfaction report with all feedback and ratings which customers leave.

Using the default feedback module you can receive valuable information about your support agents and view the average rating over the recent periods. The only problem with it is that your customers may ignore it and leave no feedback at all.

Employee Performance Ratings

Unlike the standard Customer satisfaction module, the Employee Performance Ratings app provides a quick way to collect assessment ratings against the three metrics.

Once the ticket is closed, the customer can assess support quality, response speed, and efficiency of the support agent. The form appears inline in the ticket, so it increases the assessment rate if comparing to the customer satisfaction module.

Within the project, you can view the average ratings per support agent, as well as assessment details per each task. As a Customer Success Manager, you can track the overall progress of your support agents and see what you can improve.

The app allows you to export ratings to a CSV file and continue their further evaluation.

Charts and Reports for Jira ServiceDesk

This app lets you create a dashboard for tracking the progress on tickets within Service Desk projects. You can re-use widgets from the pre-defined list or create your own widgets (KPI, chart, or table) on the fly.

You can monitor the progress on tickets in real time and apply filters to compare different reporting periods. Management of the dashboard and widgets is simple and intuitive, so it will not take much time to design what you need.

If needed you can dive into details of each widget and see the raw reporting data. With this app, you can build a custom reporting solution and track the activity and performance of your support department.

Custom Charts for Jira – Reports

This app lets you design an eye-capturing dashboard and output the essential information about the performance of your support team in Jira Service Desk projects.

You can present information about tickets, customer satisfaction, workload per support agents on simple and easy-readable charts. There is a series of different chart types, so you can easily pick the one which better visualizes data and variate the data the way you need.

Configuration of widgets is pretty simple, so there should be no problems getting started with the app.

What’s next?

For assessment of the support services in Jira Service Desk, you may need to use multiple tools to get more insights on the overall status with tickets and individual performance of your support agents. First of all, identify what you want to measure and analyze and only then pick the right tool for doing this.

In the next blog post, we will review the tools to manage attachments and documents in Jira Cloud. Keep following on our blog updates.

Evaluating Employee Performance and Skills in Atlassian Confluence

May 21, 2020
#Reporting#Analytics#Confluence#Jira
7 min

Assessment of employee performance has never been an easy process. The team managers have to run a series of meetings with colleagues of an employee who is assessed, need to review the KPI’s and overall goals and objectives. The worst thing is the subjective assessment which can greatly differ from the actual situation.

Is it possible to automate and digitalize this process? Yes, and quite easy. Today we will review a quick way to collect employees’ work ratings for regular performance reviews and analyze them in Confluence. To do this, we will use the two apps Employee Performance Ratings and Table Filter and Charts.

Collecting employee performance ratings

Collection of data about employee performance is a tricky task. It should be integrated into the existing working processes and workflows, so all the essential metrics can be captured on a regular basis and in the right context.

In our case, we have a product development team that uses Scrum and two-week sprints for product development. All tasks are managed and tracked in Jira Cloud. The team lead, project manager, and QA manager assess completed tasks against the three metrics: quality, speed, and skills of the assignee. The assessment is performed with the Employee Performance Ratings app once the task is completed.

employee performance rating

The overall employee ratings are calculated automatically by the app and are available within each project. For each employee, you can see the current trend and understand whether the employee performs better or worse.

All the project ratings over the six months can be exported to CSV for further evaluation, and we will do this. The app allows you to export raw assessment data and average aggregated values.

CSV with report in Confluence

Good! We have a CSV file, now it’s time to do some magic.

Evaluating performance of your team

Having a CSV file with performance ratings, it’s time to analyze them and get useful insights on each employee’s performance.

Let’s create a new Confluence page and attach our CSV file to it. When this is done, we can output the contents of this file with the CSV macro. Upon saving the page, you should see a table with performance ratings that we can further work with.

Now it is high time to do some manipulations and see the performance metrics per each sprint. For doing this, we add the Table Toolbox macro and put our CSV macro within it. That’s it.

Within the Table Toolbox macro, create a structure of Chart from Table > Pivot Table > Table Filter and > CSV.

Then select the Pivot Table module and set its configuration, as follows:

  • Row labels – select issue-sprint.
  • Column labels – select assignee.
  • Calculated column – select efficiency, speed, or work quality depending on what you want to evaluate.
  • Operation type – select Average to calculate the average value for the selected metric in the calculated column.

Let’s save this all and adjust the look of the chart in the page view mode. For the chart settings, select the issue-sprint as a Labels column and select columns with average values of the metric for each employee. Additionally, you can enable the trendline for your charts to see the progress from sprint to sprint.

Now you can see how performance metrics of developers change from sprint to sprint and see the deviations to better understand how the sprint scope affected performance of individuals. The same way you can track how junior developers progress per each sprint.

Well, let’s see how metrics differ depending on the issue type. This way, you can better understand the strengths of your developers and identify their areas of growth.

Just change the aggregation to issue-type in the Row labels box. Now you can get information about the issue types developers perform better. So that as a project manager, you can assign specific issue types to corresponding developers.

This is how you can assess the performance of your development team with the Table Filter and Charts for Confluence app based on data collected with the Employee Performance Ratings app. You can go further and visualize other things that you are interested in. Just change the aggregation options, and you will instantly see the data you are interested in.

What’s next

The Employee Performance Ratings neatly integrates with the Jira Cloud interface and with your working processes. You can assess the key metrics of a specific developer once the task is closed and collect objective data for regular performance reviews from several people.

The Table Filter and Charts for Confluence app gives you a rich set of tools to evaluate, aggregate, visualize, and transform your table data in Confluence Cloud.

Have problems with collecting performance analytics, or have a more complex use case to implement, feel free to comment on this post.

Employee Ratings for Jira Cloud Released!

February 20, 2020
#How To#Jira
3 min

We are pleased to announce the release of Employee Ratings for Jira Cloud!

Do you feel frustrated when it comes to regular performance reviews? You need to talk to a lot of people, find out what they think about the person whose performance you are assessing. You need to coordinate multiple one-on-one meetings, gather information, analyze it, and, finally, determine the current situation on the basis of subjective opinions.

The Employee Ratings app concentrates more on the performance of the individual rather than on their personal characteristics. This solution allows other employees to contribute to the career development and promotions of their colleagues.

Give your employees a way to evaluate the work of each so that you can get an unbiased assessment of their performance based on ratings from different people.

When someone closes the issue, the reporter of the task gets a capability to assess the completed work against three metrics:

  • Work quality. This metric helps you track how well the work was completed to determine its quality.
  • Speed. This metric captures task performance time illustrating how fast the task reached the end.
  • Skills / Efficiency.  This metric demonstrates how the working process was going on and whether any external help was needed.

Your employees can review their colleagues’ progress regularly, so you can automatically collect data for performance reviews with minimal efforts.

As a result, within each project, you get a single dashboard showing metrics for each person involved in this or that project.

Besides the metrics, you can view the trend for each parameter, so you can better understand whether it improves or worsens. By combining metrics from different projects, you can better understand how your employees perform, what they’re doing well and where they could improve.

Employee Ratings for Jira Cloud can help you make informed decisions regarding employee contribution, training needs, and career development.

Take a more comprehensive approach to employee development and make your performance review run smoothly. Use the metrics to improve the performance of individuals and the team as a whole.