







How to Get Global Graphs in Bitbucket Data Center

Project and repository analytics, available in the Awesome Graphs for Bitbucket app, have met the needs of many teams. However, some Bitbucket Data Center instances can hold hundreds of repositories spread across dozens of projects. In these cases, understanding how delivery is going across the whole engineering department often meant writing scripts for REST API or manually gathering data from each project.
Global Graphs, recently launched in Awesome Graphs for Bitbucket Data Center, bring the graphs you already use to the level of your entire Bitbucket instance. Filters for projects, repositories, teams, and users then narrow that global picture down to whatever slice of the organization you need, saving you hours in reporting.
Awesome Graphs for Bitbucket is a top-rated analytics tool that visualizes commit and pull request activity, contributor statistics, and delivery metrics in Bitbucket.
Global analytics beyond the People page
Instance-wide analytics are not entirely new to Awesome Graphs. The People page has provided a global view of developer activity across all projects and repositories, along with CSV exports and REST API. It cannot, however, show ready-to-use engineering statistics, how activity splits among a handful of specific projects, or what the individual events behind the totals actually were.
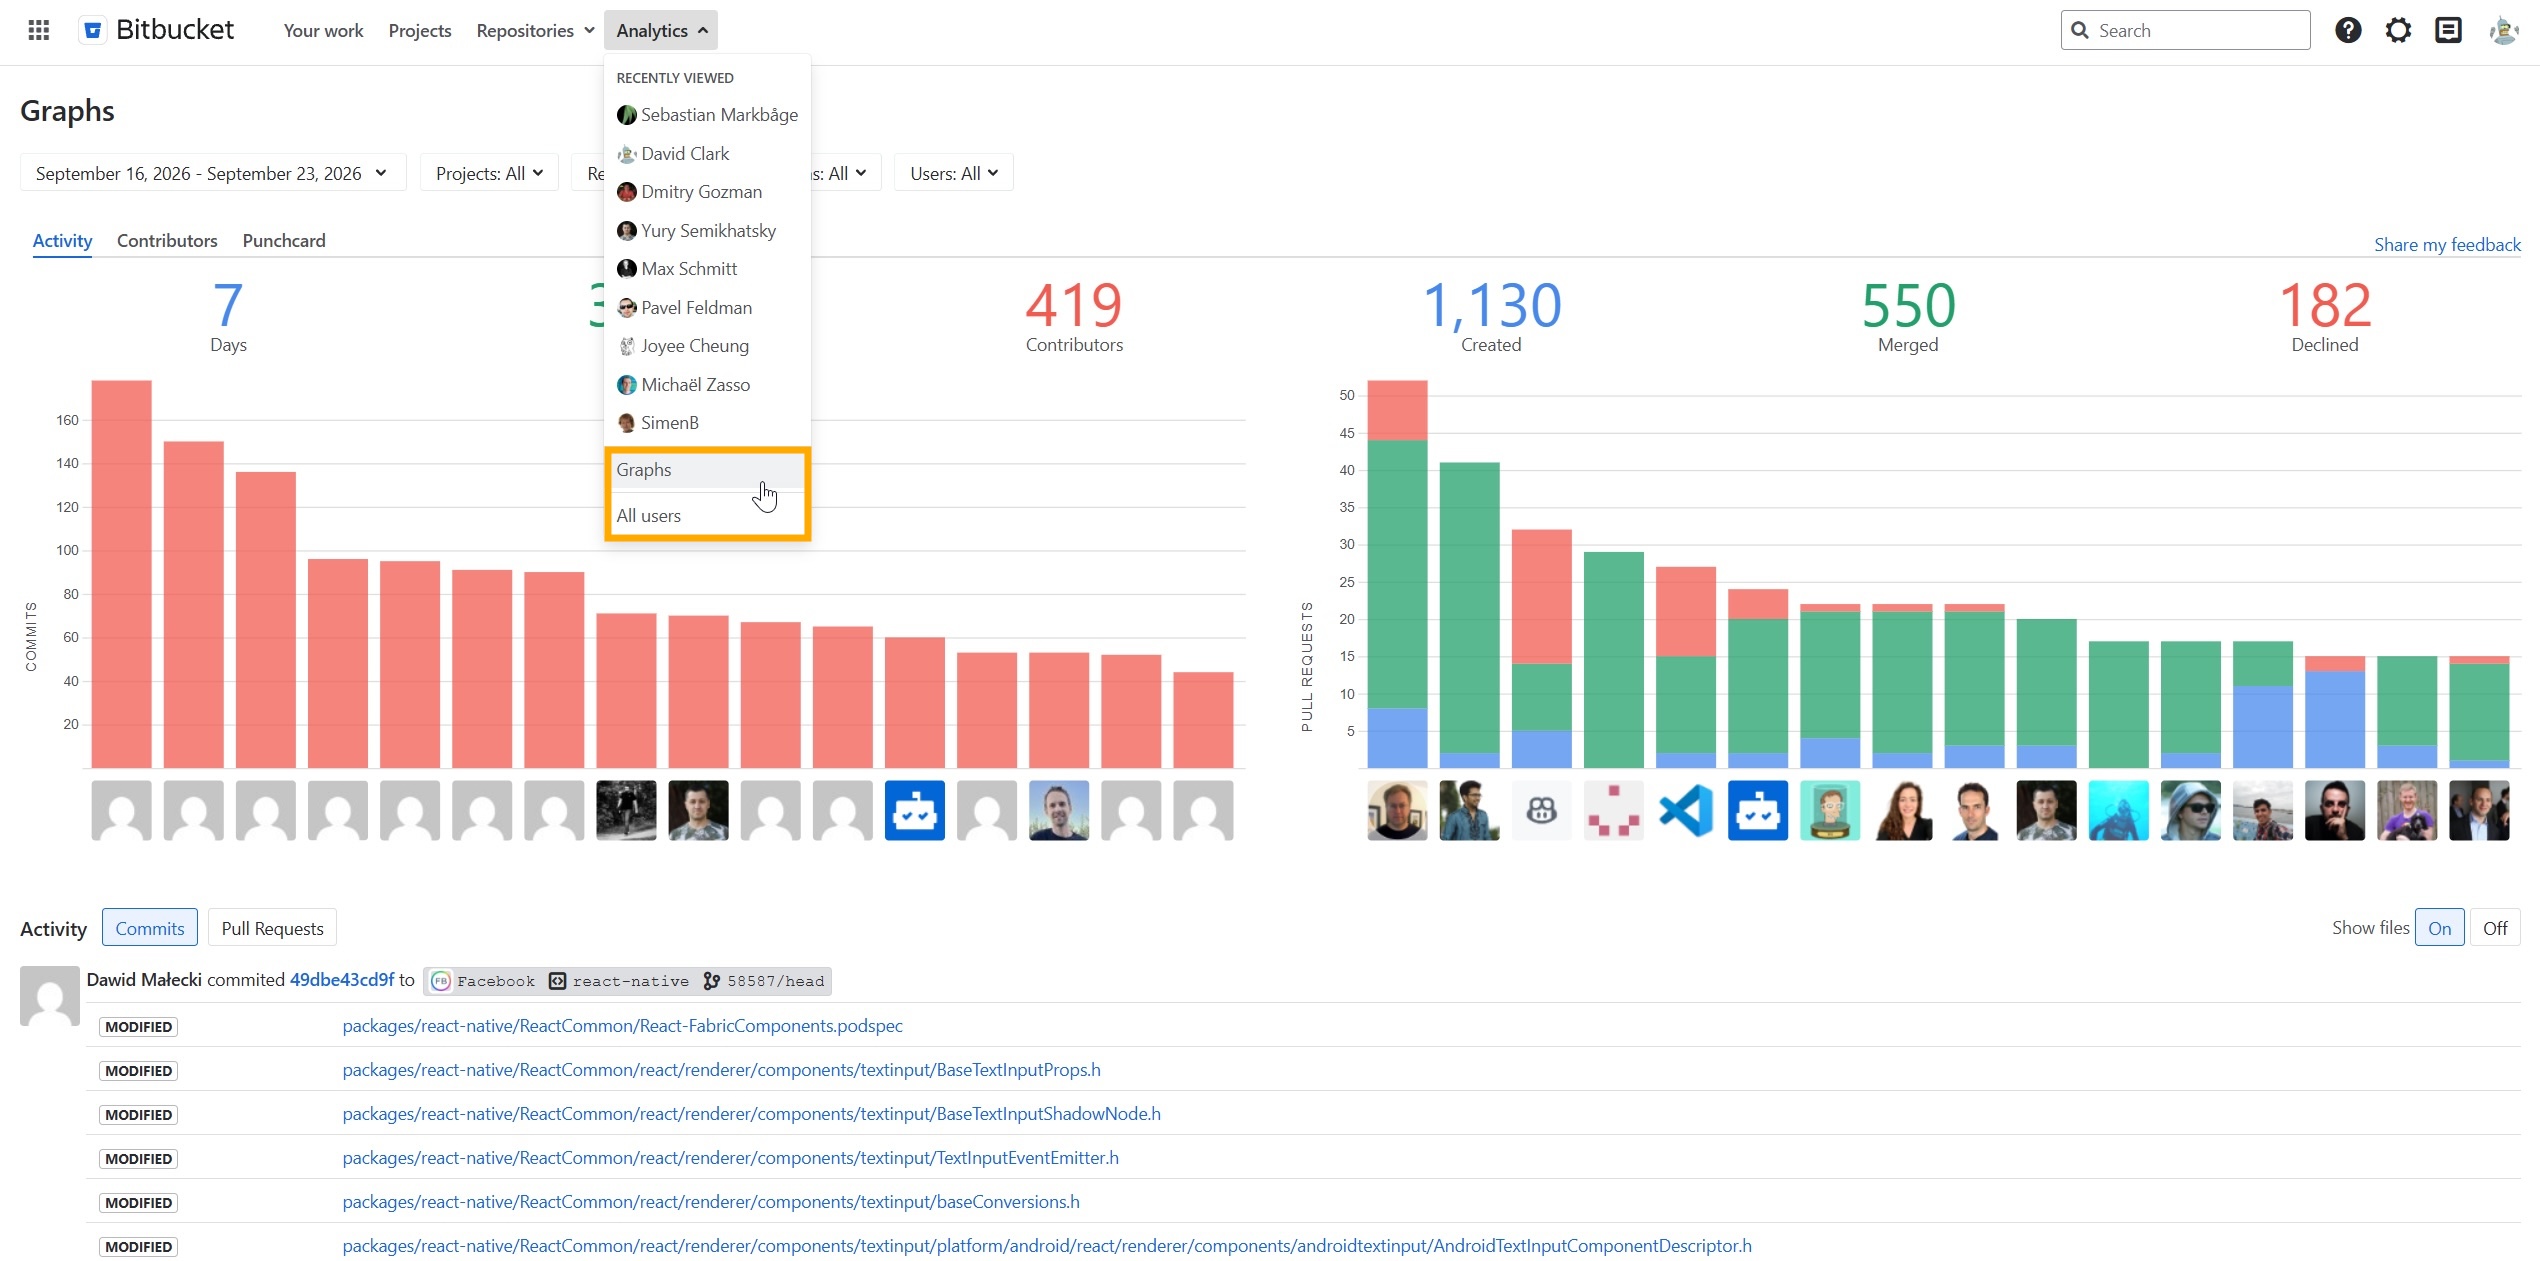
Global Graphs bridges that gap. Open the Analytics menu in the Bitbucket header, and the familiar Activity, Contributors, and Punchcard graphs are waiting there with your whole codebase as the data scope. There are no new metrics to learn and no extra configuration – the same graphs, just viewed through a wider lens.
Where Global Graphs help
This expansion of scope opens up many new use cases for the activity analytics in Awesome Graphs.
Get global engineering statistics in one click
Pick a period – a sprint, a quarter, a full year – and the Activity tab gives you the headline numbers for the entire instance: how many commits were made, how many people made them, and how many pull requests were created, merged, and declined. This report can be generated in one click, making quarterly reporting to higher management fast and easy.
Get accurate data for contributors whose work is spread across repositories
Platform engineers, tech leads, and infrastructure teams often contribute to many different repositories. In any single project, their footprint might look modest, but viewing activity data at the global level, the Activity and Contributors graphs show the real scale of their work, which matters for recognition, planning, and uncovering key contributors at the company level.
Tailor the data scope to your needs
Project structure doesn’t always match the data scope you want to measure. A product is often built from services living in separate projects, and a migration usually touches repositories scattered across several of them. The Projects and Repositories filters on Global Graphs let you build exactly the set you care about and analyze it as a unit, which neither repository-level nor project-level analytics could do. Keeping the period fixed and switching between selections also gives you a quick read on how one part of the organization compares with the instance overall.
See when your organization actually commits
The Punchcard graph maps commit activity onto days of the week and hours of the day. Applied to a narrower scope, it describes one team’s habits; applied to the whole instance, it describes your engineering culture. Use it to see how much work lands on weekends and late evenings across the department, to understand the timezone spread of distributed teams, and to schedule maintenance windows for the hours when your instance is quietest.
How to get it in your Bitbucket
Global Graphs are now available in Awesome Graphs for Bitbucket Data Center. If you already run the app, update to the latest app version and open the Graphs or Reports section to select the instance scope. If you are new to Awesome Graphs, you can start a free trial on the Atlassian Marketplace.
More from our blog:
➡️ How to use the Working Days and Hours Filter in Awesome Graphs for Bitbucket Data Center
➡️ A guide on setting up permissions configurations in Awesome Graphs for Bitbucket Data Center