







From Page Properties Report to an Interactive Confluence Register

Key takeaways
-
A Confluence catalog or register usually starts the same way: one page per item, aggregated into a single view.
-
Content Properties Report macro (formerly Page Properties Report) is the standard way to build that aggregated view natively, with no app required.
-
On its own, Content Properties Report only produces a static table. It doesn’t filter, group, or calculate anything by itself.
-
Table Filter and Pivot Table macros (from the Table Filter, Charts & Spreadsheets for Confluence app) turn that static table into something interactive: filterable live, grouped by any dimension, summarized on the spot.
-
When Content Properties Report itself runs into limits, on row count, on how much metadata it can carry, or on how flexibly the table can be reshaped, Table Excerpt Include macro (from the Table Filter, Charts & Spreadsheets for Confluence app) takes over the aggregation step, with the same Table Filter and Pivot Table layer working on top of it either way.
Confluence registers and catalogs: a familiar problem
Confluence powers documentation and wikis for more than 100,000 companies (based on Atlassian’s Q2 FY2025 shareholder letter). At the same time, it also quietly powers a lot of catalogs and registers nobody officially designed: vendor lists, findings registers, resource trackers, all built the same way. One page per item, and a single view pulling them together.
Build a Confluence register yourself, and it is only a matter of time before you hit the same wall: the aggregated table shows you everything, but it doesn’t let you actually work with it. You can look at it. You can’t filter it, group it, or ask it a different question without rebuilding it.
That is what this post is about: how a standard Confluence register gets built, why the result is more static than it feels like it should be, and what changes once Table Filter, Pivot Table, and, when needed, Table Excerpt Include macros (from the Table Filter, Charts & Spreadsheets for Confluence app) get involved.
Four Confluence register and catalog examples
The essence of a catalog depends on the industry, the department, and even the specific role. There is no end to what can be cataloged. In this post, we will look at four real patterns:
-
Penetration testing reports – each security finding has its own page; a main page aggregates all of them into reports for monitoring.
-
Resource planning – each team role has its own page tracking team members; a summary report rolls it up into one view of team capacity.
-
Vendor/service catalog – each vendor has its own page; a main page provides one filterable catalog of all of them.
-
Content management – each content item is managed on its own page; a centralized dashboard shows status, owner, and publication date for everything at once.
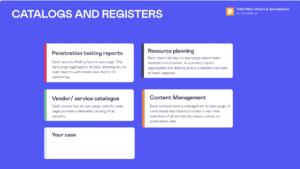
Same underlying shape every time: one page per item, and a single view that brings them all together. How well that view actually works is where things get interesting.
How to build a Confluence register using native features
Most registers start the same way, using two native macros together.
Content Properties (called Page Properties in Data Center) tags structured fields on each individual page:
-
On each item’s page, add the Content Properties macro.
-
Inside it, build a small table with your fields, such as “Owner,” “Status,” “Category,” whatever your register needs, and fill in the values for that item.
-
Add a label to the page (for example “vendor” or “finding”) so it can be grouped later.
-
Repeat this on every item’s page, one per vendor, per finding, per whatever the register is built from.
Content Properties Report (Page Properties Report in Data Center) then aggregates them:
-
On a central page, add the Content Properties Report macro and point it at your chosen label.
-
It automatically lists every page carrying that label, with your fields, in one table.
This gets you real aggregation with no app required. Add a new item page with the right label, and the central report picks it up on its own.
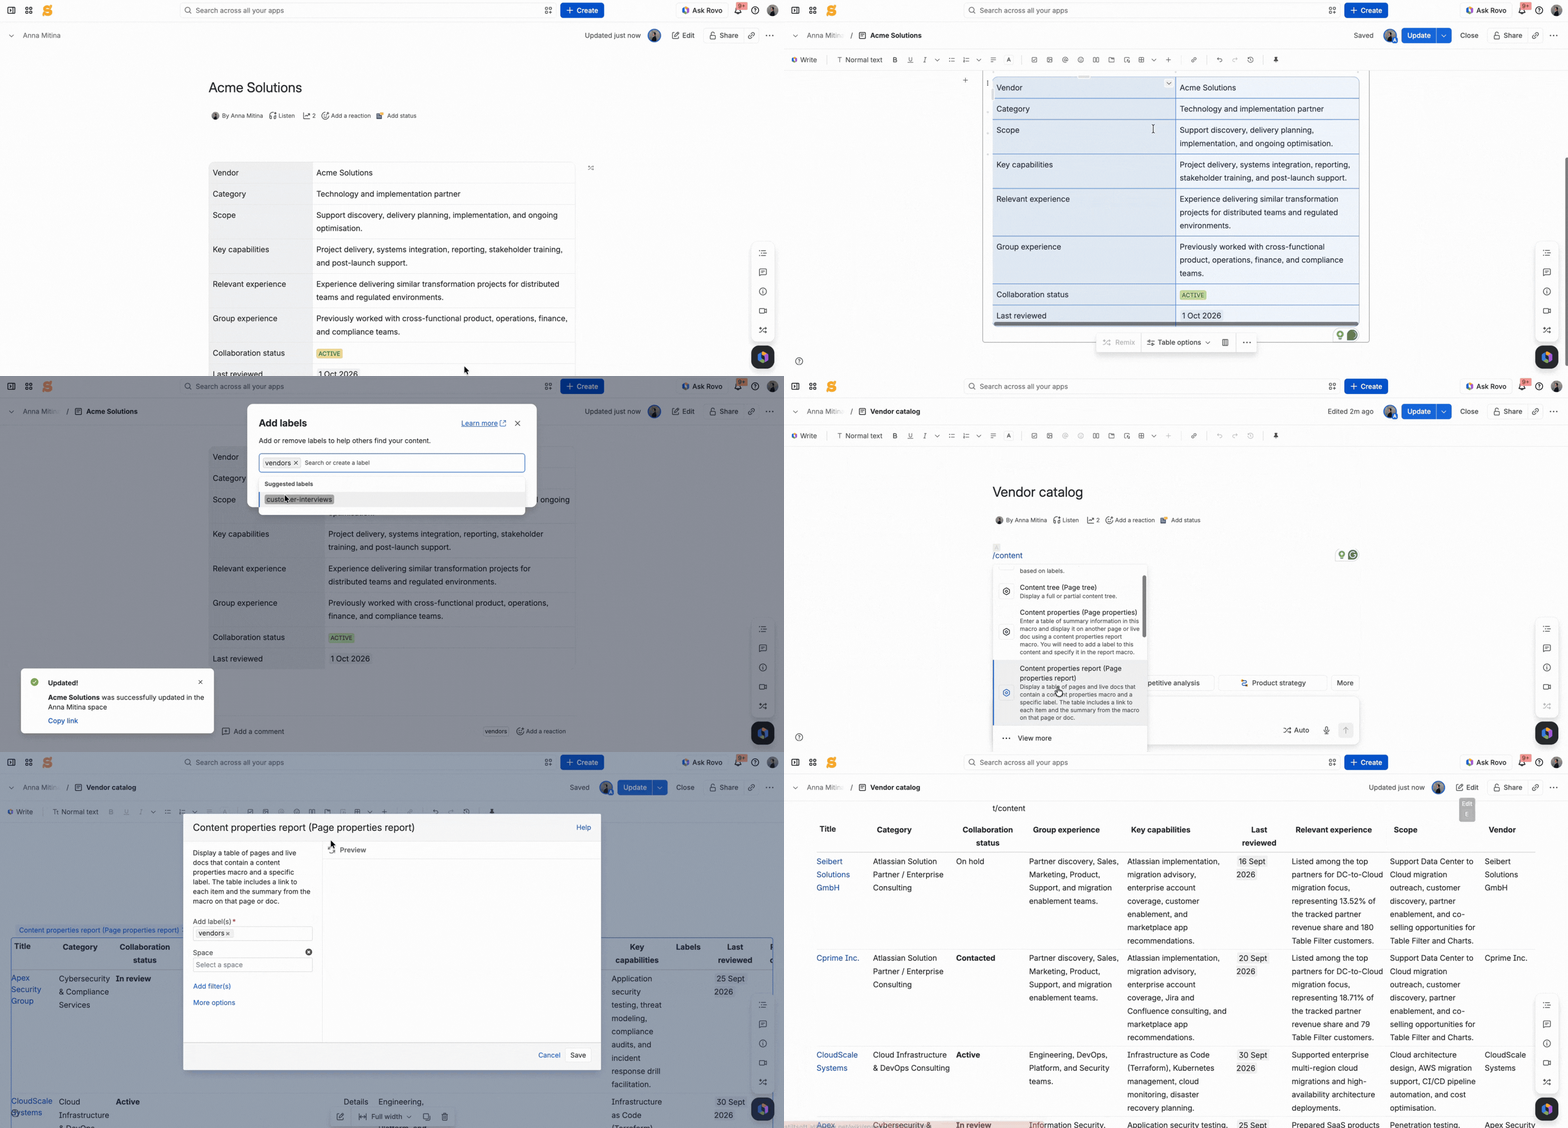
What it doesn’t do is turn that into a catalog you can actually work with. The report is a fixed, static table. It doesn’t filter. It doesn’t group. It doesn’t let a reader ask “just show me what’s overdue” without someone going into the macro’s own configuration and changing it by hand.
Turning a static report into an interactive catalog
This is where Table Filter and Pivot Table macros from Table Filter, Charts & Spreadsheets for Confluence come in, wrapped around the aggregated table Content Properties Report already built.
Table Filter macro makes that table interactive for anyone reading the page: live filtering, sorting, and searching, with no editing the macro and no asking someone to rebuild the report.
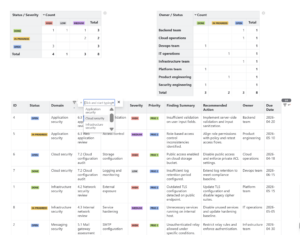
Pivot Table macro goes a step further, taking the same aggregated rows and grouping them by whatever dimension actually matters. One pivot grouped by severity and status shows where the real risk sits. A second, grouped by owning team, shows who’s carrying the load. Same source table, two different summaries, both live.
This is the combination most teams land on, and for a lot of registers, it’s genuinely enough: Content Properties Report handles the aggregation, Table Filter and Pivot Table macros handle everything a reader actually does with it.
When Content Properties Report itself becomes the limit
Sometimes the aggregation step is where things break down, not the interactivity. A register grows past a few hundred pages, needs more metadata pulled through than Content Properties Report can carry, or needs the underlying table reshaped in a way the native macro doesn’t support.
That’s what Table Excerpt Include is for. It isn’t a replacement for Content Properties Report, and most teams don’t rip out an existing setup to switch. It’s an alternative aggregation step, used specifically once the native one runs out of room:
-
No practical row-count ceiling the way Content Properties Report has.
-
Pulls through more metadata per item, not just the fields a property macro captured.
-
Can reshape and transpose the aggregated table, not just list it.
-
Finds its sources more flexibly too: by label (the same idea as Content Properties Report), by a specific page, by a page and its children, or by a page and all its descendants.
Once Table Excerpt Include has built the aggregated table, the exact same next step applies: Table Filter, Pivot Table, and Chart from Table wrap around it to make it interactive, the same as they would around a Content Properties Report table. The aggregation method changed. The interactivity layer didn’t.
A full example: a filterable, pivoted findings register
Every security finding lives on its own page. A central register aggregates them, and two pivot views sit on top of it: one grouped by severity and status, one grouped by owning team. A security lead filters straight to what’s still open, right now, without waiting on anyone to rebuild anything.
The same pattern, other catalogs
Resource planning – same aggregation, different pivot: instead of counting findings, it’s summing capacity, hours, or headcount, added up by role. A manager gets an immediate view of where the team is actually stretched thin, and nobody has to tally it up by hand.
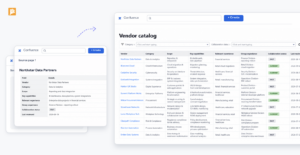
Vendor/service catalog – this one leans on Table Filter macro’s live search more than pivoting. The real need is speed: “Do we already have a vendor for X?” needs an answer in seconds, filtered by category, scope, or experience on the spot, not a scroll through a long list or a message to whoever remembers.
Content management – status, owner, and publication date become the pivot dimensions instead of severity and team. A Chart from Table macro on top turns that breakdown into a visual: published versus stale, at a glance, for anyone reporting up who wants the shape of things rather than the row-level detail.
Why Table Excerpt Include is worth trying
Four different catalogs, four different teams, one shared shape: a register that’s only useful once something makes it interactive, not just aggregated.
Content Properties Report gets the aggregation done natively, no app required. Table Filter and Pivot Table macros turn that into something a team can actually use day to day. And when the aggregation step itself runs out of room, Table Excerpt Include macro picks it up from there, without anyone needing to rebuild what already works.
If any of the four cases above sounded familiar, Table Filter, Charts & Spreadsheets for Confluence is free to try from the Atlassian Marketplace.
FAQ
What is Table Excerpt Include used for?
Table Excerpt Include macro (from the Table Filter, Charts & Spreadsheets app) aggregates structured tables from many Confluence pages into one combined table, by label, by a specific page, or by a page and its child pages. It handles the aggregation step; filtering and pivoting still come from wrapping the result in Table Filter or Pivot Table macros separately.
Does Table Excerpt Include replace Content Properties Report?
Not usually. Most teams keep Content Properties Report as their default way to aggregate a register, and add Table Excerpt Include specifically where that native aggregation hits a limit, on row count, on metadata depth, or on reshaping the table, rather than switching over entirely.
What is the difference between Confluence Page Properties and Content Properties macros?
They are the same macro under two names. Page Properties is the name used in Data Center and older Cloud versions. Content Properties is the newer name used in Cloud.
Can a Content Properties Report be filtered or sorted by the reader?
No. It can be configured with filters and sorting, but only by editing the macro itself. Anyone viewing the page can’t filter or re-sort it live. That’s what Table Filter macro (from the Table Filter, Charts & Spreadsheets app) adds on top of it.
How is a Confluence register different from a regular table?
A Confluence register is a structured collection of individual items, typically one page per item, brought together into a single aggregated view. A regular table just holds whatever rows are typed into it directly, with no connection to other pages and no way to pull in new items automatically.