How Researchers Track Developer Productivity in Bitbucket
August 29, 2024
#How To#Bitbucket#Case Study
10 min
I am in charge of several people in a development project and Awesome Graphs helps me to see the best tasks assignation, the team performance, and the critical points along the year. In this way, I can make the best decisions to reduce costs and shorten the turnaround time for the solutions. Moreover, it is a way to help boost the competitiveness of my team, track developer productivity, and not be intrusive in their personal work.
Javier López Ruiz, Team Lead, Planificando
In this case study, we’ll uncover how one of our customers uses Awesome Graphs to analyze contribution statistics and track developer productivity in Bitbucket. The company specializes in the research and development of software solutions for optimizing logistics planning and transportation using advanced AI techniques. While Bitbucket meets their primary needs regarding code management, there are no built-in features they can use to monitor developer activity in projects and repositories.
That is why they decided to extend the Bitbucket functionality by installing the Awesome Graphs for Bitbucket app, which brings in multiple graphs and charts and allows the team to achieve their goals.
Commit log
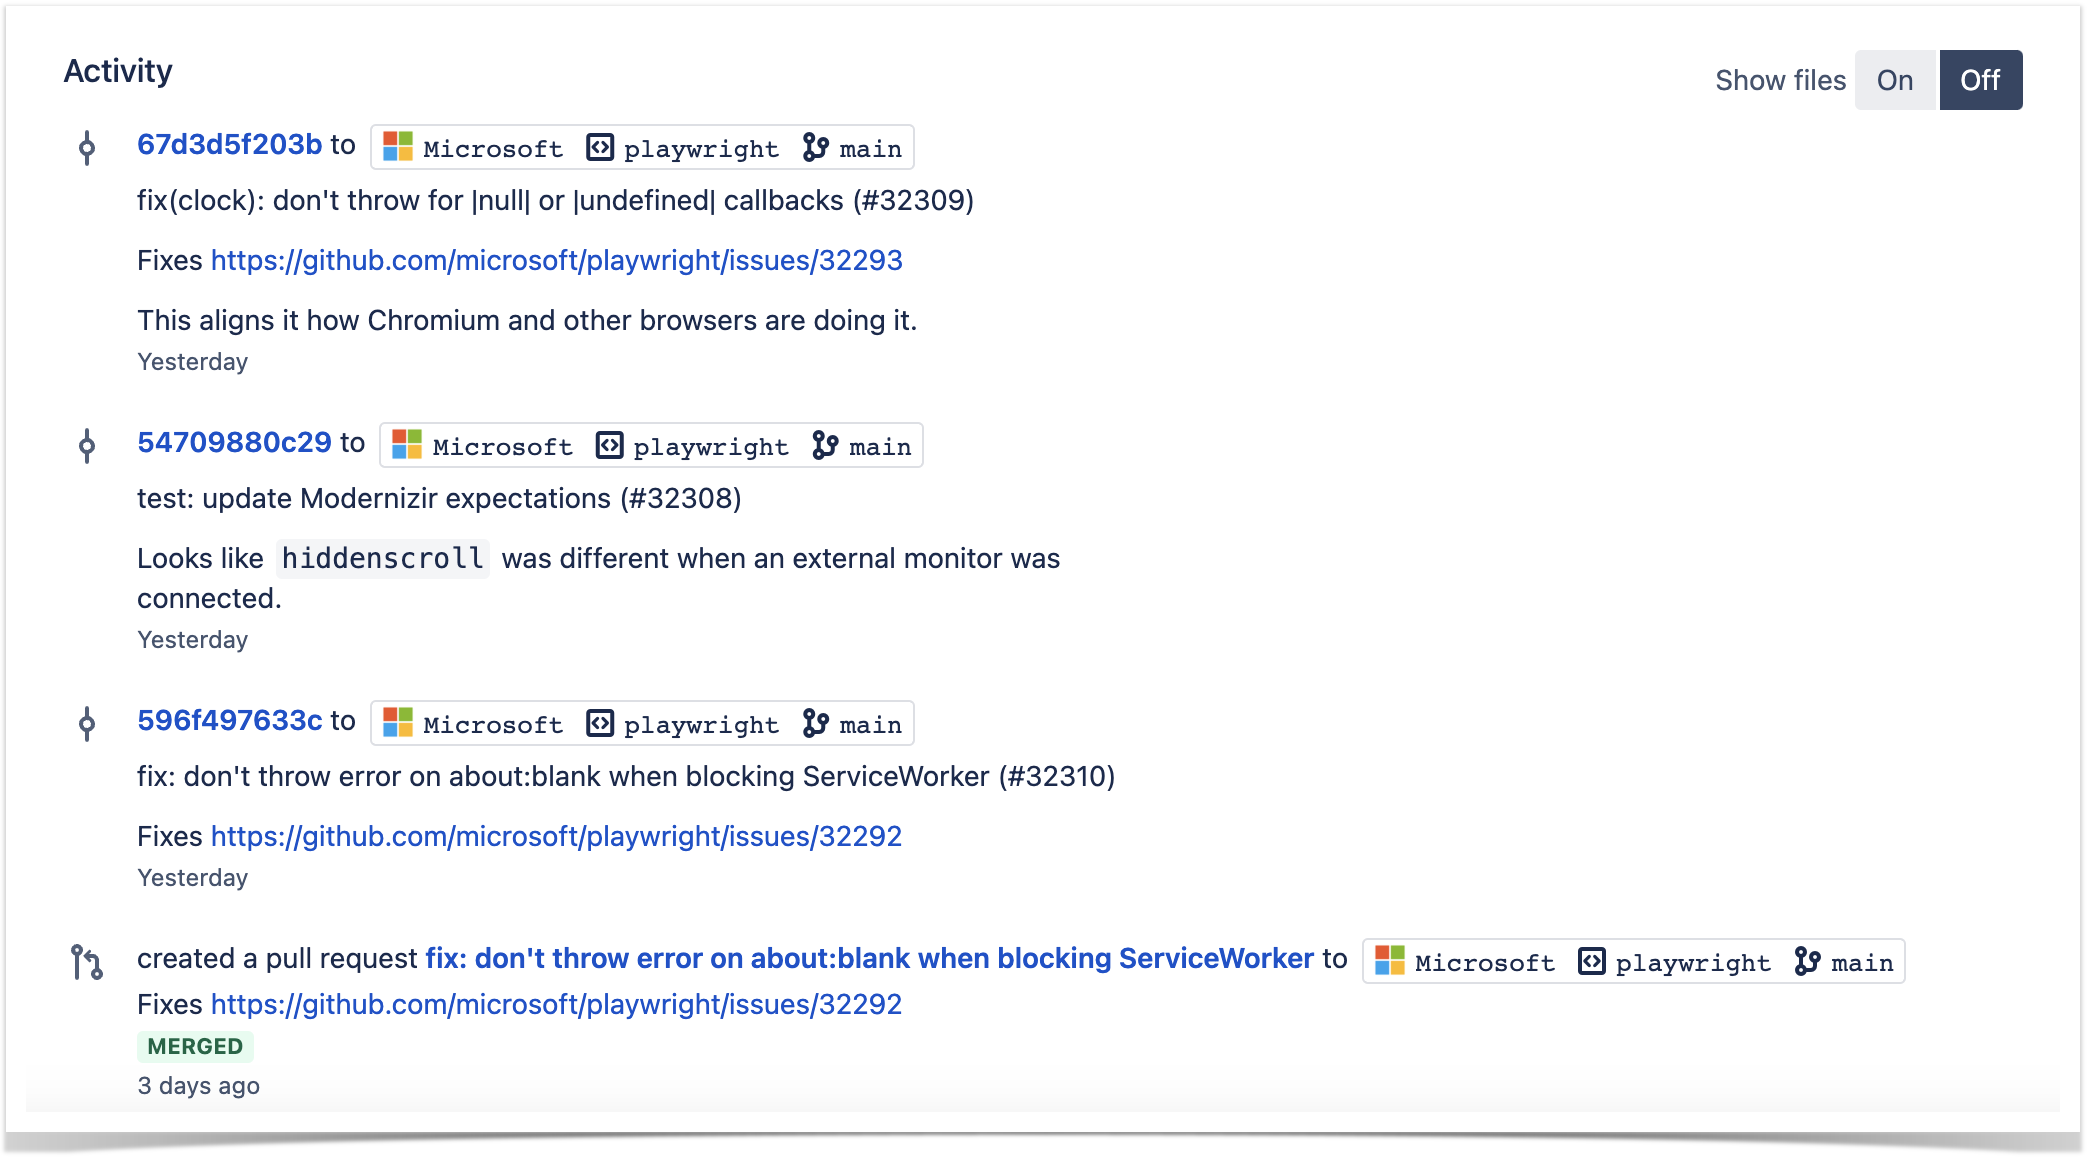
As a commit log, the client uses the activity stream displayed below the Contributions or Activity graphs.
The Contributions tab expands each Bitbucket user’s profile and shows all commits and pull requests made by the user over the past year. So the activity stream under this graph shows all commits and PRs of a particular user, including:
related files
links to the associated Jira issues
commit hashes
change type lozenges
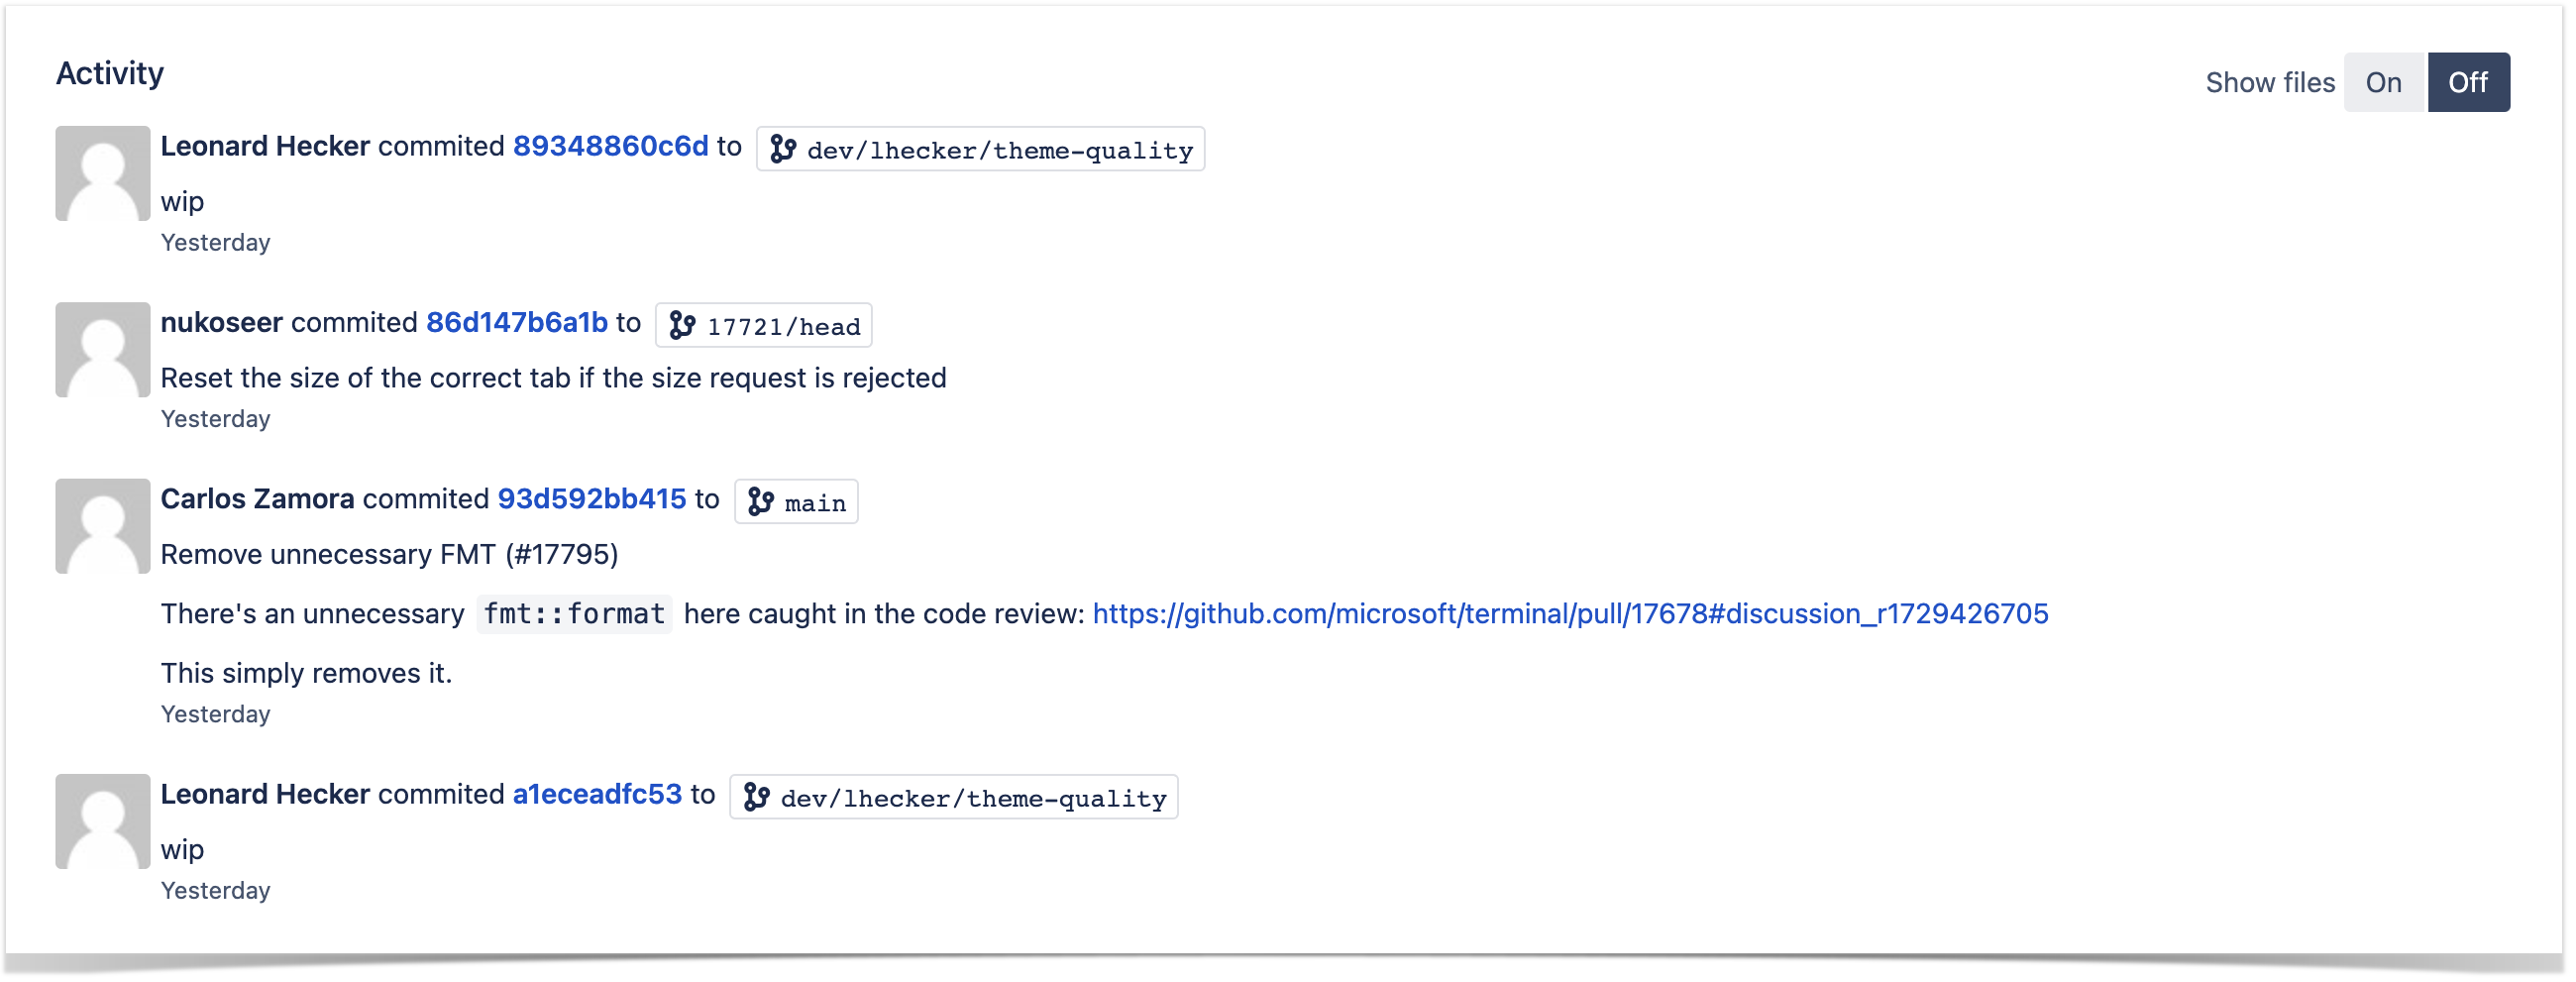
The Activity graph displays recent developers’ contributions to a particular project or repository and is available on the Graphs page on project or repository levels. The activity stream under this graph shows all recent commits and pull requests of a chosen repository or project.
The client mainly uses the activity stream of the Activity graph:
on the project level – to see the commit log across all repositories of the project
on the repository level – to view the list of recent commits across all branches in a particular repository
Commit activity to track developer productivity
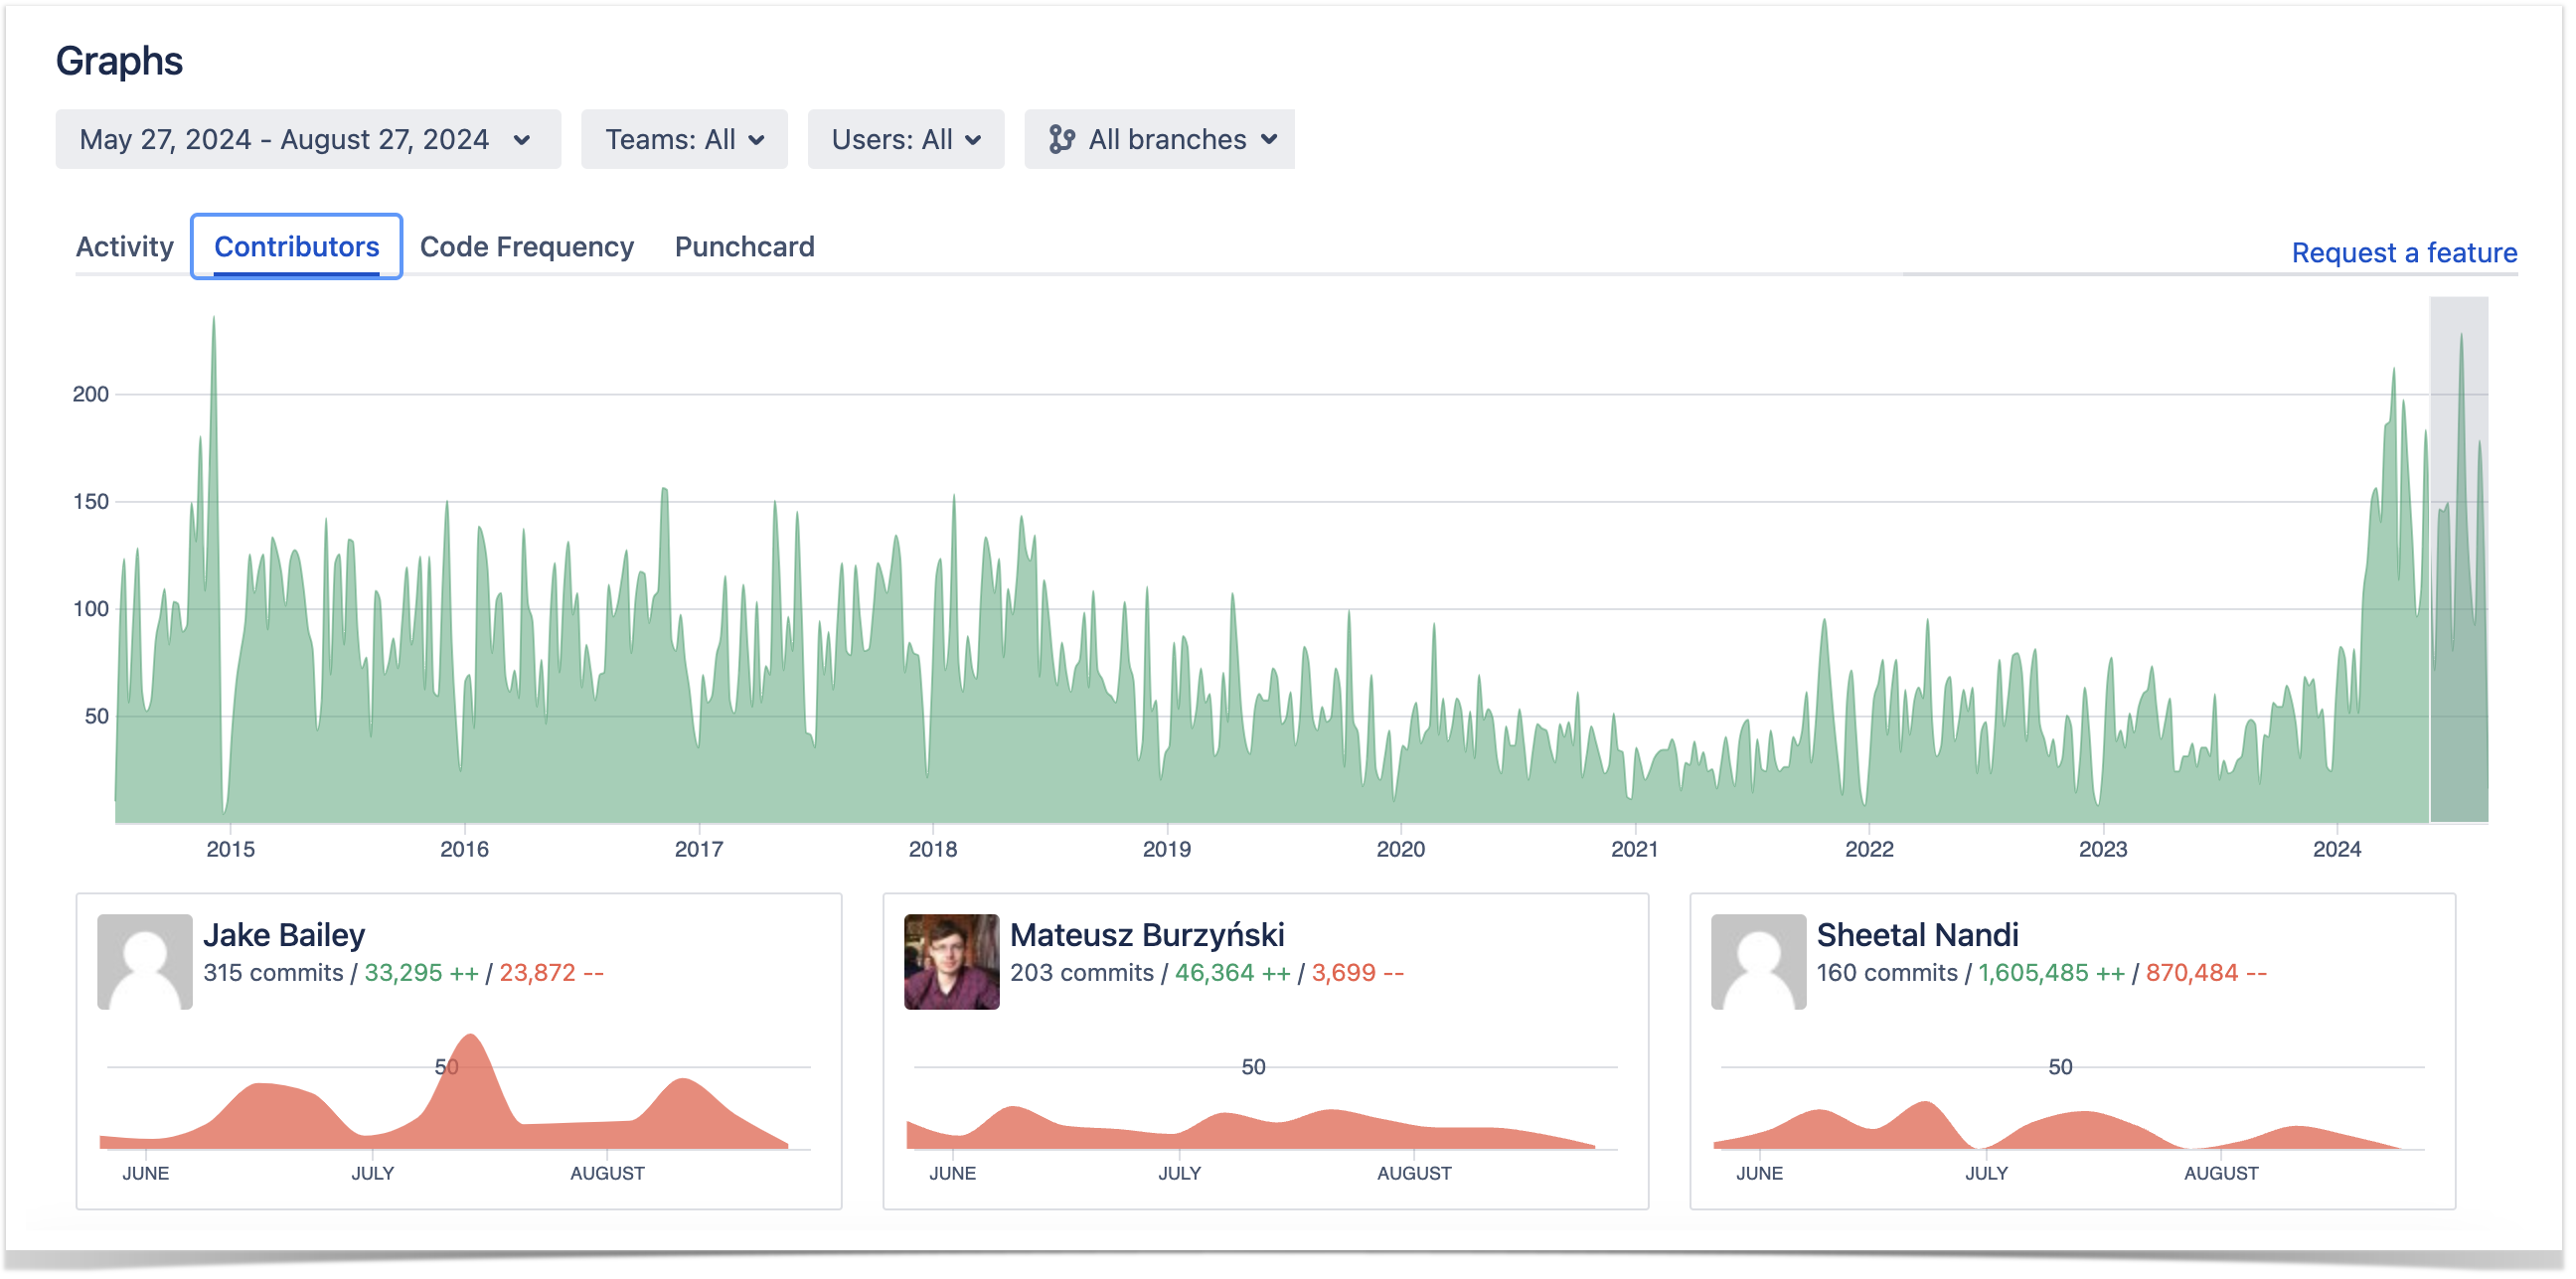
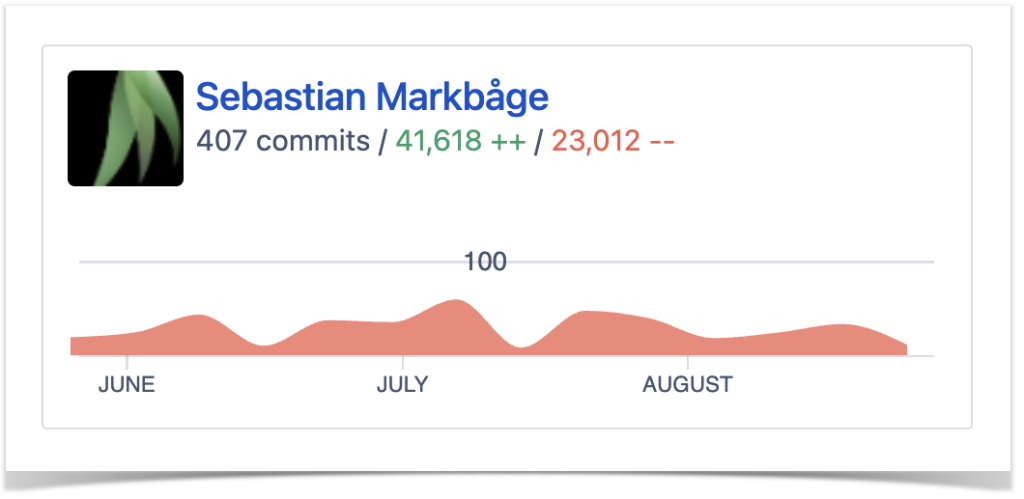
The customer’s team lead finds the Contributors graph especially useful when evaluating the team’s performance. The chart consists of two parts:
summary graph built based on the total number of commits made in a repository or project over a certain period
personal graphs of each contributor to a repository or project.
On the project level, the Contributors graph is typically used to review trends regarding each team member’s number of commits. The repository selection drop-down menu allows the team lead to drill down into details and focus on the statistics of a particular project’s repository.
With the help of individual graphs, the team lead tracks developer productivity in Bitbucket and gains the following insights:
identifies periods when a contributor was most active
spots the developers with the highest number of contributions as the most active contributors listed at the top
reviews the number of commits and lines of code (added and deleted) made by a specific contributor over the selected time frame.
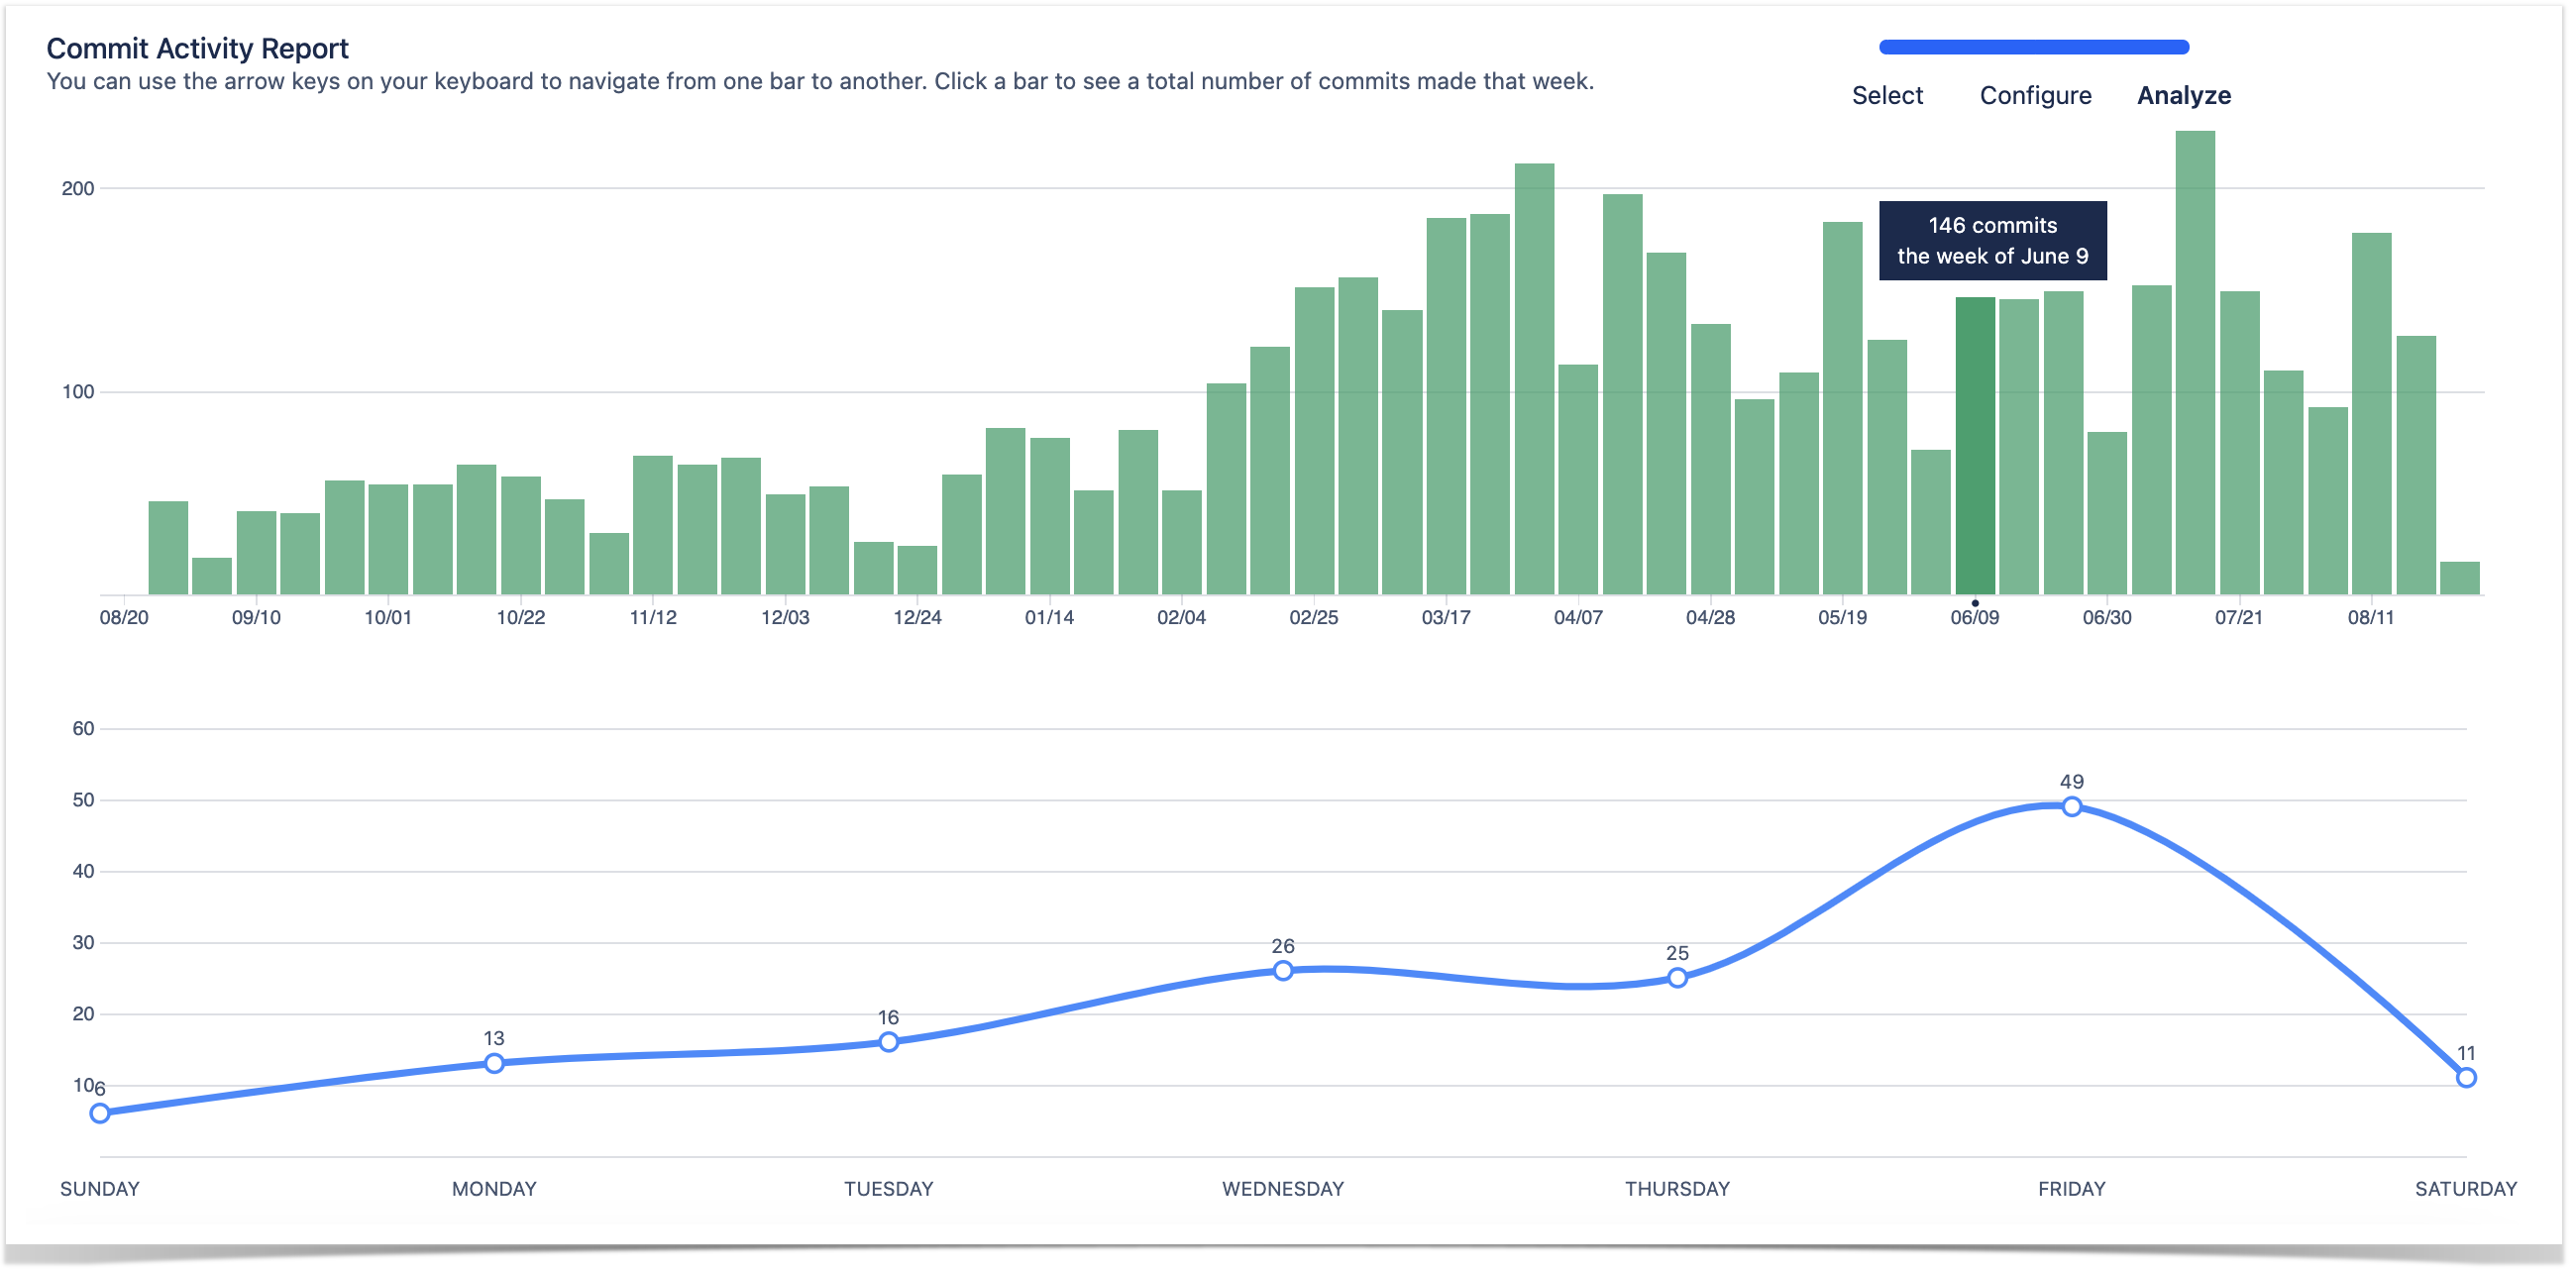
Weekly commit frequency
Moreover, the customer monitors the development flow using the Commit Activity Report. It shows:
bar chart with the number of commits made over the last year grouped by week
scatter chart with detailed daily commit statistics of the selected week
The team reviews the commit frequency using this report every week. In short, if the number of commits is off, they investigate what happened and how it can be normalized.
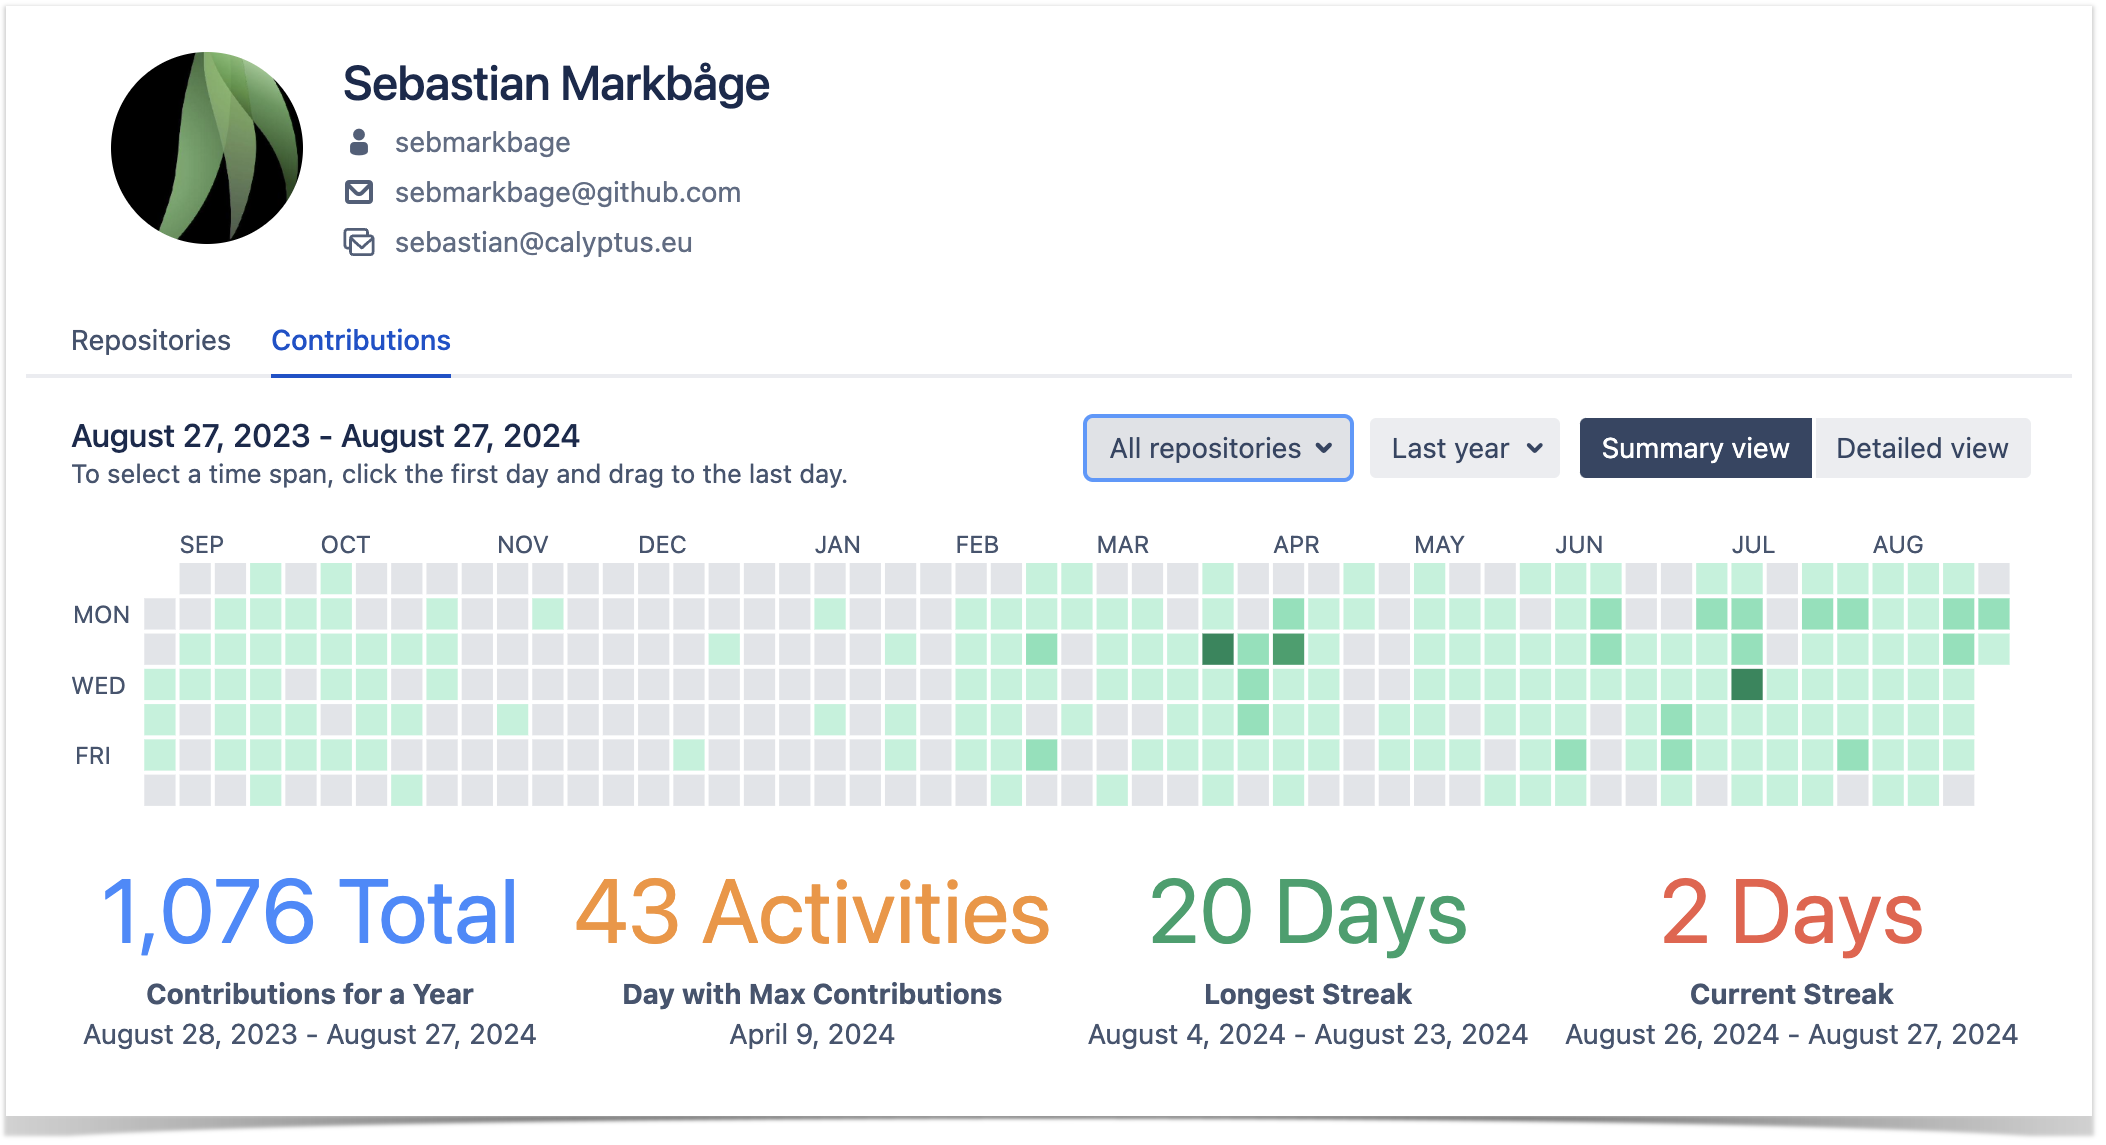
Contributor calendar to monitor individual activities in Bitbucket
From time to time the team lead needs to get a summary of each team member’s contribution activity. For that reason, they use the Contributions tab in the Bitbucket user’s profile.
The calendar visualizes the number of contributions (commits and pull requests) a user made daily during the past year in all repositories. They choose the time span they need to analyze and examine the Contributor calendar to see:
days when a user was most active based on the number of commits and pull requests
how many contributions a user made on a particular day
details about the user’s commits and pull requests in the activity stream located below the calendar
When analyzing the past year’s results, they also look at the statistics below the calendar. These include the total number of contributions for the last year, the day with the maximum number of contributions, and the current and the longest strikes.
Conclusion
With the Awesome Graphs for Bitbucket app, our client is getting the contribution statistics data in a summarized and visual form that is easy to analyze and use for decision-making.
Moreover, this solution helps the team stay on track, discover bottlenecks as soon as they arise, and improve work processes based on the insights gained from studying graphs at retrospective.
Check out our other articles to see how you can benefit from using Awesome Graphs for Bitbucket in your work:
How to Export Commit and Pull Request Data from Bitbucket to CSV
June 18, 2024
#How To#Bitbucket#Reporting
13 min
Being a universal file type, CSV serves as a go-to format for integrations between the applications. It allows for transferring a large amount of data across the systems, blending it, and building custom reports. To export commit and pull request data from Bitbucket Data Center to a CSV file, you can use the Awesome Graphs for Bitbucket app.
In this article, we’ll show you two ways how to use the app to export engineering data to CSV for further integration, organization, and processing in analytics tools and custom solutions.
What commit and pull request data you will get
The methods described later in the article will give you two kinds of generated CSV files, depending on whether you export data about commits or PRs.
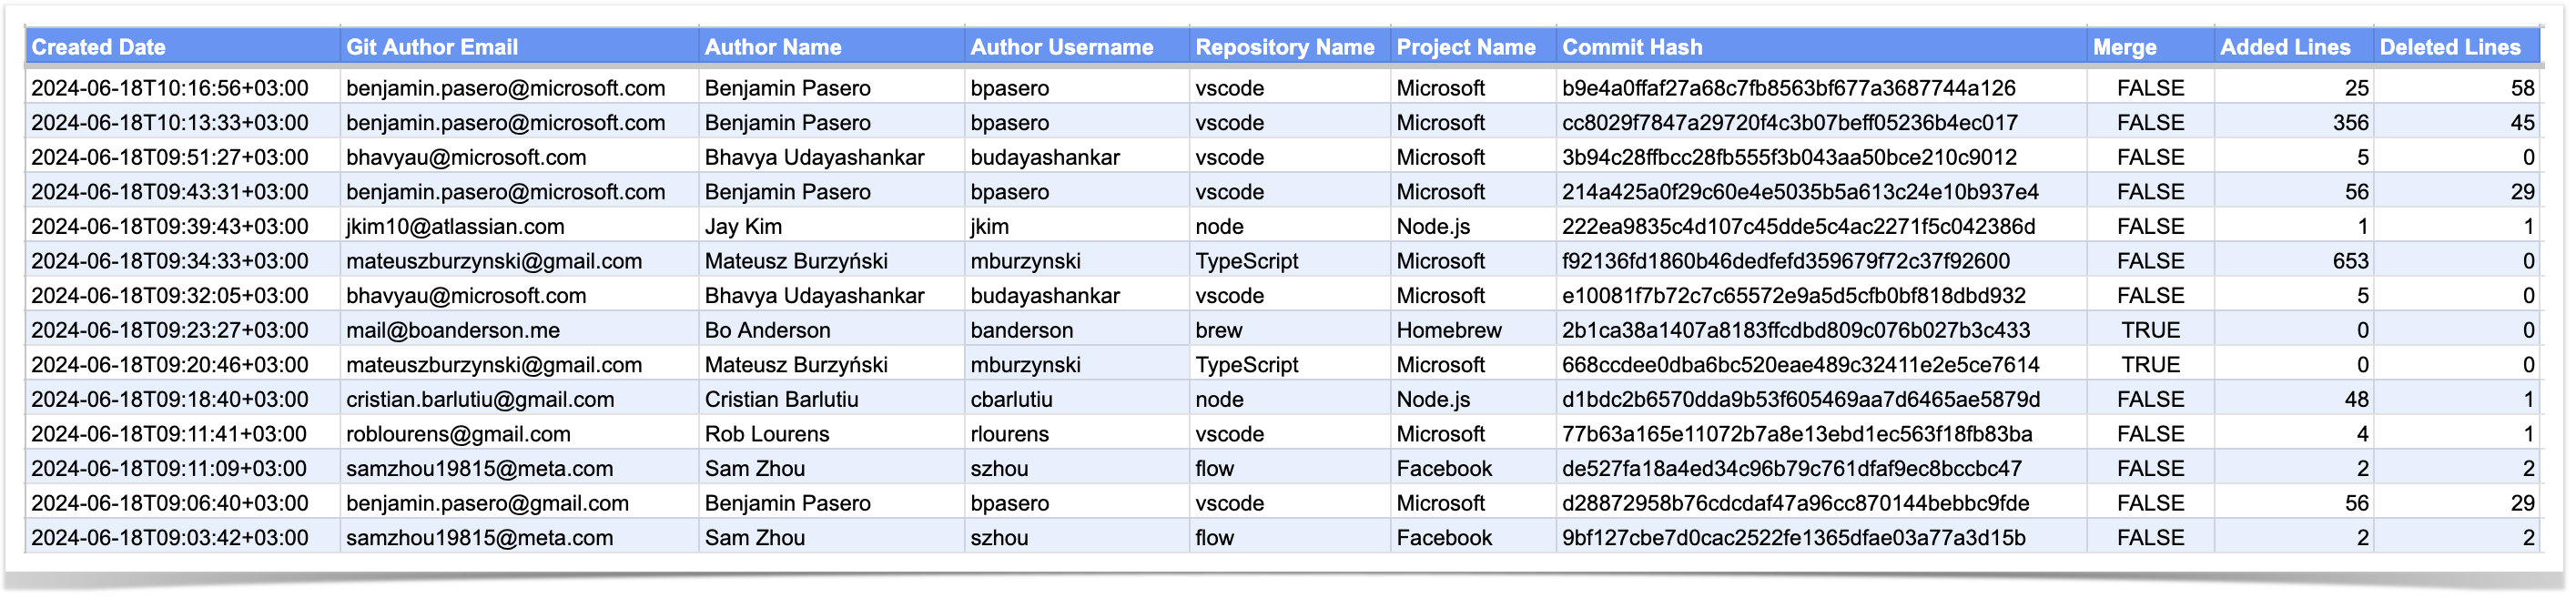
In the case of commit data, you’ll get a list of commits with the following details:
creation date
author’s email, name, and username
repository and project name
commit hash
whether it is a merge commit or not
number of lines of code added and deleted
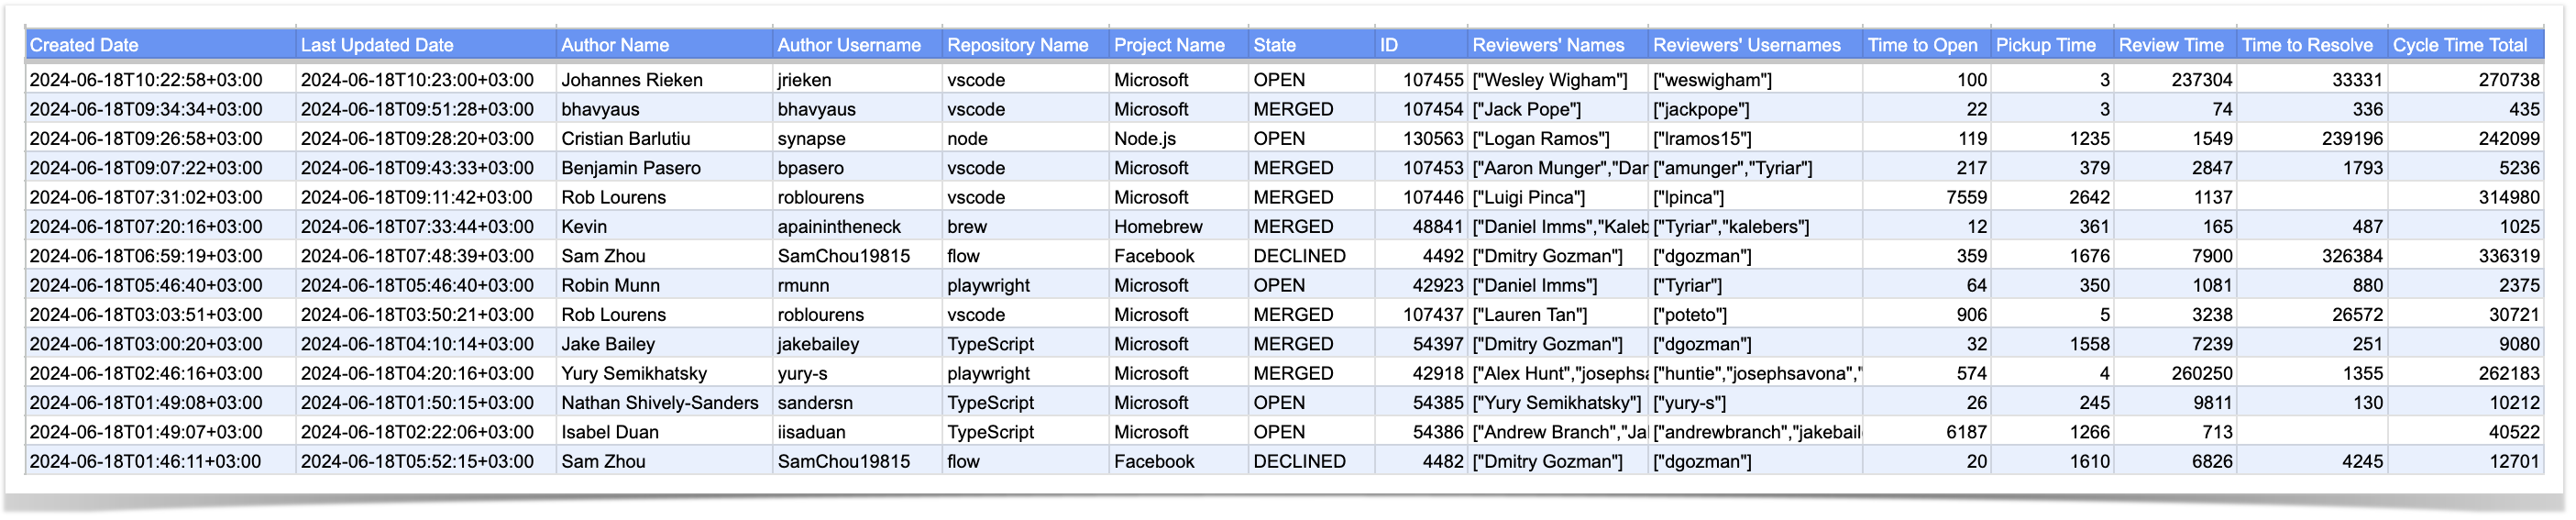
The resulting CSV with a list of pull requests will contain the following information:
pull request creation and last updated date
author’s name and username
repository and project name
PR state and its ID
reviewers’ names and usernames
PR cycle time and its phases: time to open, pickup time, review time, time to resolve
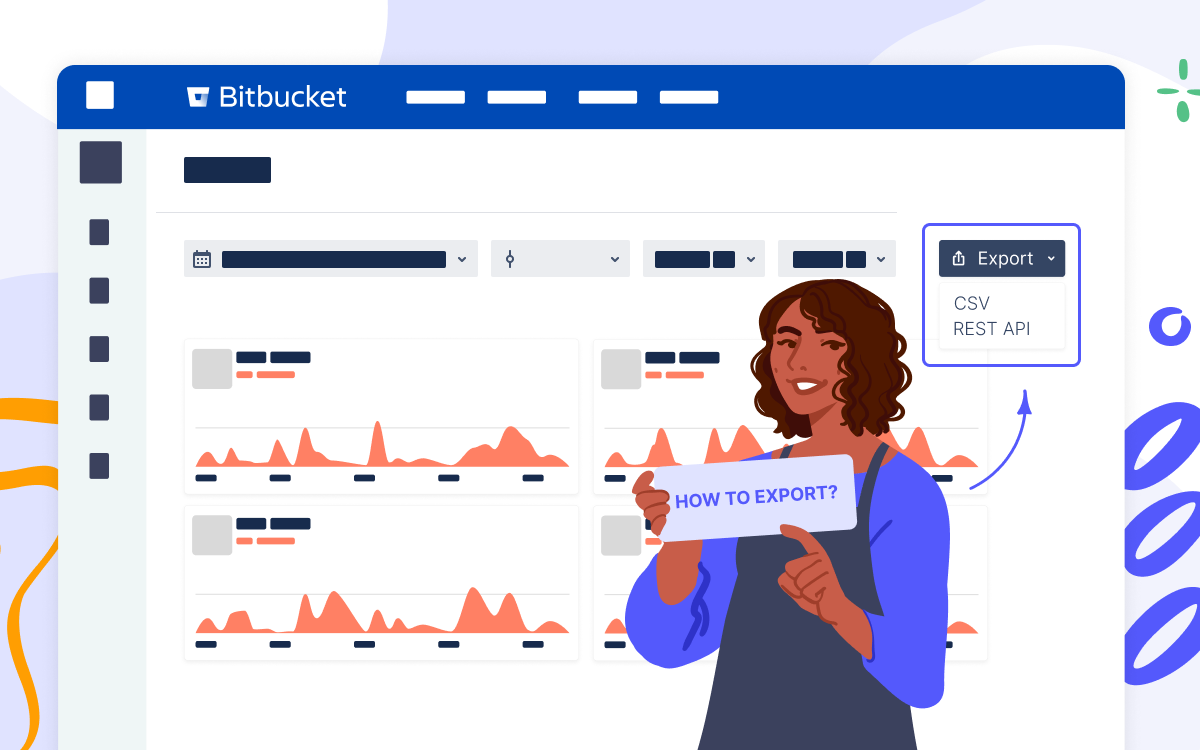
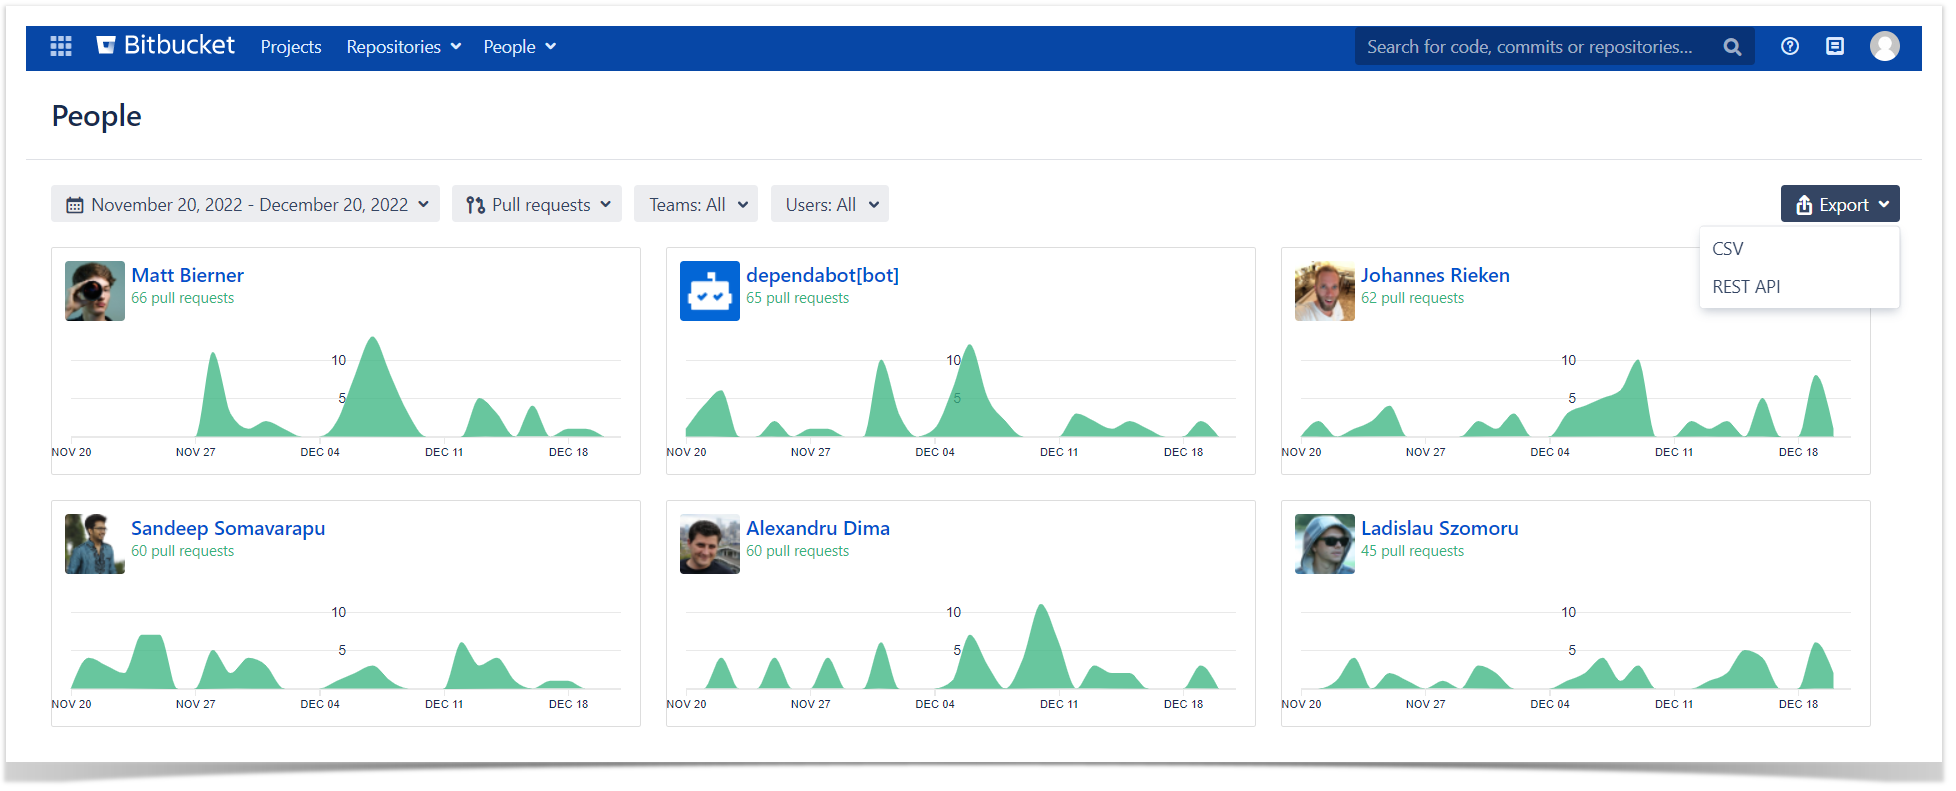
Exporting from the People page
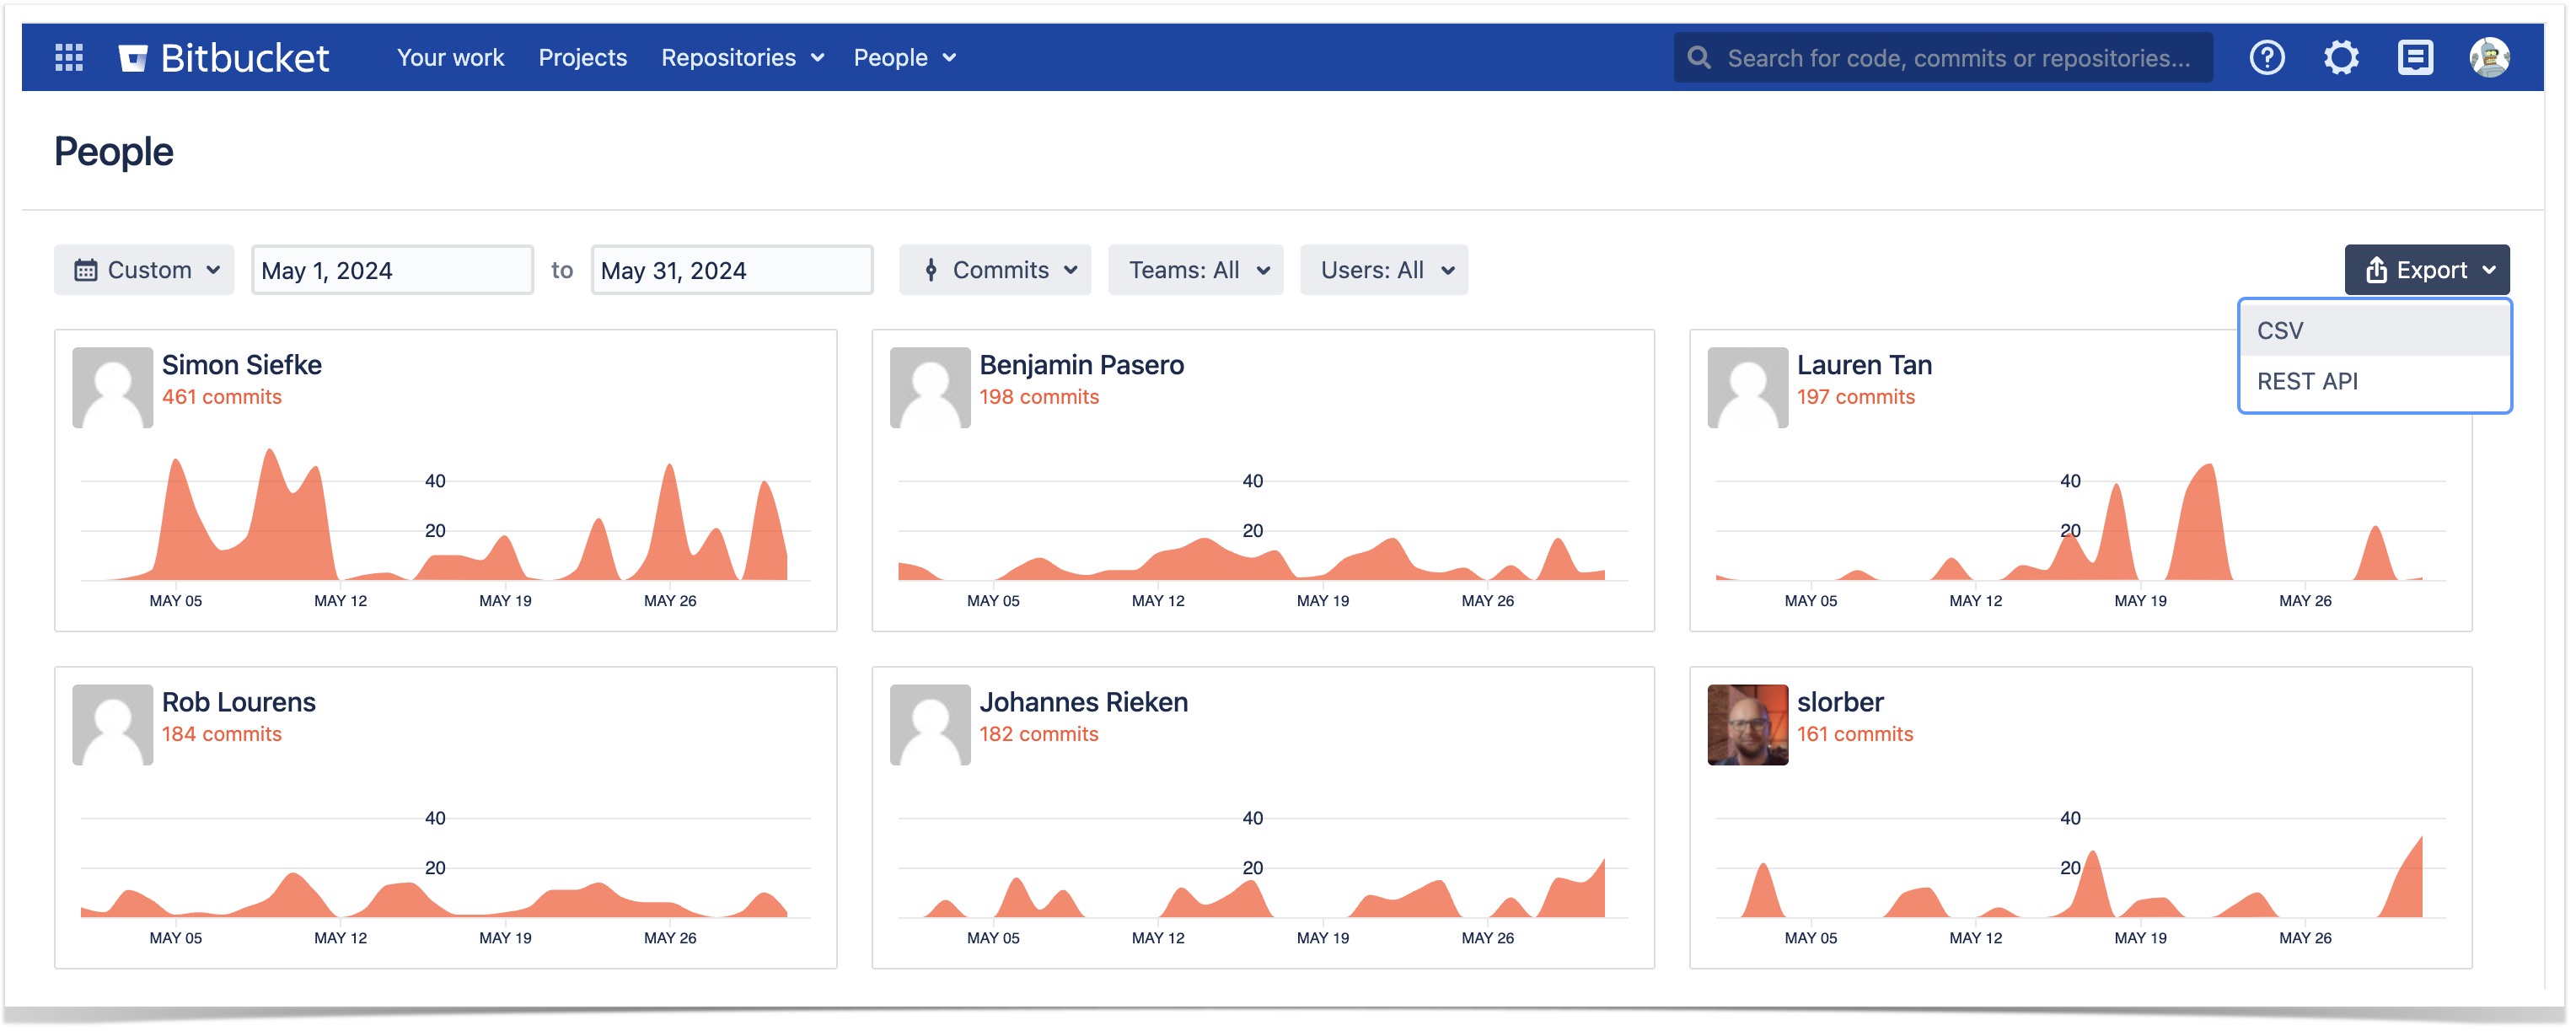
You can export raw commit and pull request data to CSV directly from Bitbucket. When you click All users in the People dropdown menu at the header, you’ll get to the People page with a global overview of developers’ activity based on the number of commits or pull requests.
At the top-right corner, you’ll notice the Export menu, where you can choose CSV.
By default, the page shows developers’ contributions made within a month, but you can choose a longer period up to a quarter. The filtering applies not only to the GUI but also to the data exported, so if you don’t change the timespan, you’ll get a list of commits or pull requests for the last 30 days.
Exporting via the REST API resources
Awesome Graphs REST API allows you to retrieve and export commit and pull request data to a CSV file on global, project, repository, and user levels. This functionality is aimed to automate the processes you used to handle manually and streamline the existing workflows.
To find the REST API resources, you can go to the in-app documentation by choosing Export → REST API on the People page (accessible to Awesome Graphs’ users), or to our documentation website.
In-app documentation
REST API page at the documentation website
In the article, we’ll show you two examples of the resources and how they work: one for exporting commits and another for pull requests. The rest of the resources follow the same model, so you can apply these principles to get the data you need.
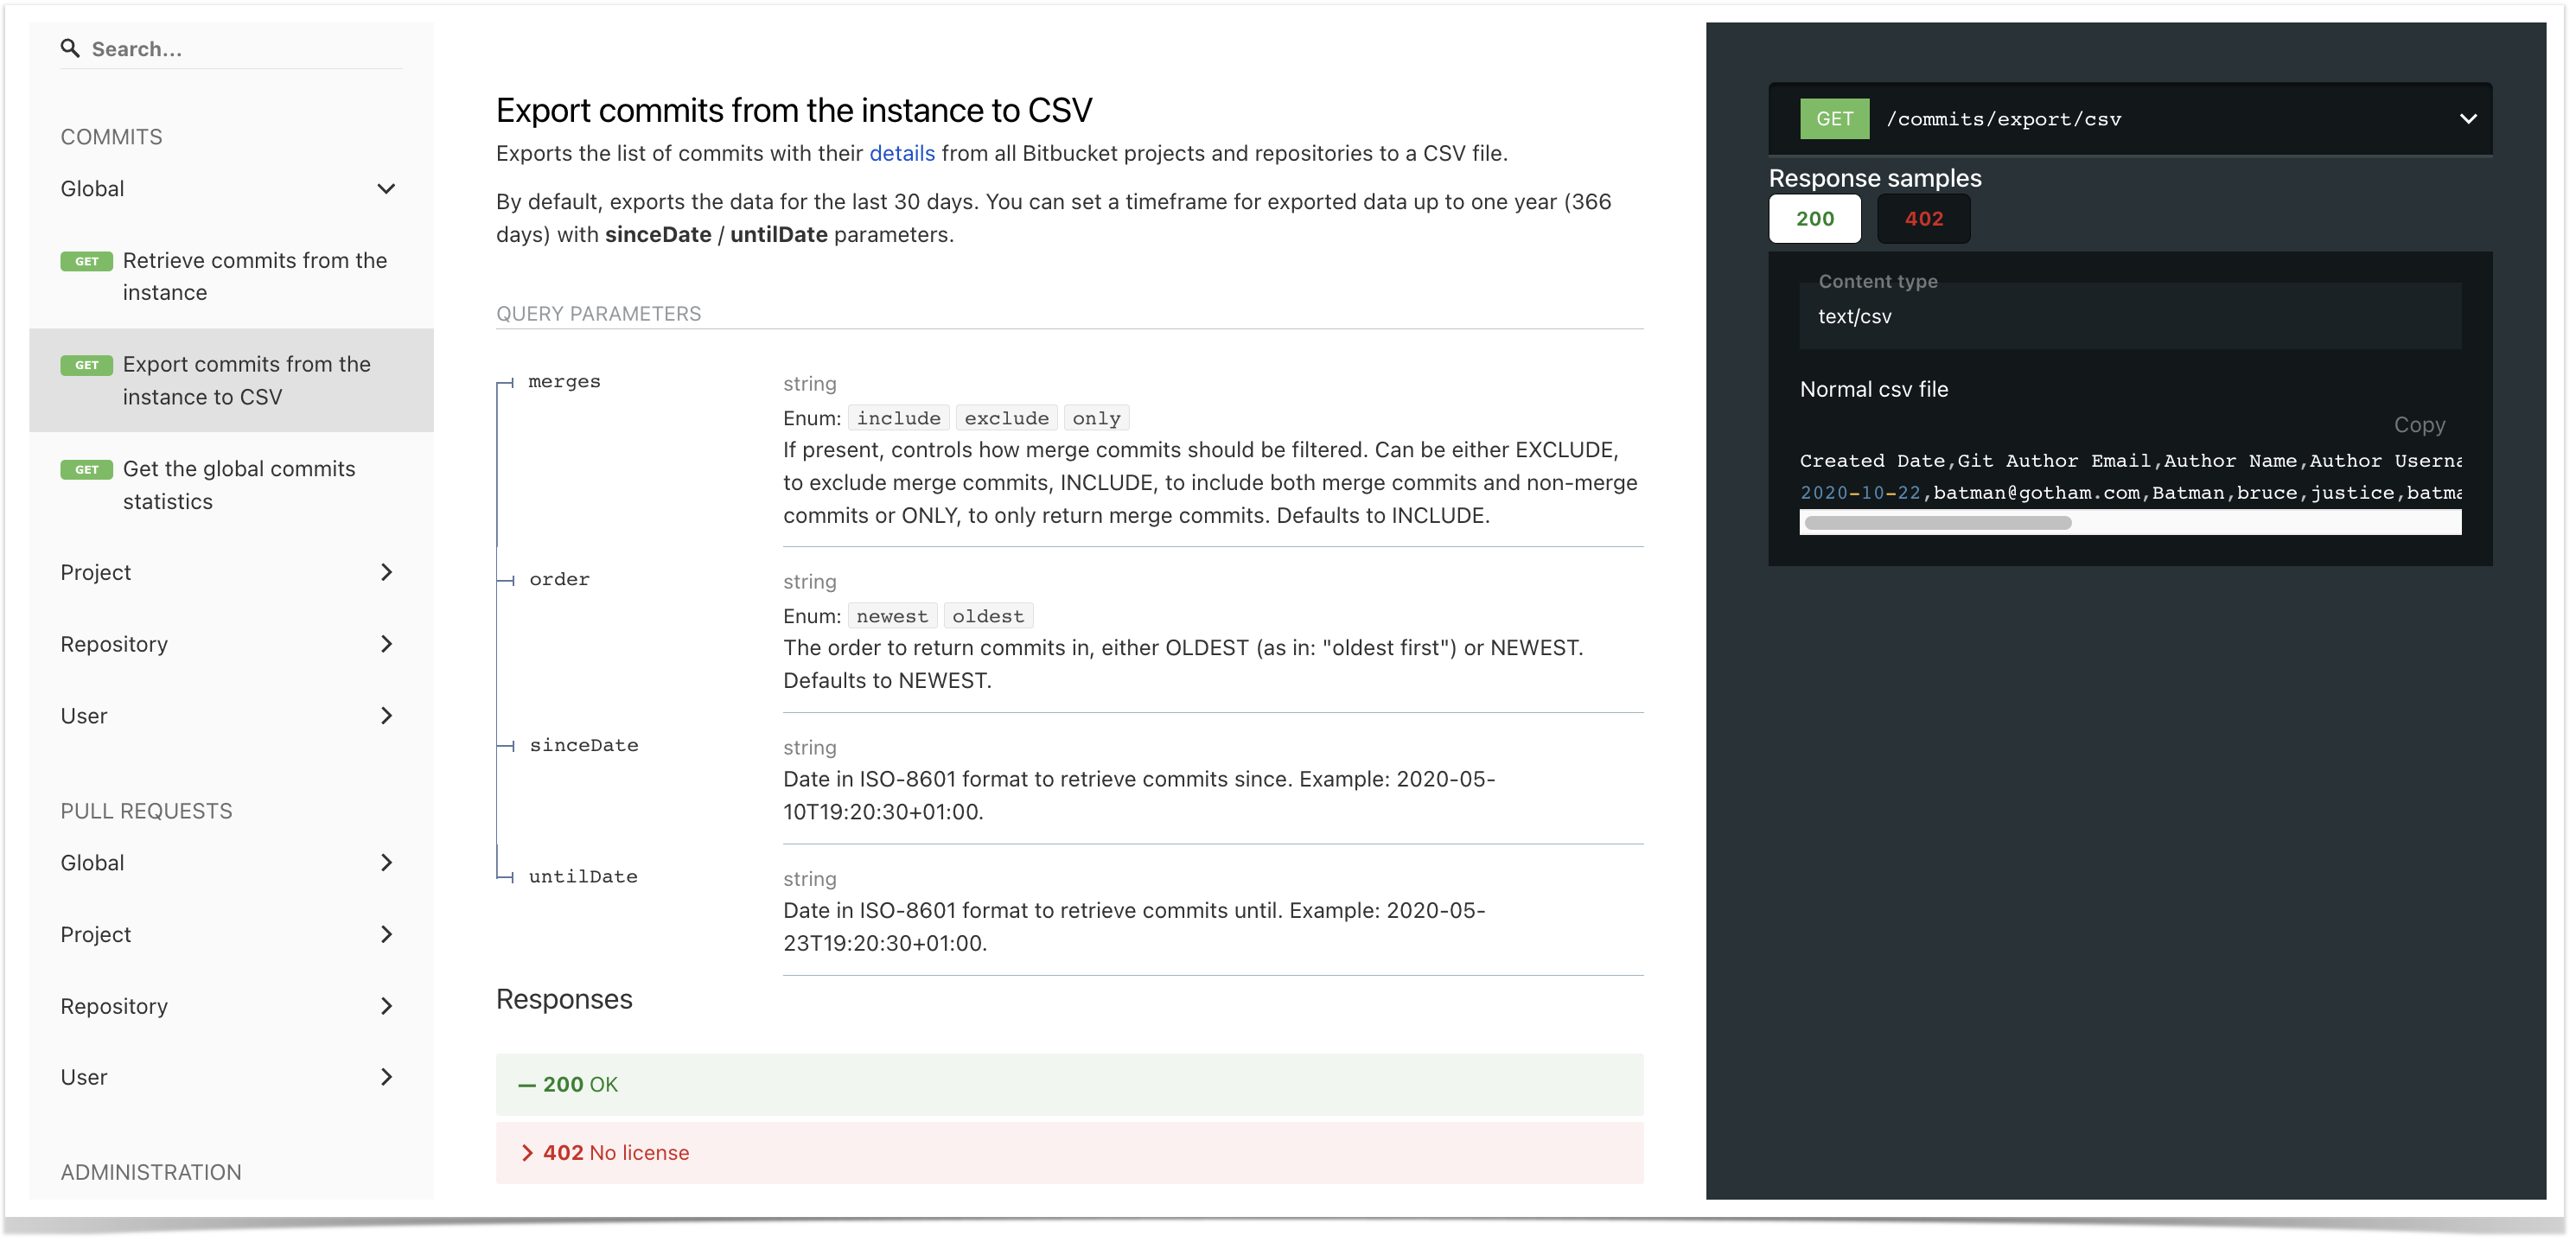
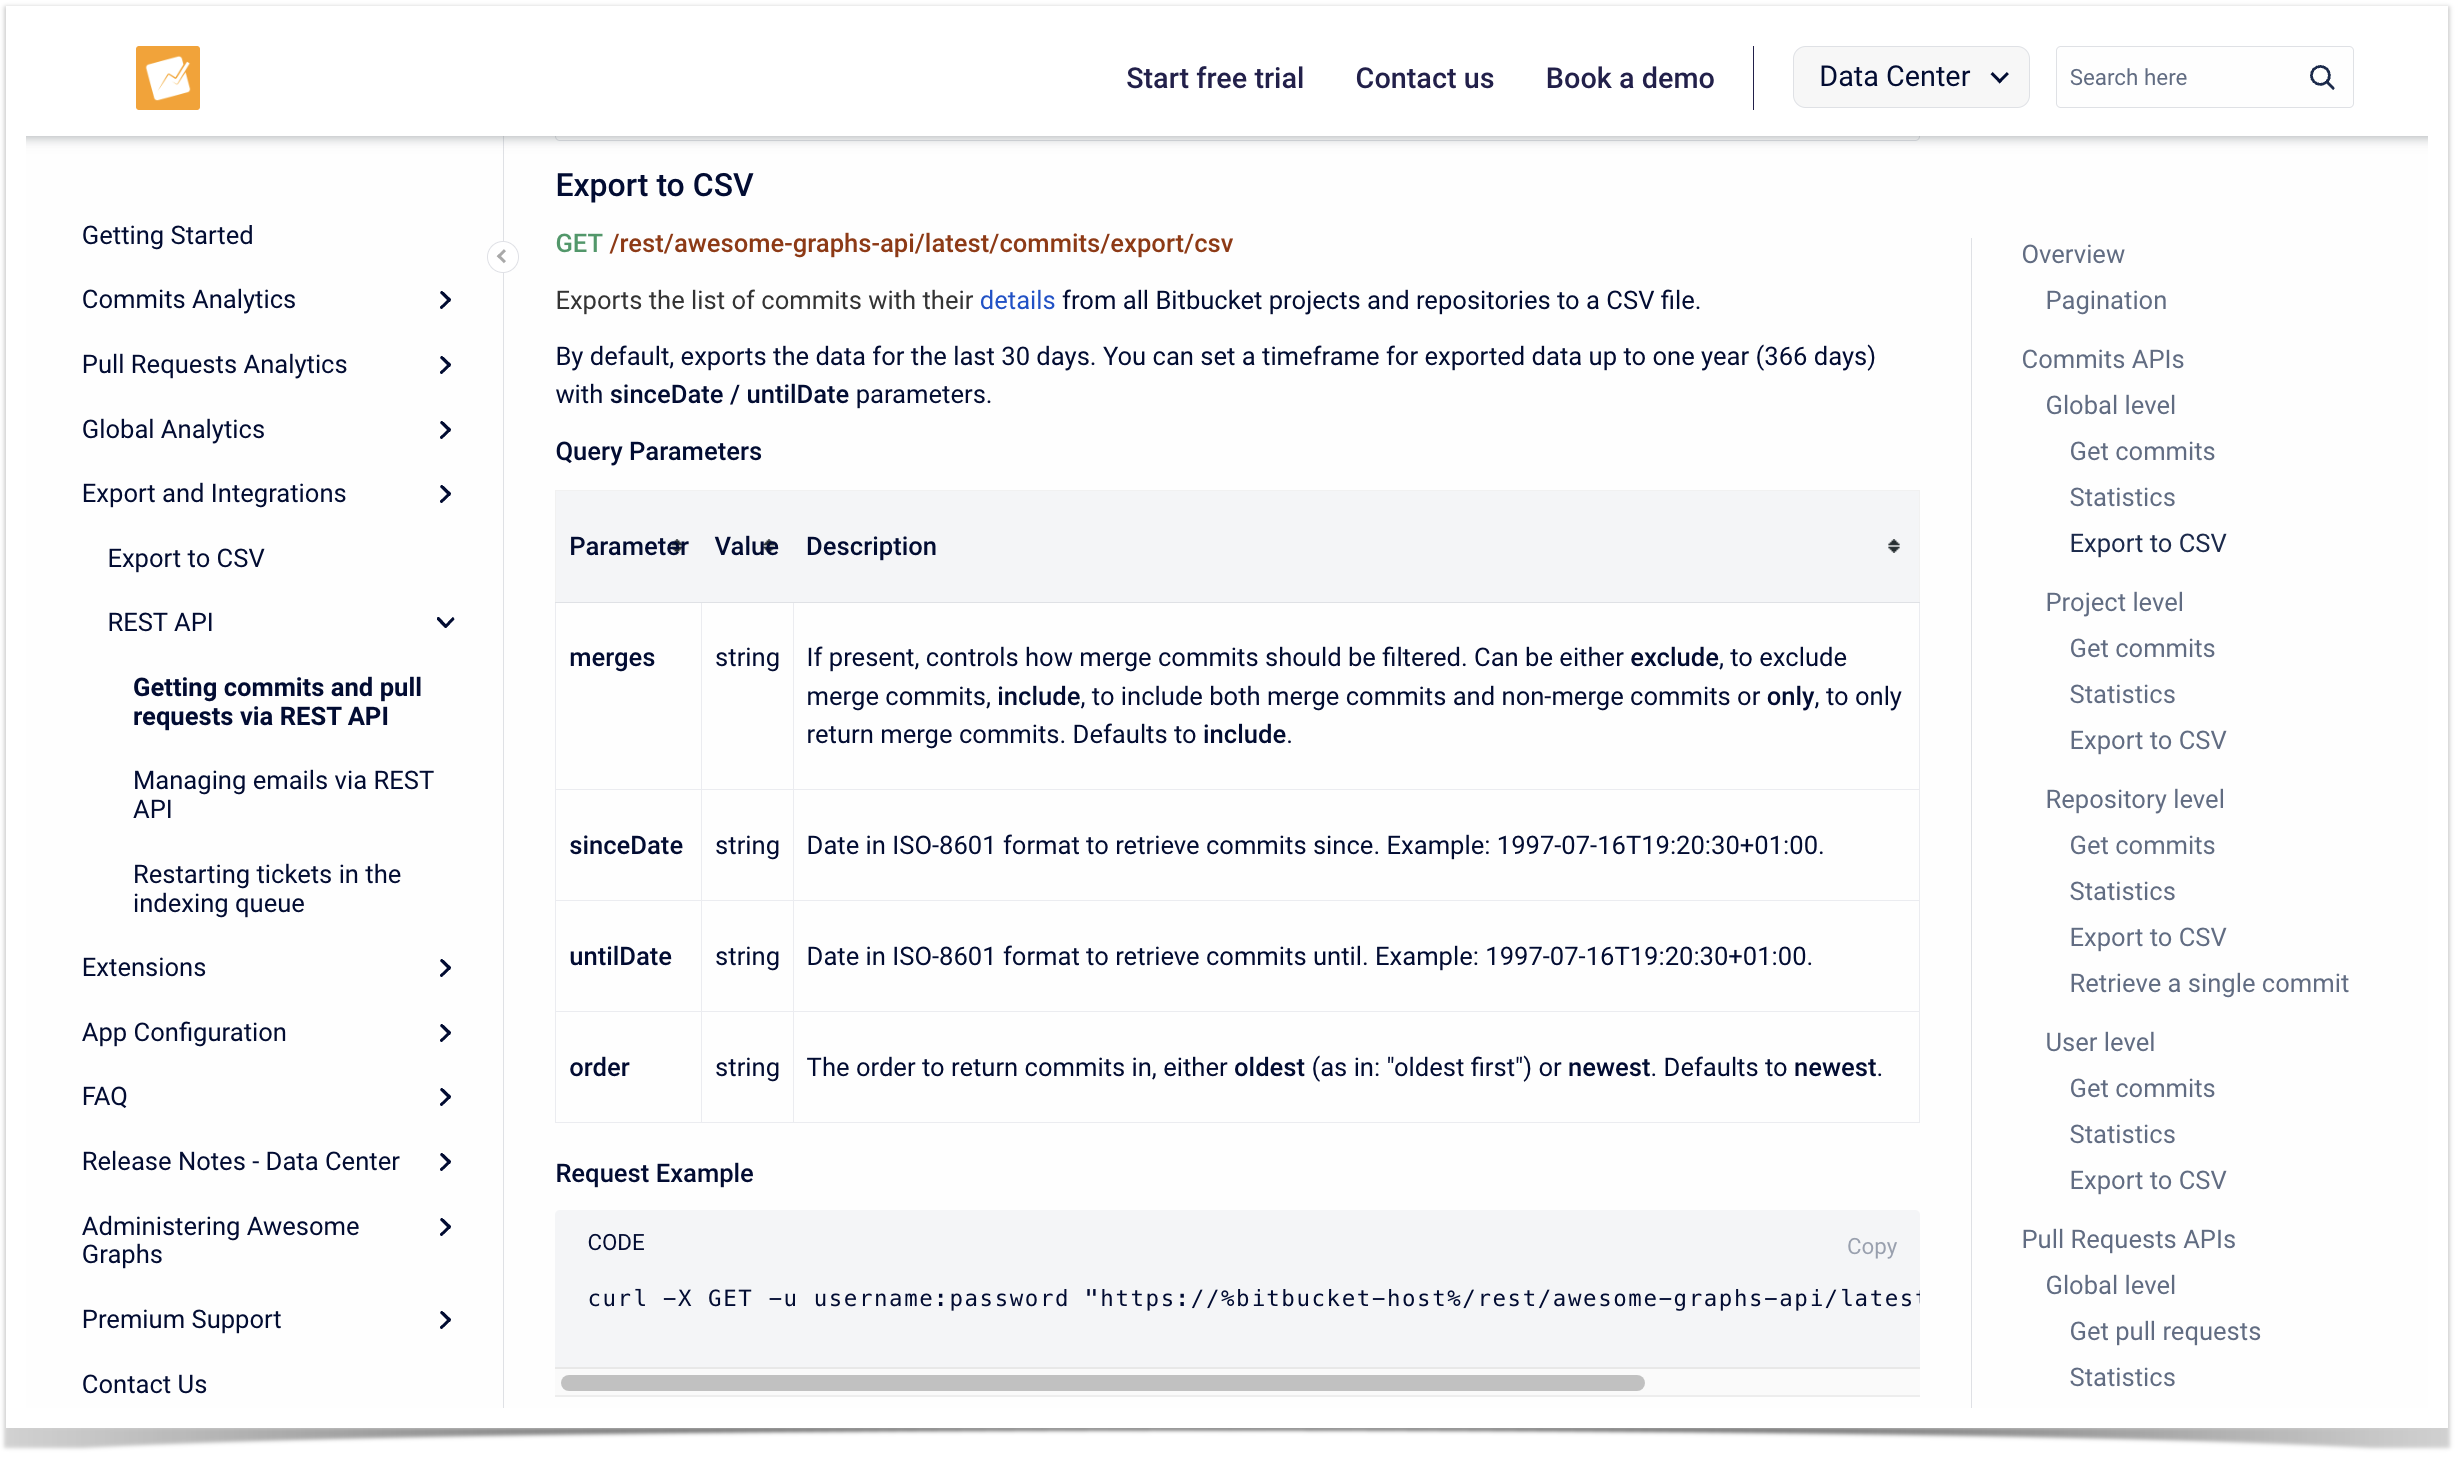
Export commits to CSV
This resource exports a list of commits with their details from all Bitbucket projects and repositories to a CSV file.
Here is the curl request example:
curl -X GET -u username:password "https://bitbucket.your-company-name.com/rest/awesome-graphs-api/latest/commits/export/csv"
Alternatively, you can use any REST API client like Postman or put the URL directly into your browser’s address bar (you need to be authenticated in Bitbucket in this browser), and you’ll get a generated CSV file.
By default, it exports the data for the last 30 days. However, you can set a timeframe for exported data up to one year (366 days) with sinceDate / untilDate parameters:
curl -X GET -u username:password "https://bitbucket.your-company-name.com/rest/awesome-graphs-api/latest/commits/export/csv?sinceDate=2024-05-01&untilDate=2024-05-15"
For commit resources, you can also use the query parameters such as merges to filter merge/non-merge commits or order to specify the order to return commits in.
The pull request resources work similarly, so to export a list of pull requests with their details from all Bitbucket projects and repositories to a CSV file, you need to make the following curl request:
curl -X GET -u username:password "https://bitbucket.your-company-name.com/rest/awesome-graphs-api/latest/pull-requests/export/csv"
The sinceDate / untilDate parameters can also be applied to state the timespan up to a year, but here you have an additional parameter dateType, allowing you to choose either the creation date or the date of the last update as a filtering criterion. So, if you set dateType to created, only the pull requests created during the stated period will be returned, while dateType set to updated will include the pull requests that were updated within the time frame.
Another pull request specific parameter is state, which allows you to filter the response to only include open, merged, or declined pull requests.
For example, the following request will return a list of open pull requests, which were updated between May 1st and May 15th:
curl -X GET -u username:password "https://bitbucket.your-company-name.com/rest/awesome-graphs-api/latest/commits/export/csv?dateType=updated&state=open&sinceDate=2024-05-01&untilDate=2024-05-15"
Refer to our documentation for more details about this resource and its parameters. Additionally, you can find information on other resources for exporting pull request data at the project, repository, and user levels.
Integrate intelligently
While CSV is supported by many systems and is quite comfortable to manage, it is not the only way for software integrations the Awesome Graphs for Bitbucket app offers. Using the REST API, you can make data flow between the applications, automate the workflow, and get custom reports tailored to your needs.
For Awesome Graphs Data Center clients, we offer a Premium Support subscription aimed at enhancing efficiency and saving time while working with our app and its REST API resources. It includes personalized assistance from our experts who will create scripts in Python, Bash, Java, or Kotlin to interact with our REST APIs and build reports tailored to your specific requirements. By using these advanced capabilities, our clients optimize their workflows, gain deeper insights into their engineering activities, and drive informed decision-making.
Subscribe for monthly updates on how to get the most out of Atlassian products.
Thank you for signing up
for our newsletter!
You will be the first to know about fresh content, releases,
and special projects.
Stay tuned.
How to Count Lines of Code in Bitbucket to Decide what SonarQube License You Need
April 30, 2024
#Reporting#How To#Bitbucket
12 min
SonarQube is a popular automatic code review tool used to detect bugs and vulnerabilities in the source code through static analysis. While the Community Edition is free and open-source, the Developer, Enterprise, and Data Center editions are priced per instance per year and based on the number of lines of code (LOC). So if you are considering buying a license for SonarQube, you need to count lines of code in Bitbucket for all projects and repositories you want to analyze.
In this post, we’ll show how you can count LOC for your Bitbucket Data Center instance, as well as for each project or repository using the Awesome Graphs’ REST API resources and Python.
Awesome Graphs for Bitbucket is a data-providing and reporting tool that allows you to export commits, lines of code, and pull requests statistics on global, project, repository, and user levels. It also offers out-of-the-box graphs and reports to deliver instant answers to your questions.
How to count lines of code for the whole Bitbucket instance
Getting lines of code statistics for the whole Bitbucket instance is pretty straightforward and will only require making one call to the Awesome Graphs’ REST API. Here is an example of the curl command:
curl -X GET -u username:password "https://bitbucket.your-company-name.com/rest/awesome-graphs-api/latest/commits/statistics"
It returns the number of lines added and deleted as well as the total number of commits in all Bitbucket projects and repositories. To get the total LOC, you’ll simply need to subtract the number of deleted from the added.
Please note that blank lines are also counted in lines of code statistics in this and the following cases.
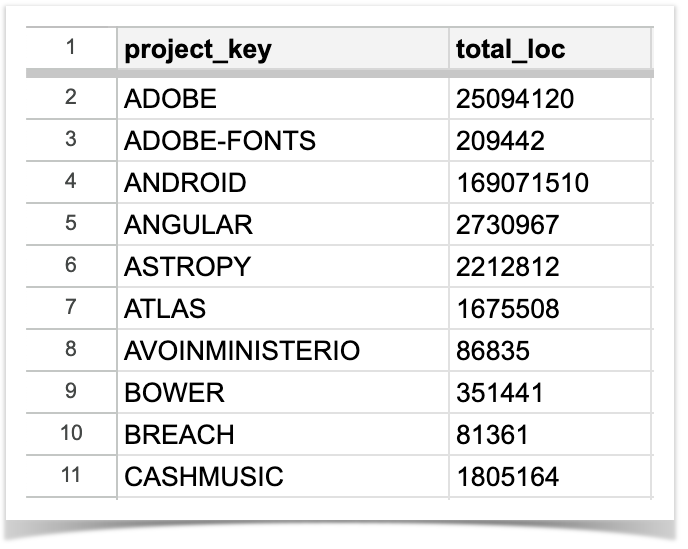
How to count lines of code for each project in the instance
You can also use the REST API resource to get the LOC for a particular project, but doing this for each project in your Bitbucket instance will definitely take a while. That’s why we are going to automate this process with a simple Python script that will run through all of your projects, count the total LOC for each one, and then will save the list of project keys with their total LOC to a CSV file.
To make this script work, you’ll need to install the requests in advance, the csv and sys modules are available in Python out of the box. You need to pass three arguments to the script when executed: the URL of your Bitbucket, login, and password. Here’s an example:
The resulting file will be saved in the same folder as the script after the execution.
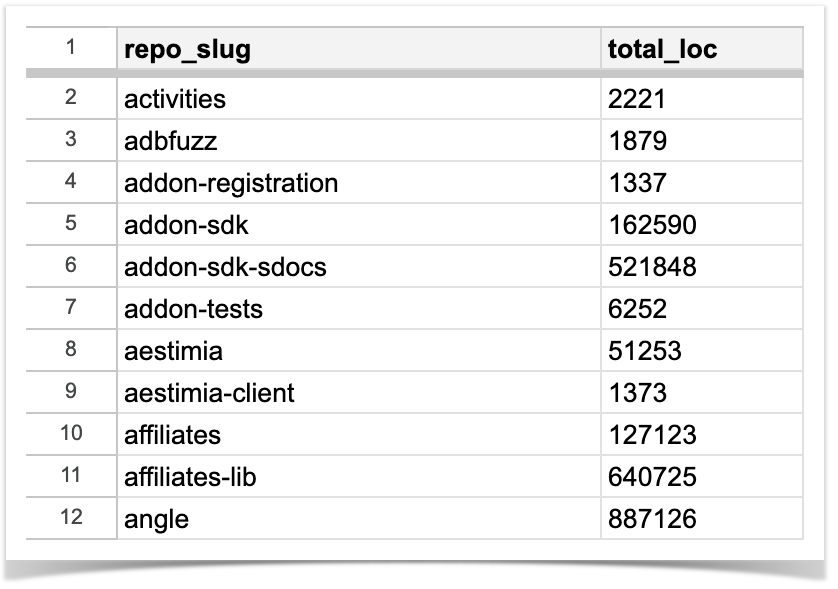
How to get lines of code for each repository in the project
In case you need statistics on a particular repository you can make a single call to the Awesome Graphs’ REST API. If you need to get the total lines of code for each repository in the specified project, a simple Python script will help again. Here, the resulting CSV file will include the list of repo slugs in the specified project and their LOC totals:
Once the execution is finished, the resulting file will be saved in the same folder as the script.
Want to learn more?
We should note that the total LOC we get in each case shows the number of lines added minus lines deleted for all branches. Due to these peculiarities, some repos may have negative LOC numbers, so it might be useful to look at the LOC for a default branch and compare it to the LOC for all branches.
If you would like to learn how to get this information with the help of Awesome Graphs for Bitbucket, write here in the comments or create a request in our Help Center, and we’ll assist you.
If you also looking to search for commits in Bitbucket, our blog post suggests three different ways to do this.
Subscribe for monthly updates on how to get the most out of Atlassian products.
Thank you for signing up
for our newsletter!
You will be the first to know about fresh content, releases,
and special projects.
Stay tuned.
In this article, we will spill the beans and share how our team conducts code review in Bitbucket to ensure smooth feature delivery and mitigate risks.
At Stiltsoft, we have several development teams dedicated to creating apps that enhance the functionality of Atlassian products. Our development team consists of 4 full-stack engineers with accumulated software development experience of over 30 years and focuses on several apps for Jira and Bitbucket. One of them is Awesome Graphs for Bitbucket, which is used by over 1,600 companies, including Apple, Oracle, and Mastercard.
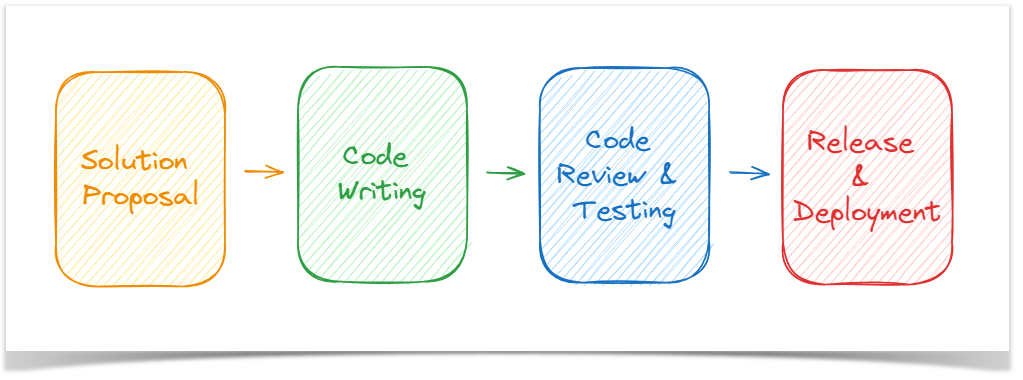
The illustration of the code review process and its main principles would only be complete by delving into the software development workflow. In our team, this process is structured around the following key milestones:
Solution Proposal
Code writing
Code review and Testing
Release and Deployment
Let’s look closer at the first three stages and their peculiarities.
Solution Proposal
Before making significant changes to the code, we prepare a Solution Proposal to outline the planned changes and their implementation to our teammates. Significant changes include:
adding a completely new feature
making substantial changes to UI or changes that impact many files
changing backend components
integrating new tools.
Our solution proposal consists of 4 main parts:
Motivation – Why did we decide to work on this issue?
Context of the problem – What is happening now?
Suggested Solution – How exactly are we going to implement this?
Consequences – What changes will this solution entail?
This is extremely useful, particularly for newcomers who could spend a lot of time implementing a solution that either does not meet our internal standards or could be achieved much easier and faster as we have already resolved such issues. Apart from this, it helps the whole team to:
validate the solution with colleagues and avoid “tunnel vision” or reinventing the wheel
discuss the implementation of complex issues that are not entirely clear how to solve
facilitate the later code review process as teammates are already familiar with the proposed solution
check if the suggested solution adheres to the business requirements.
When the Solution Proposal is ready, the author shares it with the product and development teams and organizes a call in Slack to discuss questions if necessary. These documents are stored in the Confluence product space, ensuring that our team or colleagues can access them whenever needed.
Code Writing
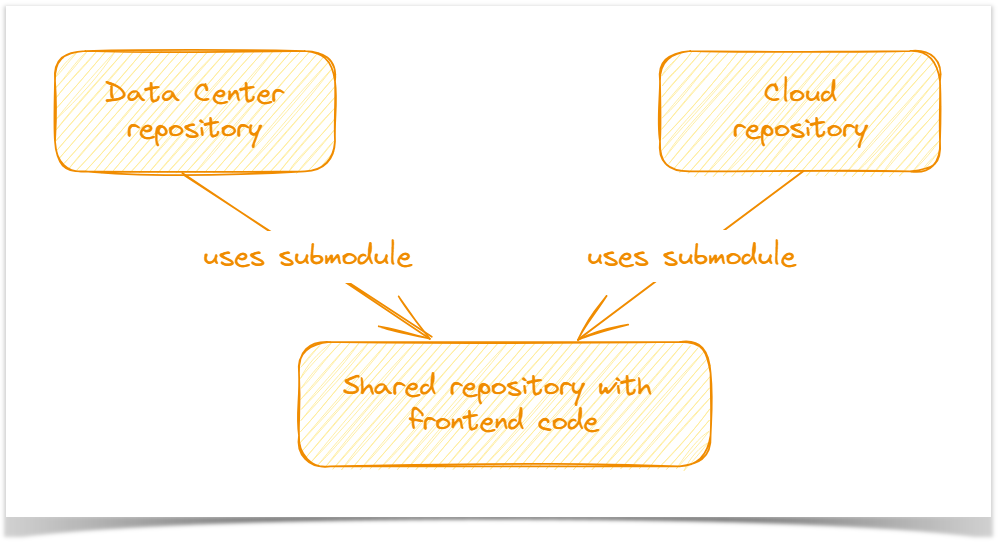
Here, we won’t dwell on how to write the code but will describe how the repositories are structured, using the example of one of our apps, Awesome Graphs for Bitbucket. Since the apps for Bitbucket Cloud and Data Center differ in functionality, we have two separate repositories for them. However, unlike the backend, the frontend for both app editions is almost identical. To avoid duplicating features, we allocated the shared part of the code into a separate third repository and connected it as a Git submodule.
It allows us to:
maintain consistency across both versions of the app
avoid code duplicating and implementing shared features twice
reduce redundancy and development efforts.
However, this solution has its drawbacks, such as:
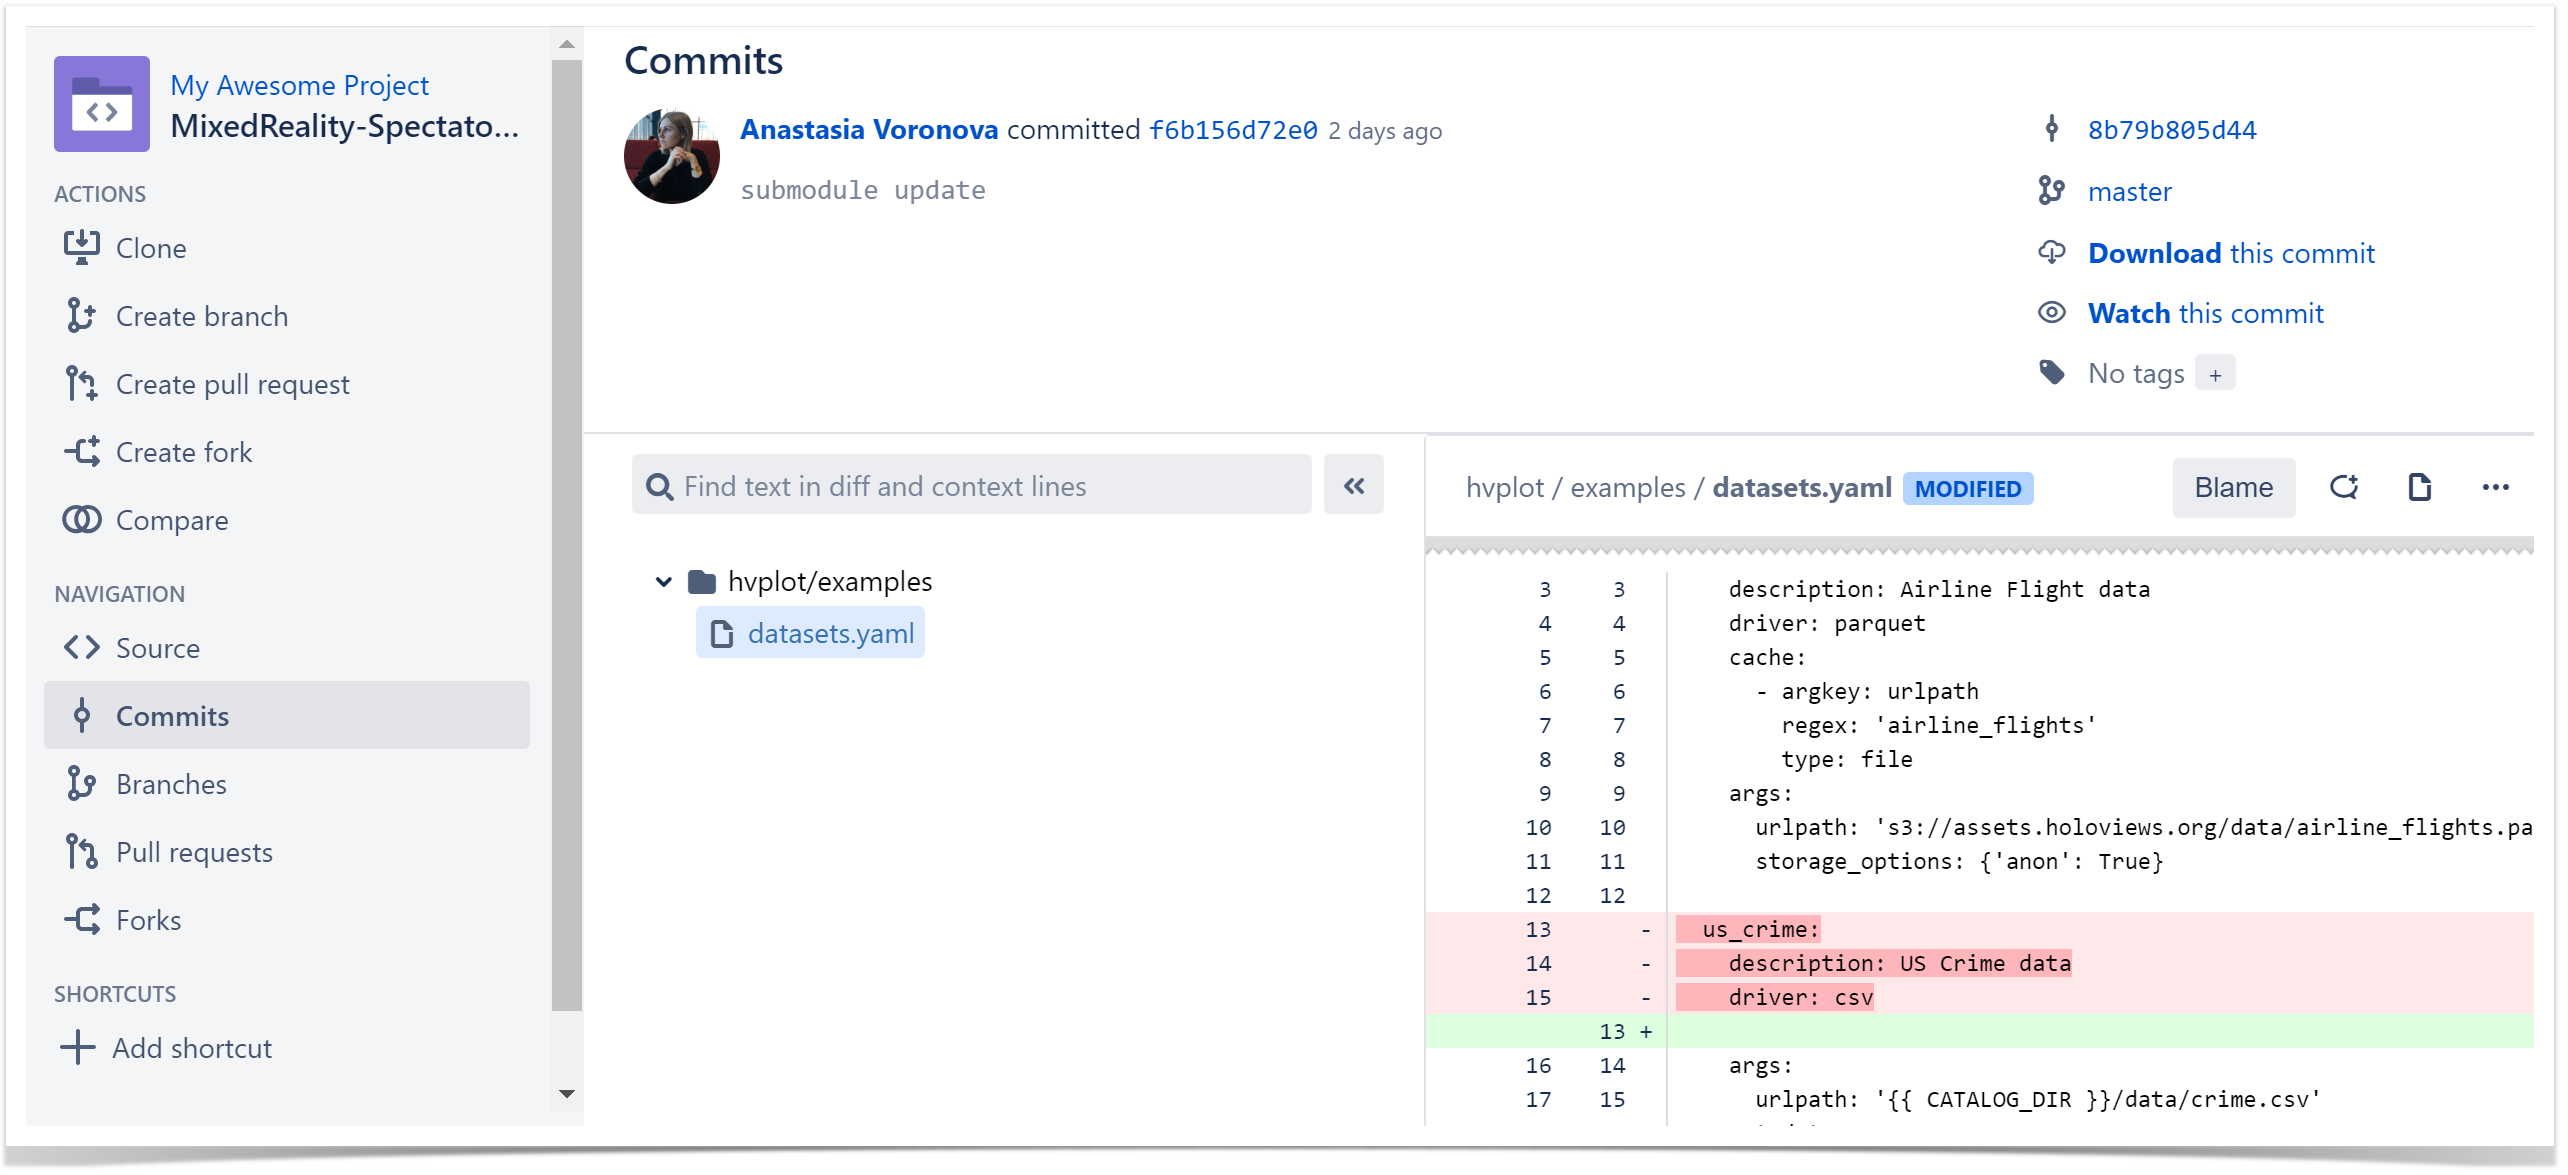
Complexity in reviewing changes as reviewers might need to navigate between the parent repository and the submodule’s repository to understand the full context of the changes.
Merge conflicts as adding a new feature to the shared code for one parent repository blocks changes for the second repo until we update the submodule.
Submodule updates challenges as we don’t create a separate pull request in the subdirectory. Thus, after merging the pull request into the main repository, the author needs to remember to merge the feature branch of the shared repo to the dev branch.
How the team tackles these challenges:
We use Submodule Changes for Bitbucket to avoid complexity in reviewing changes. This tool allows us to review code changes in the subdirectory as a part of the main repository. We can leave comments and tasks on the submodule’s code in the pull request of the parent repo.
Possible merge conflicts and the impact of a feature on another parent repo are considered within the Solution Proposal.
We use the internal app to automate the process of merging the feature branch to the dev branch of the shared repository.
Code Review and Testing
Since the details of the code review will be given in the next section, the only thing to mention here is that we create pull requests to facilitate this process in Bitbucket Data Center.
As for testing, an important point to note is that we don’t have QA engineers. The development team carries out testing to check the code for bugs and errors, and the product team to verify compliance with business requirements. We can use tools like Playwright to automate the process if necessary. The main idea behind this approach is that if a developer writes code conscientiously and pays attention to the quality, there is no need to involve testers. The code owner will understand its behavior and find deviations much better than anyone else. The developer creates tests during code writing to cover at least 80% of the code in the pull request. This is tracked for each commit using SonarQube.
Now that you know the main milestones of our development process, let’s move on to the main principles of the team’s code review process.
Code Review Guidelines of Our Team
When to Create a Pull Request
We agreed to create a pull request only if it contains code ready for deployment so the app will remain working after its merge. When an author needs feedback on functionality that is not ready for production, alternative ways, such as comparing two branches or requesting assistance in Slack, are used.
When there are dependent pull requests, the subsequent pull request is created only when the previous one was merged. For example, we recently enhanced one of the reports for the Awesome Graphs app. To avoid making one large pull request, we split the code changes into two parts: frontend and backend. Initially, the author created a pull request to review changes in the backend. Only after its merge did they submit the second one with frontend modifications. This is done to ensure that reviewers don’t get puzzled over determining which pull request to review first and have a clear understanding of priorities.
In this case, two versions of one functionality may appear in the master branch. As in the example above, we had two backend versions for the same report. That’s why, to indicate our intention to remove the old functionality soon and ensure that another developer won’t start using it, we annotate methods and classes slated for removal in future pull requests with “Deprecated”. This annotation should contain a link to the feature, after which completion, the annotated element should be deleted.
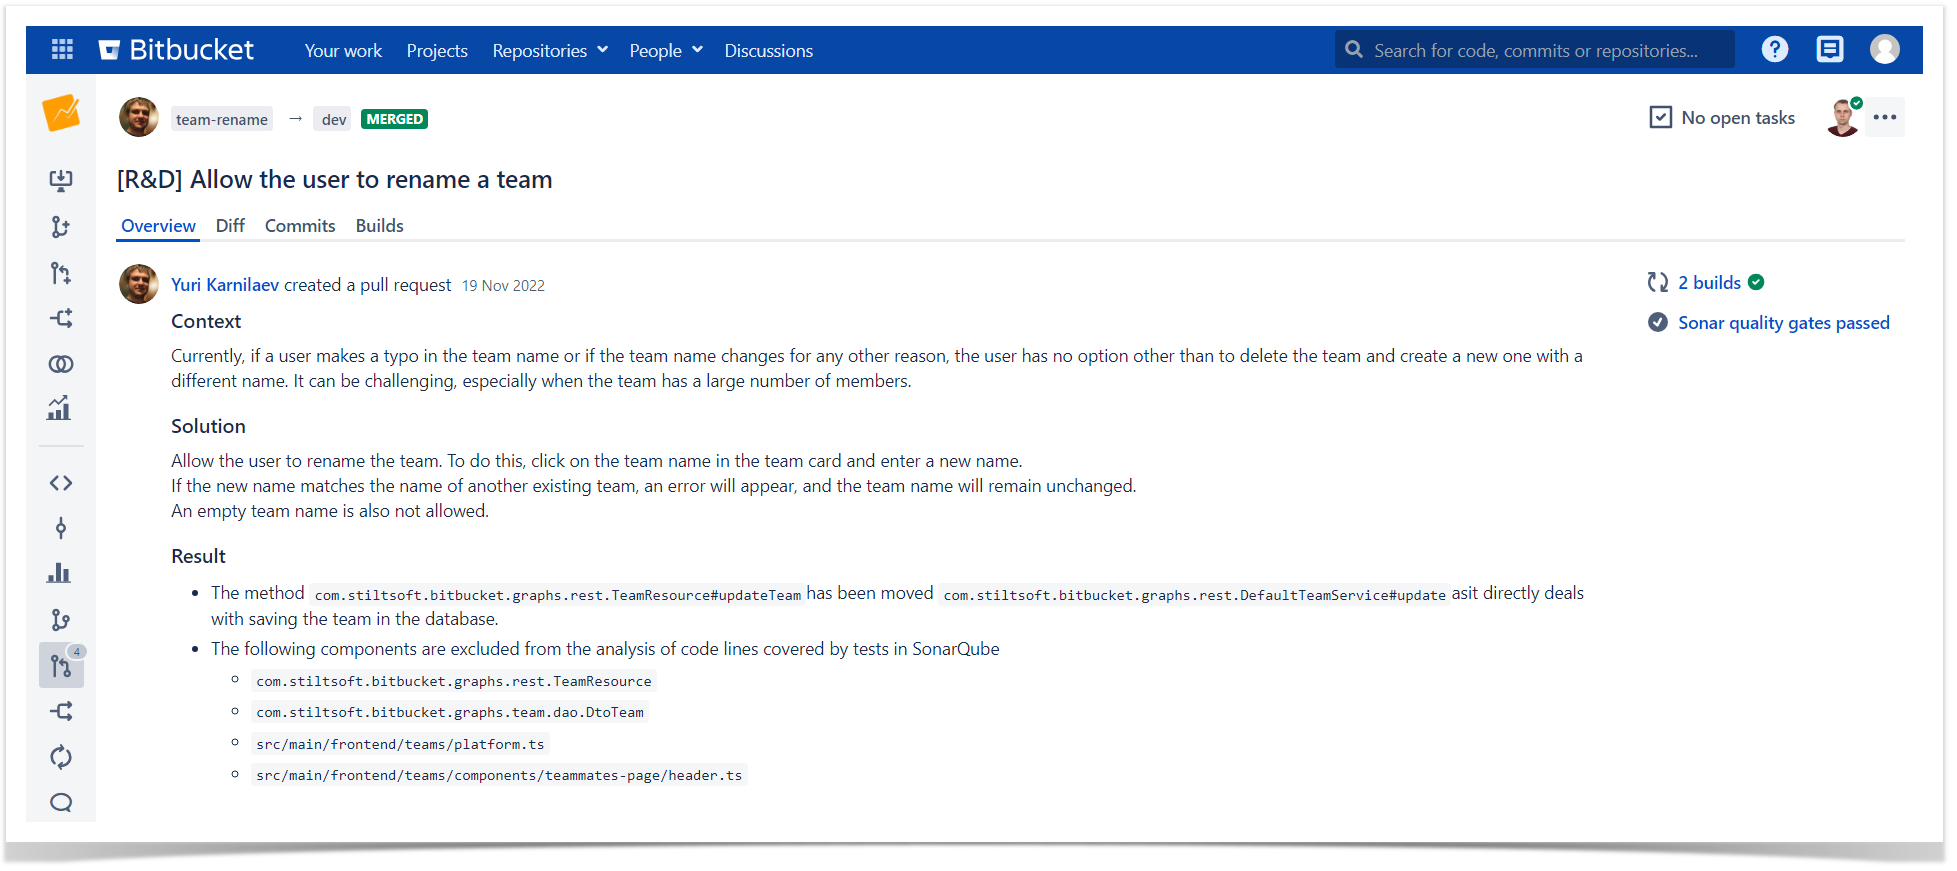
Pull Request Title and Description
Creating a pull request is always accompanied by giving it a title and adding a description. The title should be clear and reflect the essence of code changes, e.g., Pie Report Optimization: Backend.
The description is added so that each reviewer understands what changes will be made and why. It is similar to a short summary of the Solution Proposal and consists of 3 parts:
Context. An overview ofthe initial problem and associated constraints.
Solution. Key points of how we resolve the issue.
Results. A brief description of what we will get after implementing this solution.
Pull Request Reviewers
As our development team is relatively small, we add all members to review a pull request by default. This is done to share knowledge and ensure everyone is aware of code changes. However, if a reviewer cannot participate in code review for any reason, e.g., vacation, illness, or heavy workload, they remove themselves from the list of reviewers. Later, they can rejoin code review if circumstances have changed.
The main principle is that at least one reviewer should always be available to assess the pull request. Typically, code reviews involve 2-3 developers.
Once all developers have approved the pull request, the author adds a product team member. This step is essential as the product team tests changes and checks their compliance with the requirements and expected results.
PR Pickup Time & Review Rounds
During code review, one of the crucial aspects our team considers is pull request pickup time. We define it as the time from when a reviewer is added to the pull request until their first action.
The Service Level Agreement (SLA) for pickup time is one working day. The pull request author monitors this, and if no response is received within this time frame, they notify the team in the Slack channel. The second and subsequent reminders the author sends once every 4 hours.
We clearly define these time frames to avoid making the author guess when they will receive feedback and to enable them to make plans and work on other tasks.
The same rules are applied to reviewers’ pickup time after changes are made to the pull request. In this case, the author notifies reviewers by adding a comment such as “All comments addressed, please review again.”
Reviewers, in turn, notify the author of the pull request that they finished the code review by adding “Approved” or “Needs work” status.
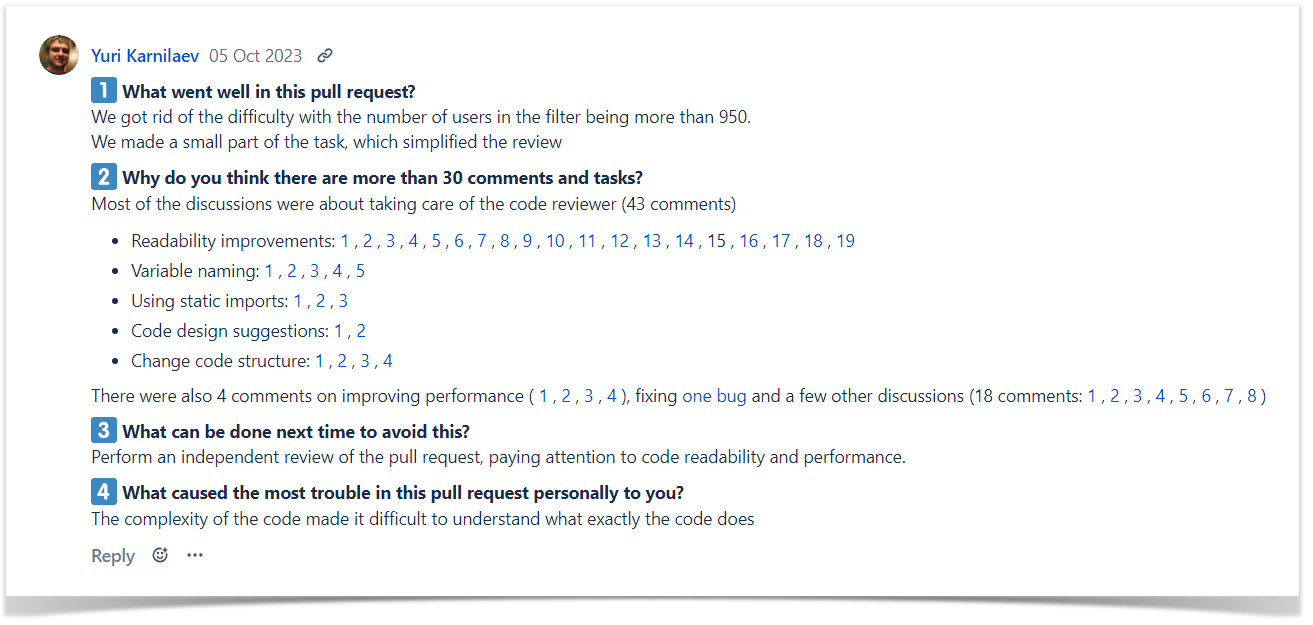
We do not limit the number of review rounds but track the number of activities in each pull request, as many comments might indicate some issues in the workflow. To perform this, we have an internal app for Bitbucket, which counts comments and tasks left in PRs. If this number exceeds 30, this tool asks the author and the reviewers to answer four questions:
What went well in this pull request?
Why do you think there are more than 30 comments and tasks?
What can be done next time to avoid this?
What caused the most trouble in this pull request personally to you?
We review these answers every two months to reflect on the processes, find bottlenecks, and optimize the workflow.
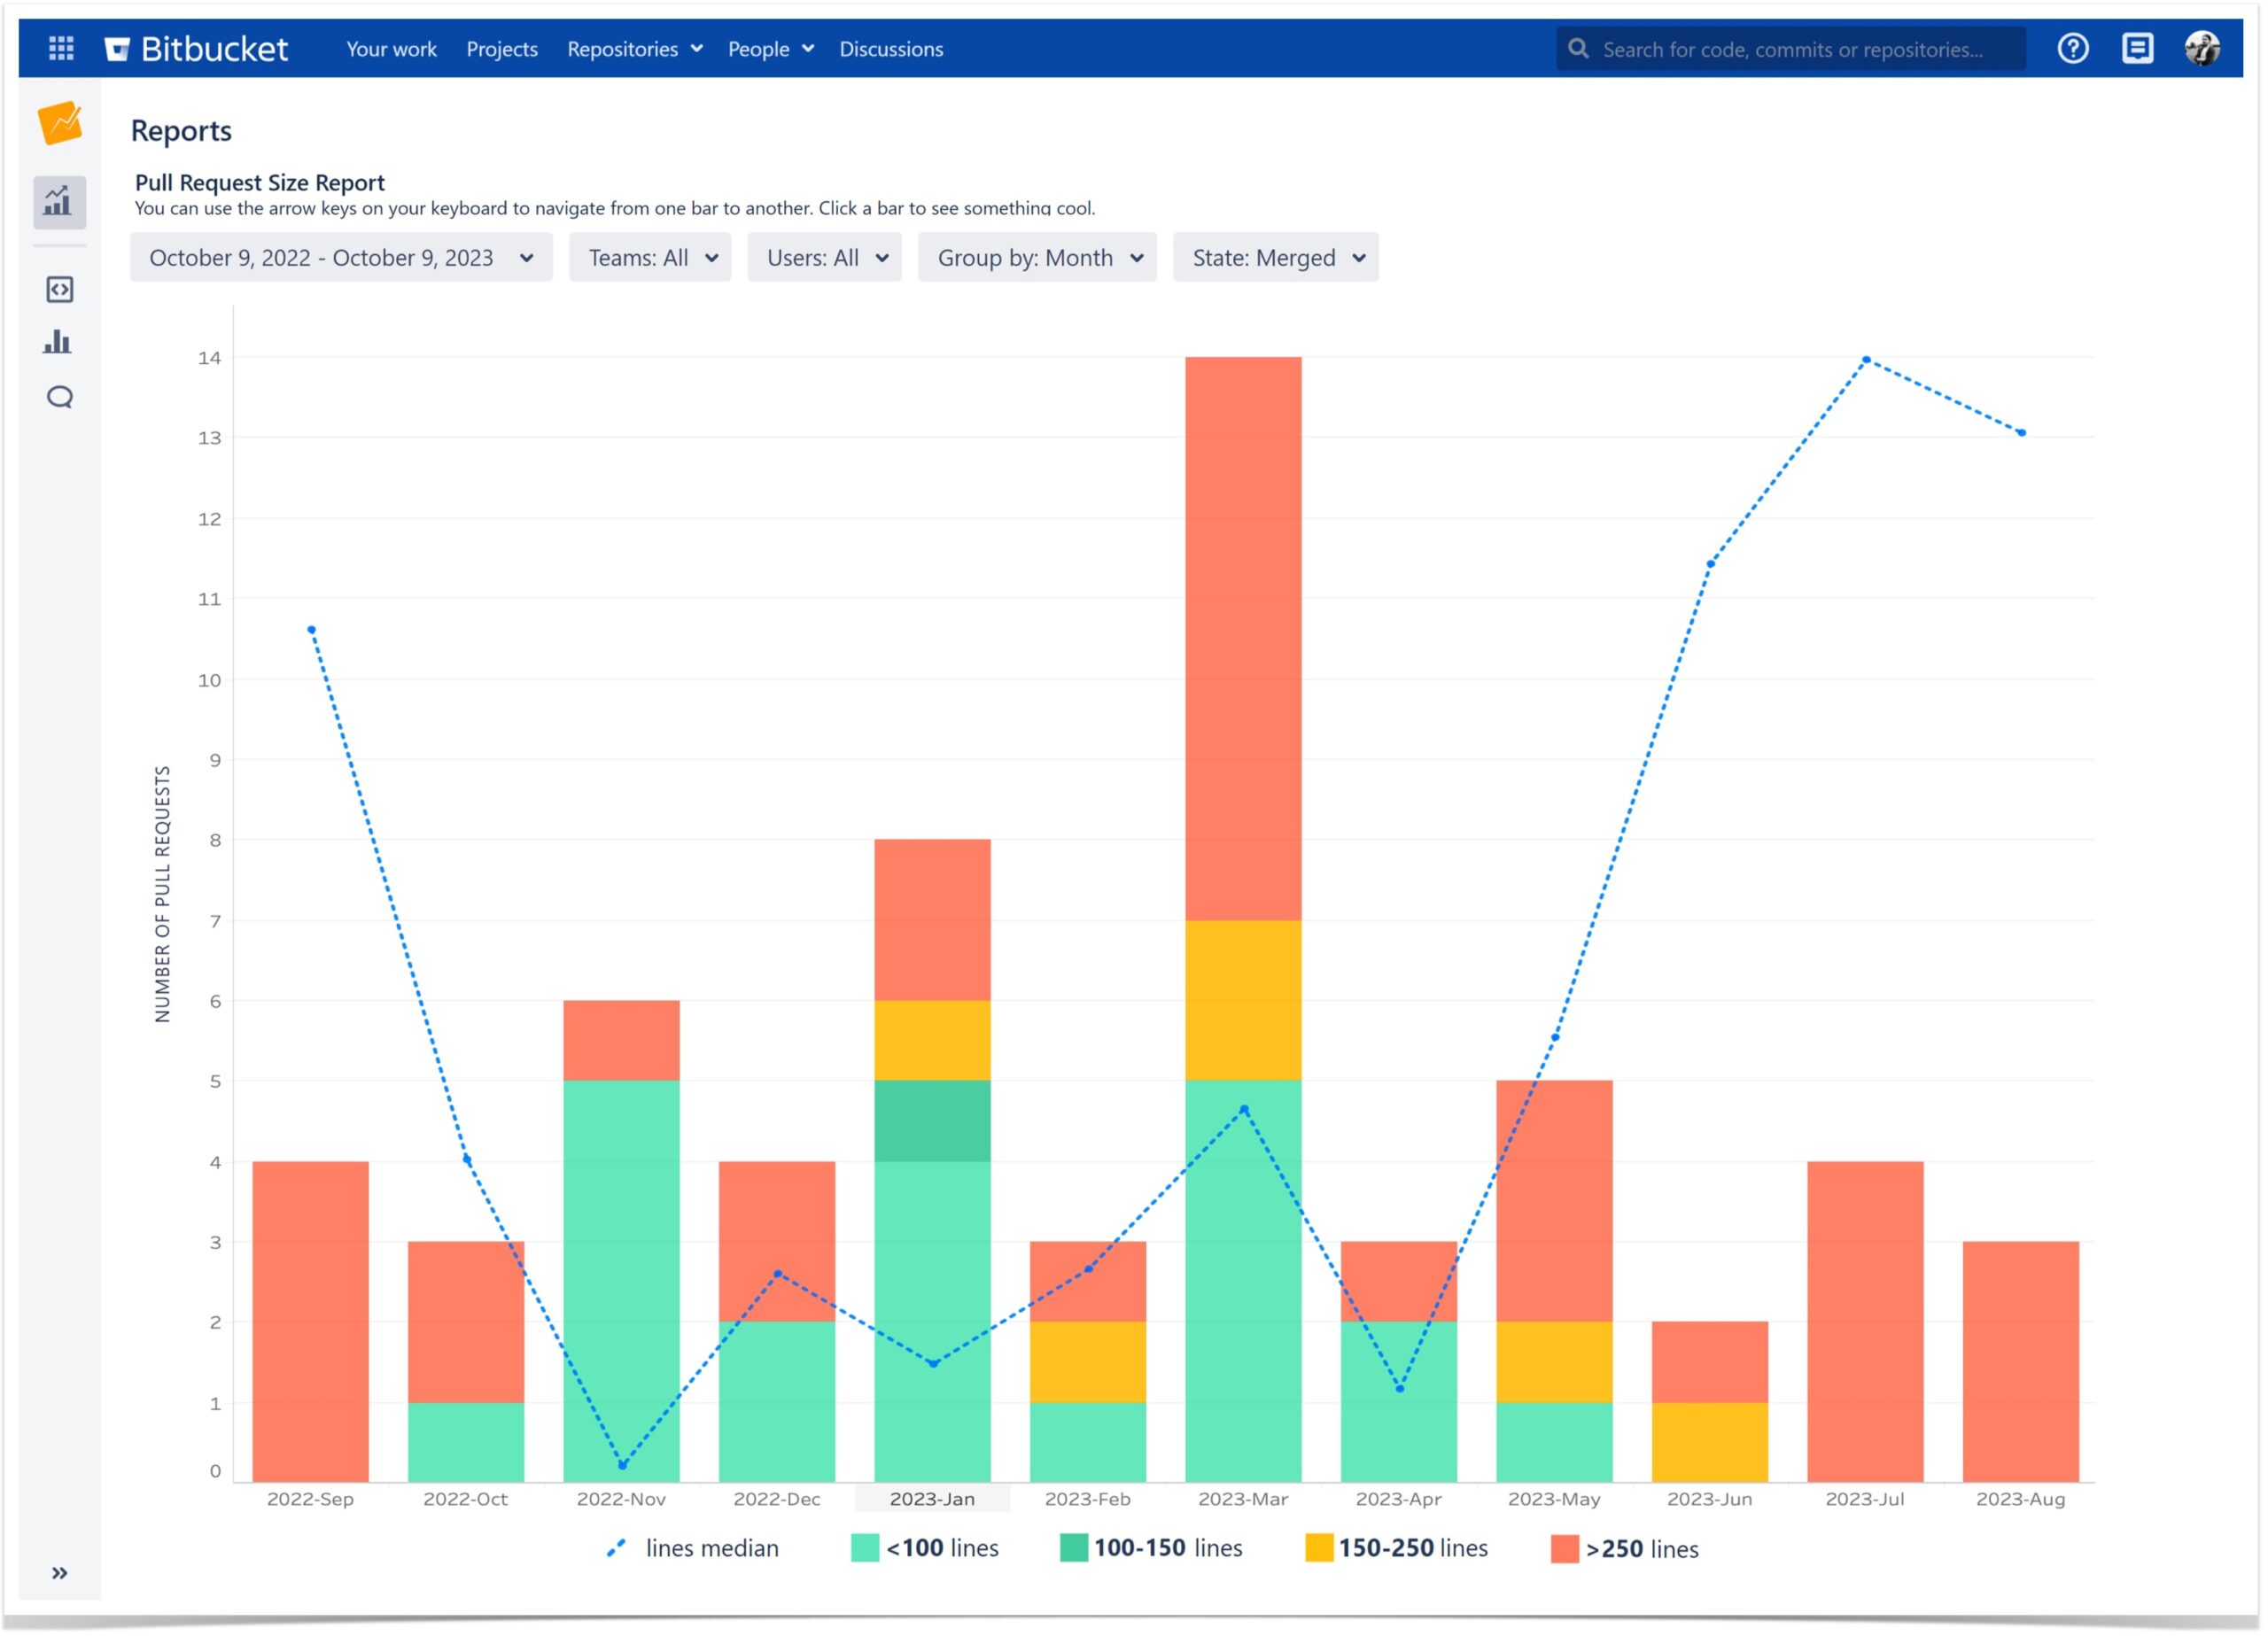
Pull Request Size
In pull requests, we look not only at the number of comments but also at their size. Our team believes that a great pull request should strike a balance between being small enough to be reviewed quickly by teammates and comprehensive enough to cover the planned changes or feature additions. That’s why an author of a pull request always strives to make it as simple and clean as possible.
Moreover, we are considering working on a new report for the Awesome Graphs app. It will enable users to see pull request size distribution and track changes in PR size over time. This functionality is not currently available to our clients, but we’ve made its prototype using the team’s data. Pretty good, right?
If this report sparked your interest, feel free to contact us. We will be glad to share the details and hear your thoughts.
Code Refactoring
When developing a new feature, the author sometimes comes across some parts in the code that they’d like to rewrite and update. This is inevitable as technologies evolve, new tools emerge, and our expertise expands. However, we agreed that refactoring is permitted within the scope of a pull request only if it influences the feature we are working on. Besides, reviewers can request to create a separate pull request for changes related to refactoring or to roll back these changes in case they distract from the review of the main functionality. This is extremely useful for large-scale refactoring as the developer will work on a particular task without investing time in non-priority ones.
Refactoring unrelated to the current feature is postponed or scheduled for R&D Day.
Every Friday, instead of working on regular tasks, we focus on enhancing the Developer Experience (DX) and exploring new tools to streamline and improve our processes. Here also come tasks related to refactoring and technical debt.
Tools for Code Review in Bitbucket
We’ve already mentioned some of these tools, but let’s put them together.
Submodule Changes for Bitbucket – a tool that helps review the changes made to Git submodules in the Diff tab in Bitbucket. We use it for two primary purposes:
To review changes in the submodule as if they are a part of the parental repository. We can leave comments and tasks on the submodule’s code within the code review process of the parental repository.
To check a new merge to ensure that the submodule commit can be merged to the dev branch in fast-forward mode.
SonarQube – a tool for static code analysis and calculating the percentage of code covered by tests. It helps us analyze the code of a single pull request. We have installed the Include Code Quality for Bitbucket plugin, which displays the SonarQube code quality check results within the pull request. It prevents us from merging a pull request if the code quality does not meet our team’s standards:
There are no errors or vulnerabilities in the new code identified by SonarQube.
Test coverage for new code is at least 80%. This requirement encourages us to gradually increase the test coverage of the codebase, as modifying previously written code, we also write tests for it if none exist.
Running tests and initiating SonarQube checks after each commit pushed to Bitbucket.
Managing the deployment of our projects to the Atlassian Marketplace and production environments. Although this is not directly related to code review in Bitbucket, it is essential to the overall development process.
Following these code review guidelines allows us to maintain high-quality code and foster efficient collaboration, leading to better, more reliable software and a more productive development environment. Apart from this, we always leave room for improvement and discuss the processes every two months to make the development of our products even more robust and effective.
Subscribe for monthly updates on how to get the most out of Atlassian products.
Thank you for signing up
for our newsletter!
You will be the first to know about fresh content, releases,
and special projects.
Stay tuned.
How to Find Data in Bitbucket to Monitor IT Compliance Standards
January 10, 2023
#How To#Bitbucket#Reporting
20 min
Compliance management is essential for businesses that provide financial services and deal with personal information. Banks, insurance companies, and other financial institutions must adhere to a range of external as well as internal IT compliance standards and policies to ensure data integrity, mitigate security risks in product development and avoid reputational damage caused by cyberattacks. Moreover, these regulatory requirements are constantly updating and changing, making it challenging to stay on top of compliance.
That’s why almost every financial organization has a dedicated compliance person or team who deals with IT controls, supports audits, and manages regulatory risks. However, as engineering data is scattered across different tools and some don’t provide aggregated information, compliance officers face difficulties finding, collecting, and reporting on the data needed to pass audits. Sometimes they even have to build custom tooling to ensure the organization’s security and compliance posture.
With all that in mind, we decided to show how to quickly find data in Bitbucket to track several most common violations of secure code development using Awesome Graphs for Bitbucket and comply with IT standards. Here they are:
First, let’s explore features of Awesome Graphs that help find information needed to comply with IT controls and meet regulatory requirements.
Graphs & Reports
Awesome Graphs provides a set of commit and pull request graphs and reports to show what is happening inside the project development. They help analyze activity in repositories and projects as well as track all changes.
To view graphs and reports in Bitbucket, you need to go to the project or repository you’d like to review and click on the Reports or Graphs icon in the navigation bar.
Export to CSV
Awesome Graphs for Bitbucket also enables users to export data to CSV directly from Bitbucket. It can be done in several ways. In the first option, you need to go to the People page and choose CSV in the Export menu at the top-right corner.
The outcome will be a list of pull requests or commits with detailed information helpful for audit or compliance teams.
As mentioned above, Awesome Graphs provides an opportunity to export raw data about commits, lines of code, and pull requests via REST API. You can retrieve data on the global, project, or repository level and get three types of outputs:
List of PRs or commits with detailed information
Export of data to a CSV file
Raw statistics with the number of PRs or commits
It gives access to resources via URI paths, uses JSON as its communication format, and the standard HTTP methods like GET, PUT, POST, and DELETE.
Below, we’ll show how to use these features of Awesome Graphs to detect the most common violations of secure code development and meet compliance requirements.
How to check the most common violations with Awesome Graphs for Bitbucket
The author of the pull request approved their own pull request
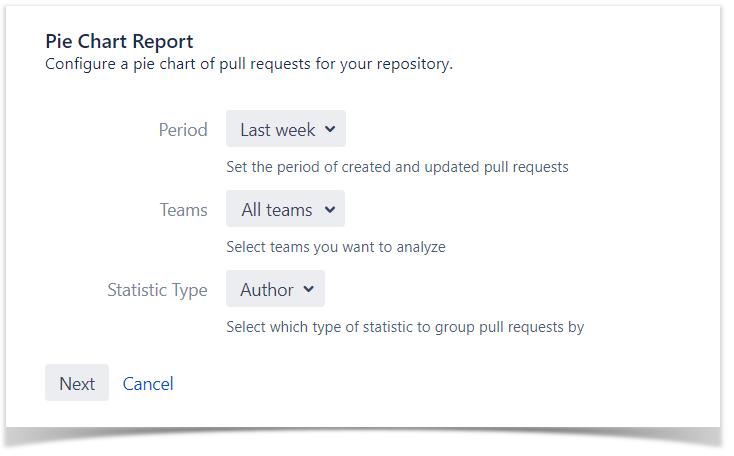
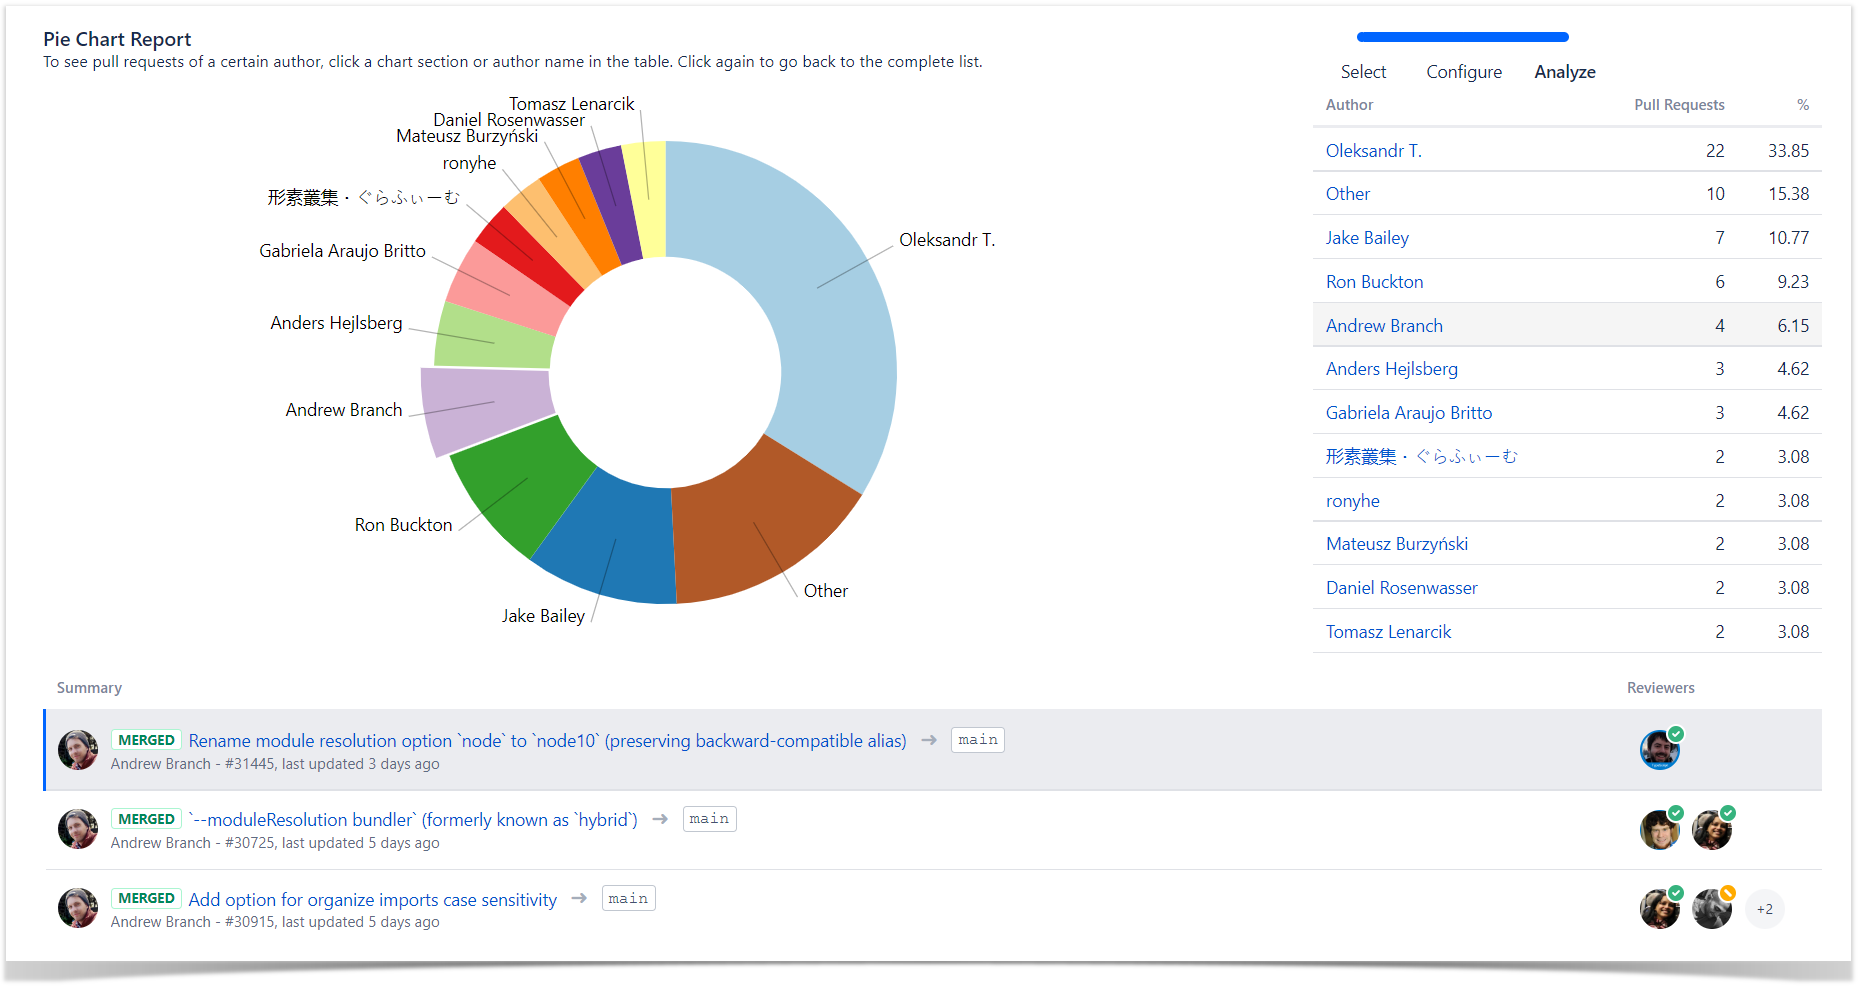
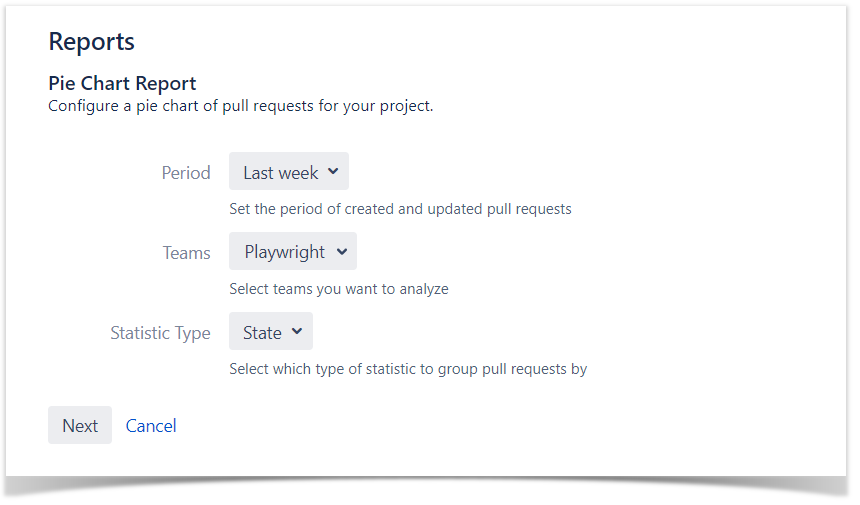
To find authors and reviewers of pull requests, you can navigate to the Pie Chart Report, group data by Author in the Statistic type field, and choose a time period or a team if needed.
As a result, it displays the list of all pull requests with their authors for the selected time span. Click on a particular author and check if they approved (green checkmark) their own pull request.
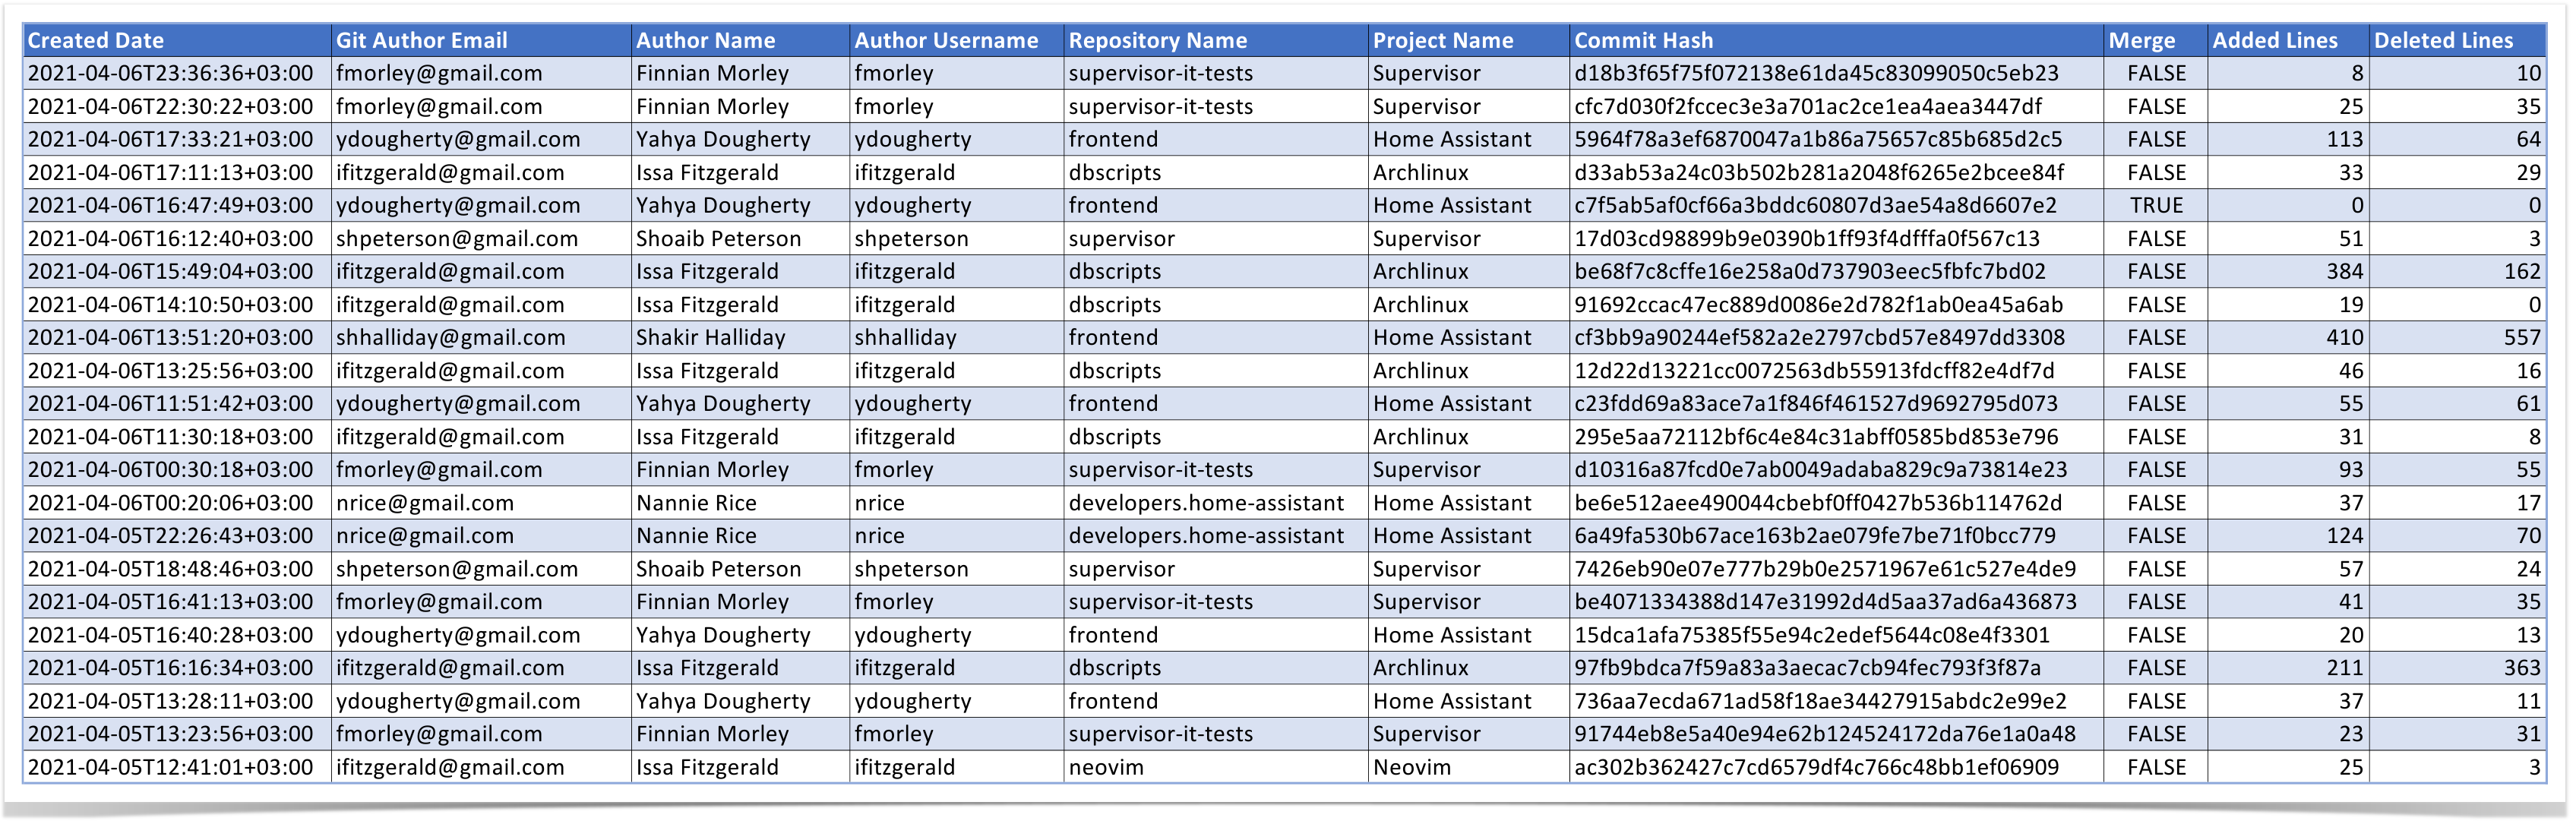
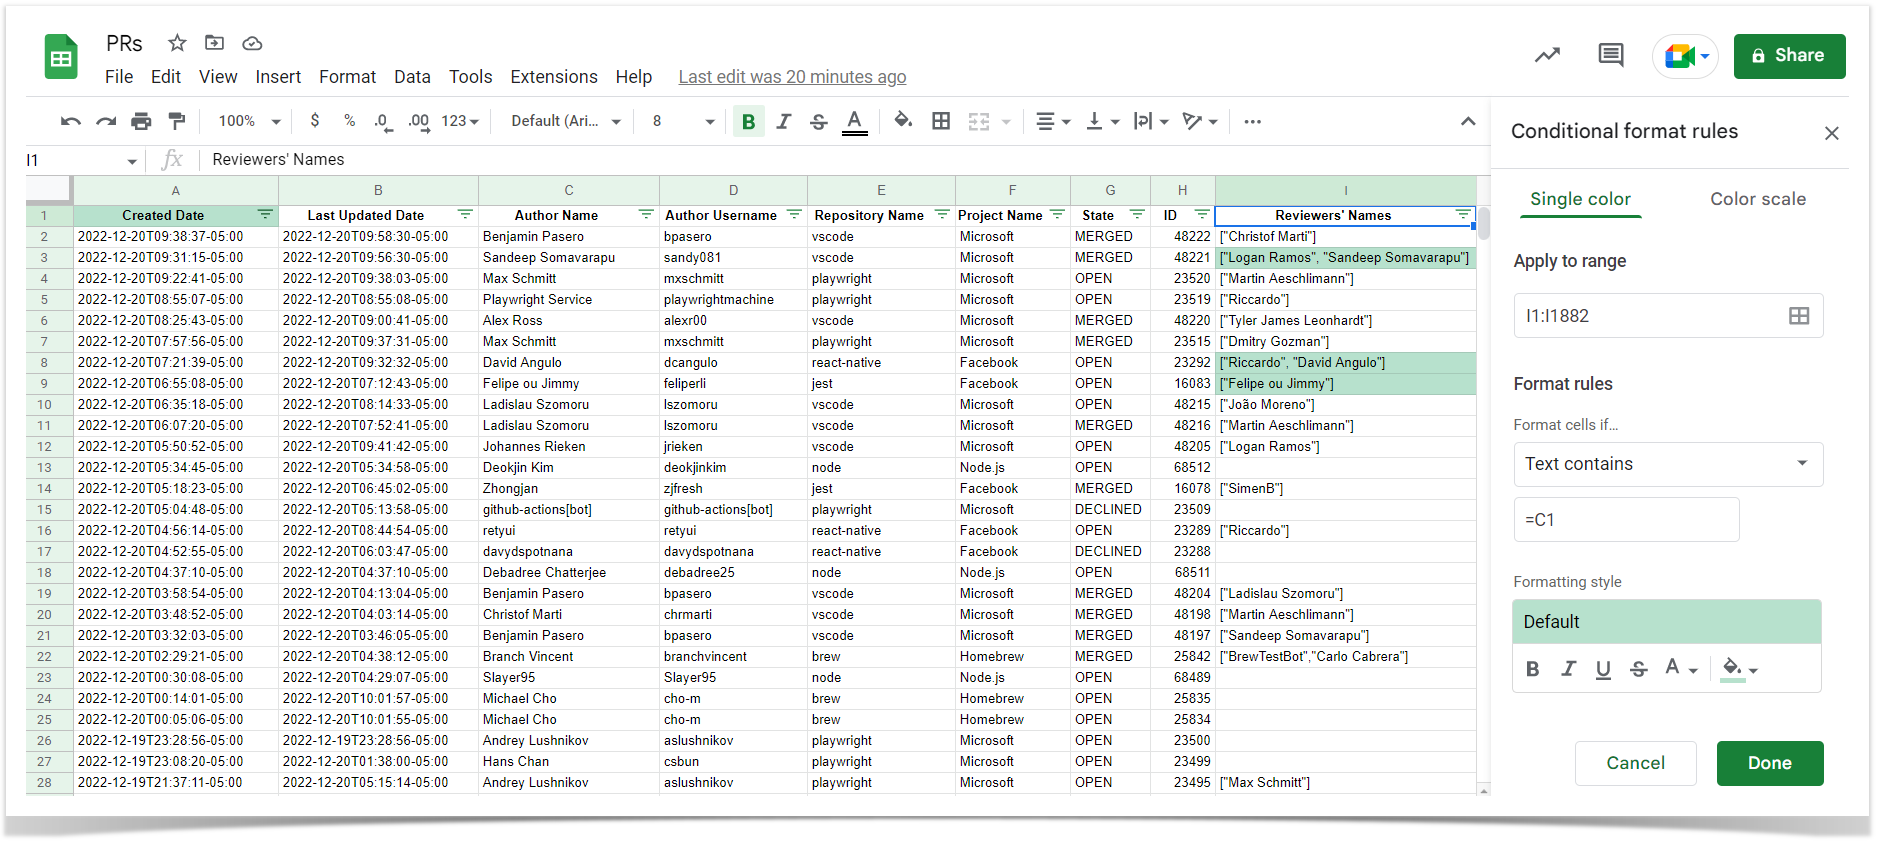
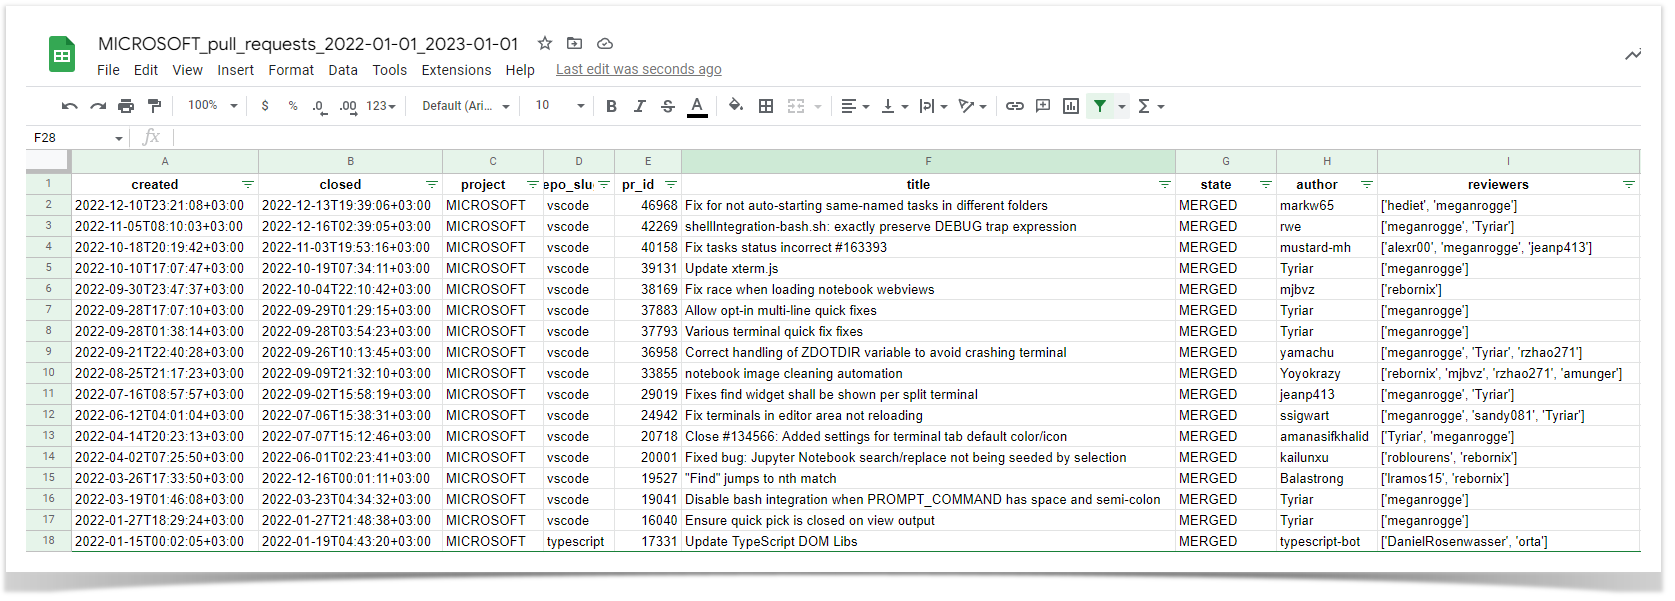
To check pull requests in bulk or prepare custom reports for audits, you can export them to a CSV file. Here is an example of working with it in Google Sheets, but the same can be done in Excel as well.
Then use Conditional formatting for the Reviewers’ Names column: Format → Conditional formatting → Format cells if Text contains =C1 (Author Name). Authors who have reviewed their own pull requests will be highlighted, making it easy to find them.
The committers of the pull request approved the pull request they contributed to
This information can be obtained using the Awesome Graphs REST API and the standard REST API of Bitbucket. Here is a Python script you can use. It retrieves data on the project level and identifies pull requests where committers approved their contributions.
import sys
import requests
import csv

bitbucket_url = sys.argv[1]  # https://bitbucket.your-company-name.com
login = sys.argv[2]
password = sys.argv[3]
project = sys.argv[4]
since = sys.argv[5]  # YYYY-MM-DD
until = sys.argv[6]  # YYYY-MM-DD

s = requests.Session()
s.auth = (login, password)


class PullRequest:

    def __init__(self, created, closed, repo_slug, pr_id, title, state, author, reviewers):

        self.created = created
        self.closed = closed
        self.repo_slug = repo_slug
        self.pr_id = pr_id
        self.title = title
        self.state = state
        self.author = author
        self.reviewers = reviewers


def get_pull_requests():

    pull_request_list = []

    get_prs_url = bitbucket_url + '/rest/awesome-graphs-api/latest/projects/' + project + '/pull-requests'

    is_last_page = False

    while not is_last_page:

        response = s.get(get_prs_url, params={'start': len(pull_request_list),
                                              'limit': 1000,
                                              'sinceDate': since,
                                              'untilDate': until,
                                              'state': 'merged'}).json()

        for pr_details in response['values']:

            reviewers = []

            for reviewer in pr_details['reviewers']:
                reviewers.append(reviewer['user']['name'])

            created = pr_details['createdDate']
            closed = pr_details['closedDate']
            repo_slug = pr_details['toRef']['repository']['slug']
            pd_id = pr_details['id']
            title = pr_details['title']
            state = pr_details['state']
            author = pr_details['author']['user']['name']

            pull_request_list.append(PullRequest(created, closed, repo_slug, pd_id, title, state, author, reviewers))

        is_last_page = response['isLastPage']

    return pull_request_list


def get_pr_committers(pull_request):

    committers = []

    commits_url = bitbucket_url + '/rest/api/latest/projects/' + project + '/repos/' + pull_request.repo_slug + '/pull-requests/' + str(pull_request.pr_id) + '/commits'

    is_last_page = False

    while not is_last_page:

        commits_response = s.get(commits_url, params={'start': len(committers), 'limit': 500}).json()

        for commit in commits_response['values']:

            committer = commit['author']['name']
            committers.append(committer)

        is_last_page = commits_response['isLastPage']

    committers_wo_duplicates = list(dict.fromkeys(committers))

    return committers_wo_duplicates


print(f'Collecting a list of pull requests from project {project}')

pr_list = get_pull_requests()

committers_are_reviewers_prs = []

print('Processing the list of pull requests')

for pull_request in pr_list:

    committers = get_pr_committers(pull_request)

    for committer in committers:

        if committer in pull_request.reviewers:

            committers_are_reviewers_prs.append(pull_request)


with open(f'{project}_pull_requests_{since}_{until}.csv', mode='a', newline='') as report_file:

    report_writer = csv.writer(report_file, delimiter=',', quotechar='"', quoting=csv.QUOTE_MINIMAL)
    report_writer.writerow(['created',
                            'closed',
                            'project',
                            'repo_slug',
                            'pr_id',
                            'title',
                            'state',
                            'author',
                            'reviewers'])

    for pr in committers_are_reviewers_prs:

        report_writer.writerow([pr.created,
                                pr.closed,
                                project,
                                pr.repo_slug,
                                pr.pr_id,
                                pr.title,
                                pr.state,
                                pr.author,
                                pr.reviewers])

print('The resulting CSV file is saved to the current folder')
To make this script work, you’ll need to pre-install the requests module. The csv and sys are available in Python out of the box. You need to pass the following arguments to the script when executed:
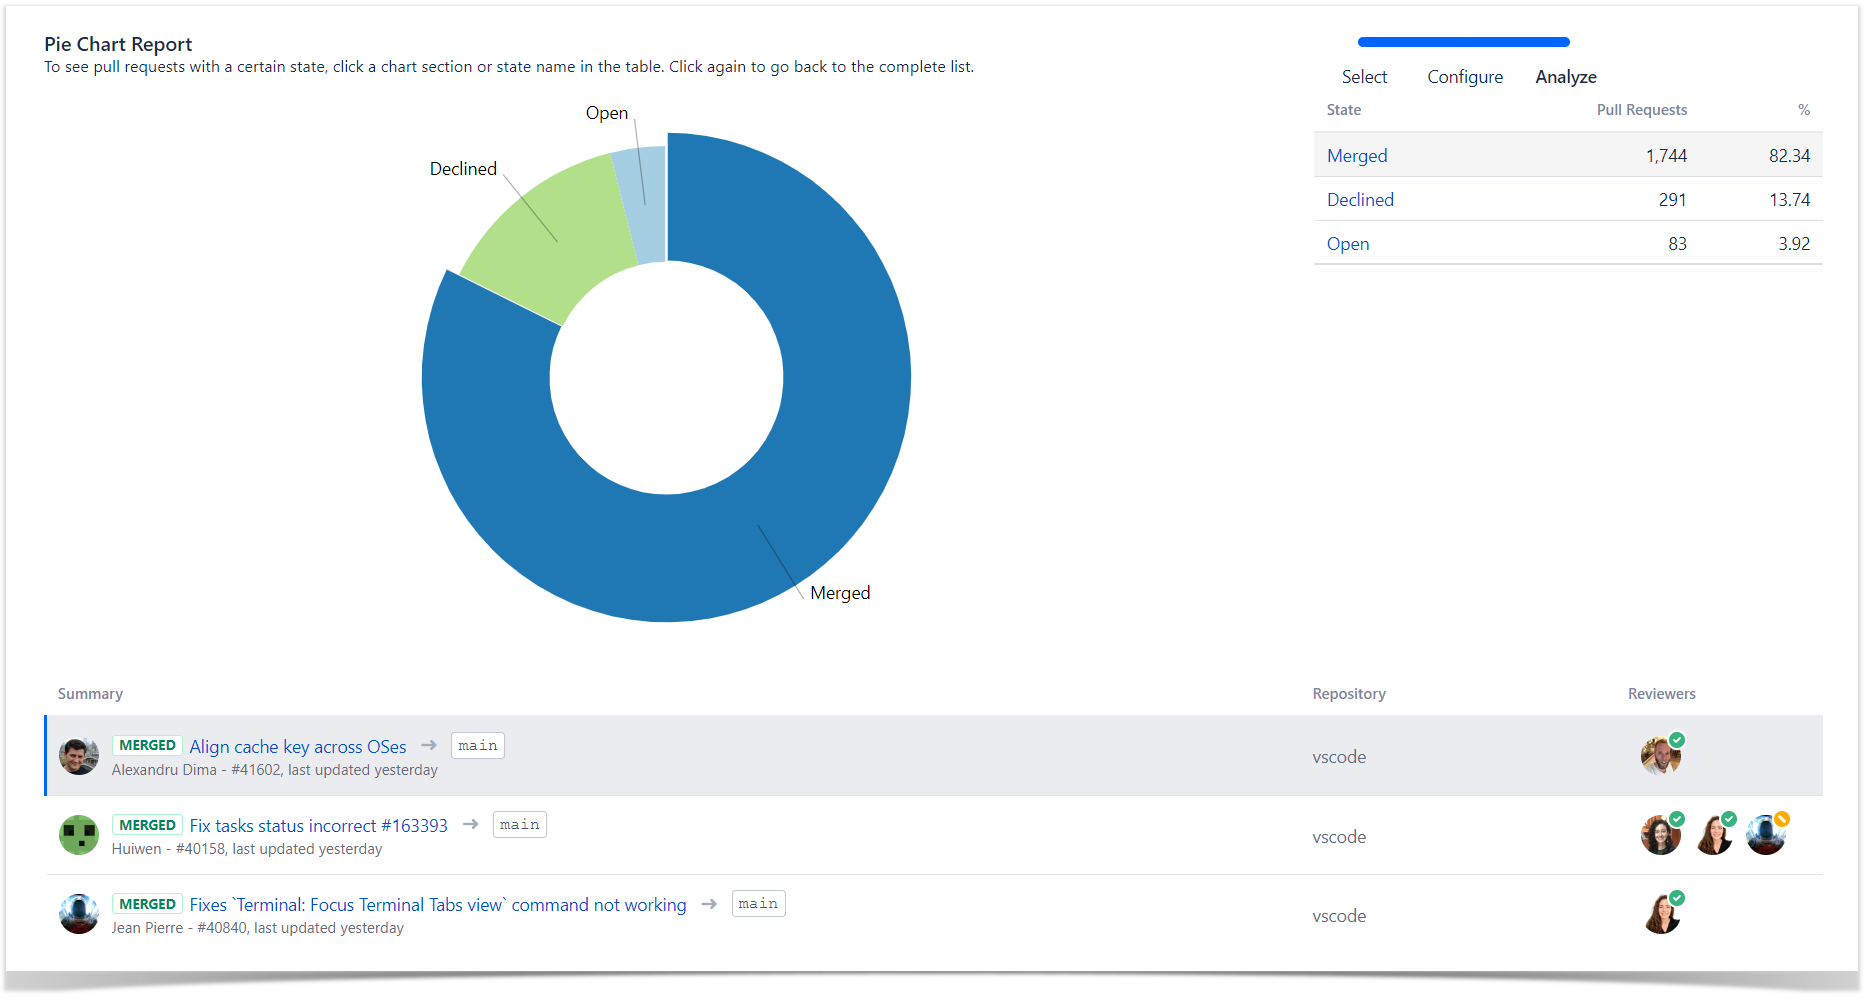
To find the list of pull requests with the reviewers who approved them, use the Pie Chart Report. In the configuration tab in the Statistic type field, select grouping by State, and choose a time period or a team if necessary.
You can view all merged pull requests with their reviewers below the report by clicking the Merged sector. The reviewers with the green checkmark are those who approved pull requests. You can scroll the list and find merged PRs with fewer than two approvals.
2nd option – Export pull request data via REST API
You can get the status of each reviewer using Awesome Graphs REST API. Here is an example to retrieve data on the project level:
Then you can display this information in Confluence using, for example, Table from JSON macro (a feature of Table Filter and Charts for Confluence) and add a pivot table or export to CSV and apply Conditional formatting in Google Sheets or Excel. Thus, you’ll get a list of pull requests merged with fewer than two approvals.
Additionally, Bitbucket lets you set up checks for merging pull requests. It’s a list of restrictions that can be imposed to maintain high code quality standards and comply with IT regulatory requirements. You can specify a minimum number of approvals needed to merge pull requests.
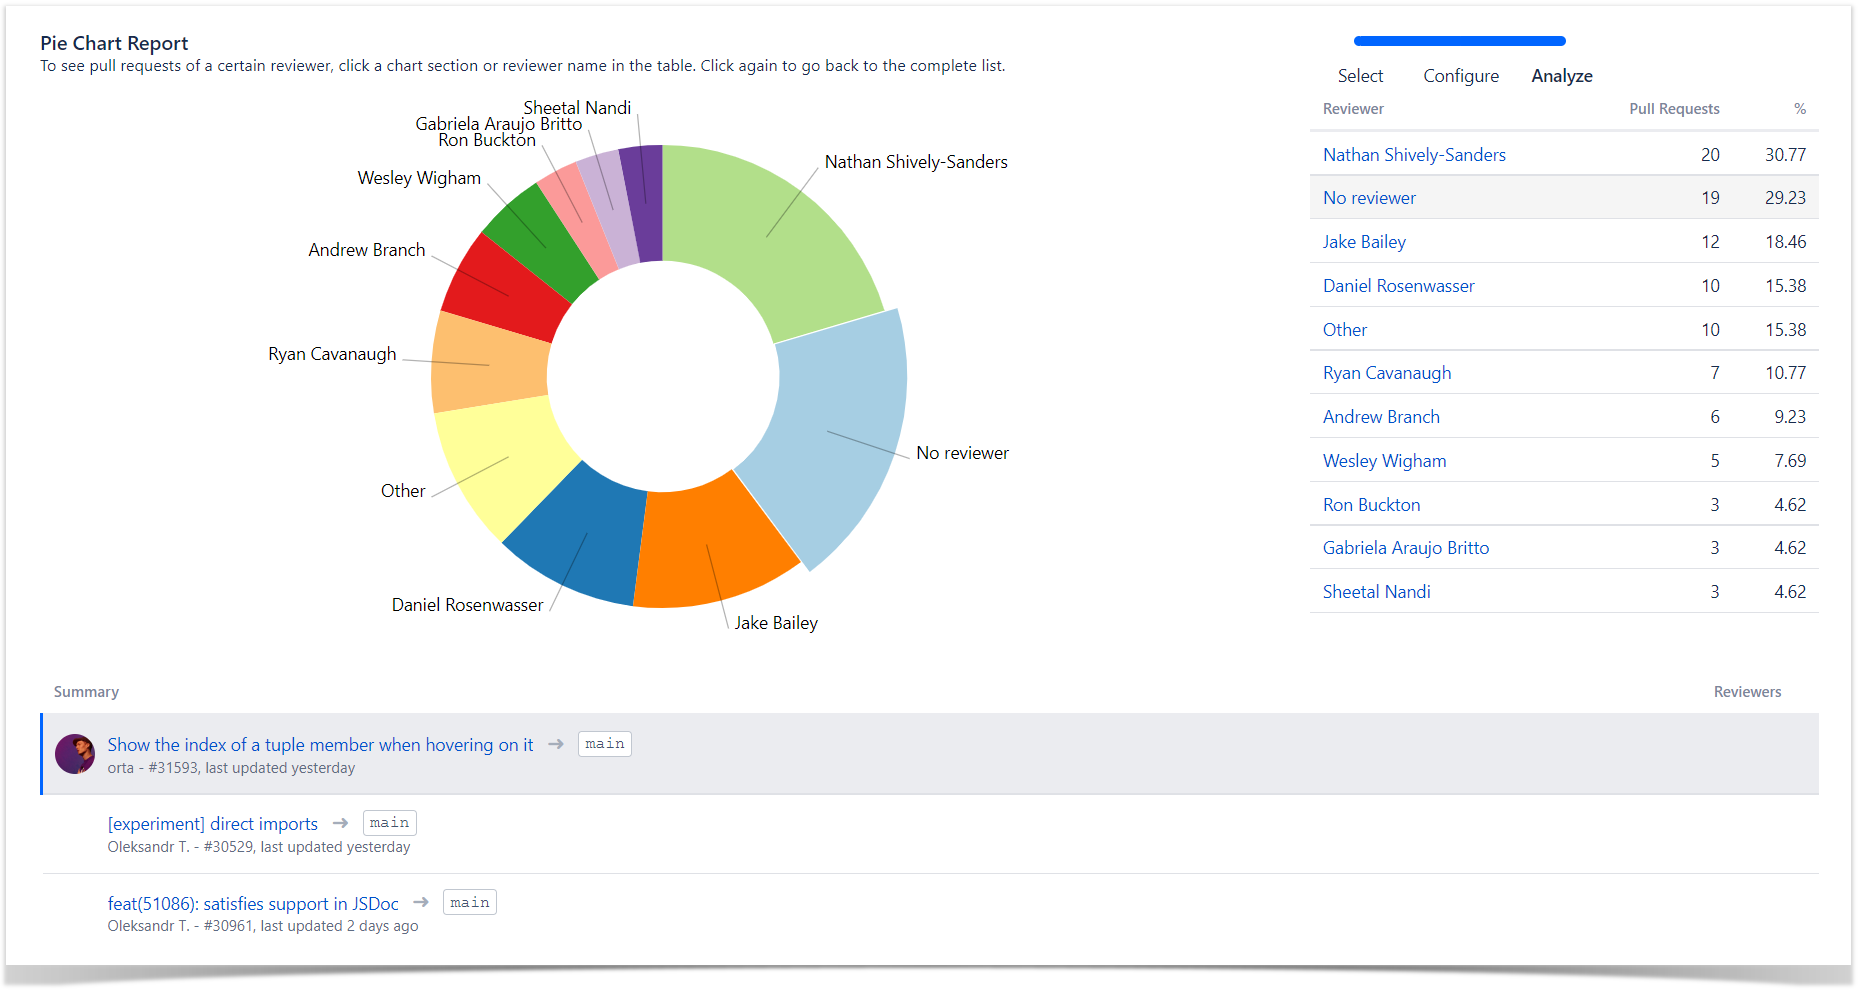
To find pull requests merged without reviewers, use the Pie Chart Report. Group data by Reviewer in the Statistic type field and click on the No reviewer slice in the chart. Below the report, you’ll see all pull requests merged without a reviewer.
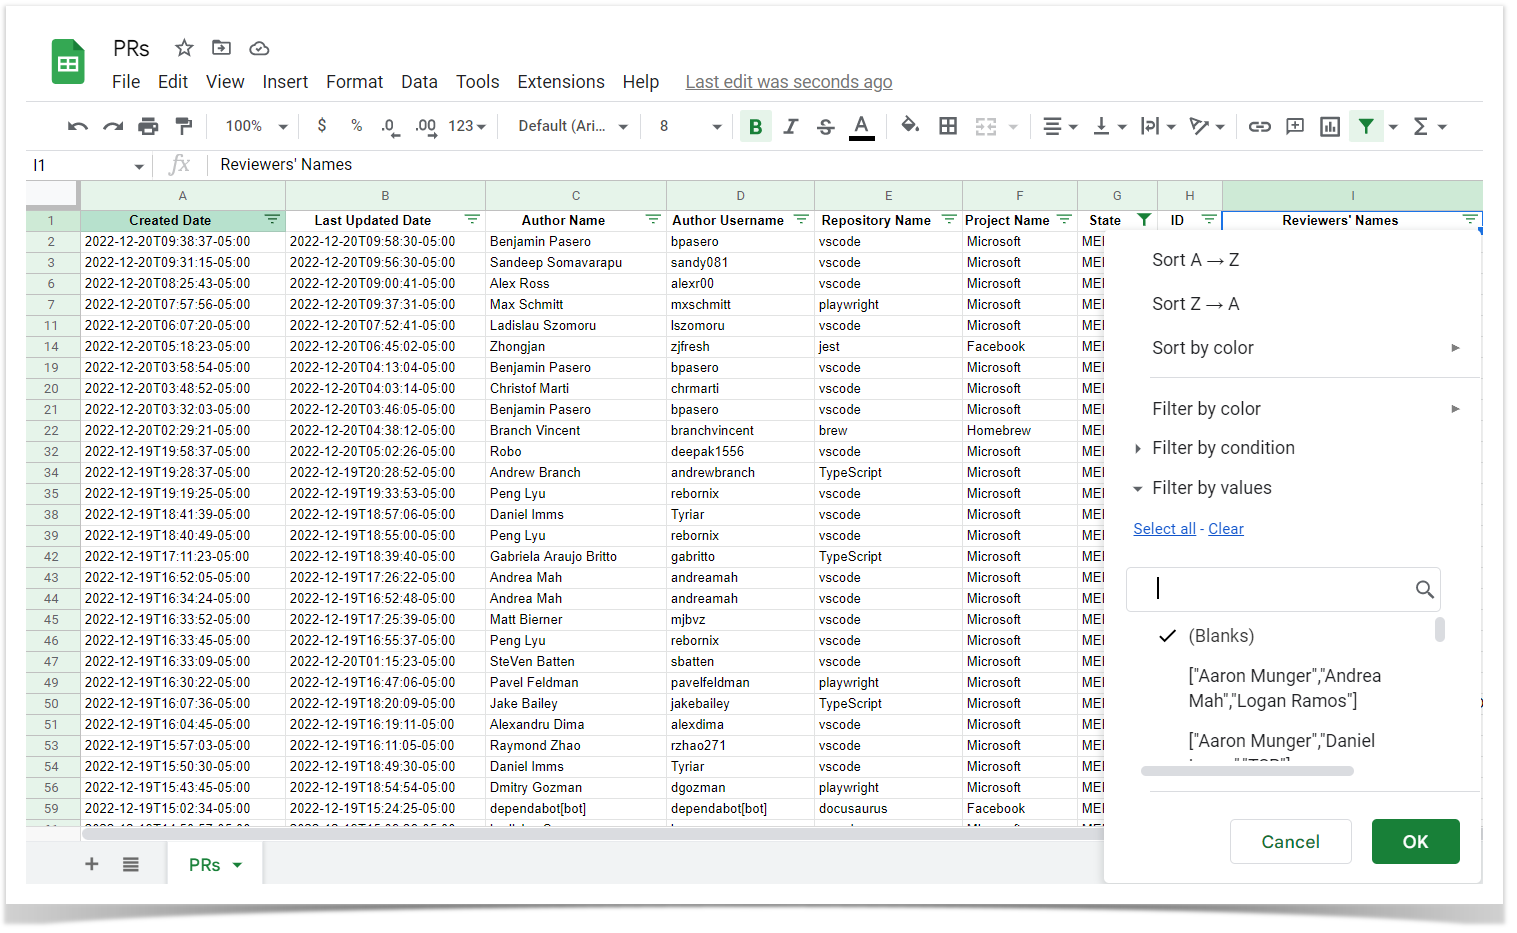
To check pull requests in bulk or prepare reports for audit or compliance teams, you can export them to a CSV file and apply filters to the State column (choose Merged) and the Reviewers’ Names column (choose Blanks). Thus, you’ll get the list of pull requests that were merged without reviewers.
Apart from this, there is also an option to retrieve data using REST API with a filter by pull request state. Here is a request example on the project level:
Unauthorized people merged or approved a pull request
Logging all changes and restricting access to unauthorized people is one more principle of protecting production code. However, the concept of authorized people may vary depending on the organization, project, or industry requirements. But as was shown above, with Awesome Graphs, you can quickly get a list of individuals who made changes and compare it with those who had the rights.
It’s also worth noting that Bitbucket has built-in features to control access to code and adhere to regulatory requirements:
As can be seen, all of the most common violations can be easily identified using Awesome Graphs for Bitbucket. With it, compliance officers can quickly check if all processes comply with IT controls and standards, as well as collect engineering data to ensure the organization’s security posture and facilitate compliance management.
If you need to meet other IT controls, you can contact our support team, and we’ll share our ideas on how our app may help.
Subscribe for monthly updates on how to get the most out of Atlassian products.
Thank you for signing up
for our newsletter!
You will be the first to know about fresh content, releases,
and special projects.
Stay tuned.
It’s good when business decisions are based on facts, but it’s even better when these facts are expressed in numbers and can be compared with each other. The same applies to software delivery performance. This area is undergoing a great deal of interest in order to identify universal metrics to measure engineering processes. DORA metrics are considered to be among them. In this article, we’ll explain what DORA metrics are, how they contribute to a company’s success and how to measure them in Bitbucket.
What are DORA Metrics?
DORA metrics are a set of indicators that help companies measure the quality of software development and speed of delivery processes. They were identified by the DevOps Research and Assessment (DORA) group based on several years of studies into the DevOps practices of 30k+ engineering professionals.
DevOps Research and Assessment is an American research firm focused on digital transformation founded in 2015 and acquired by Google in 2019, known for its annual State of DevOps reports on business technology transformation.
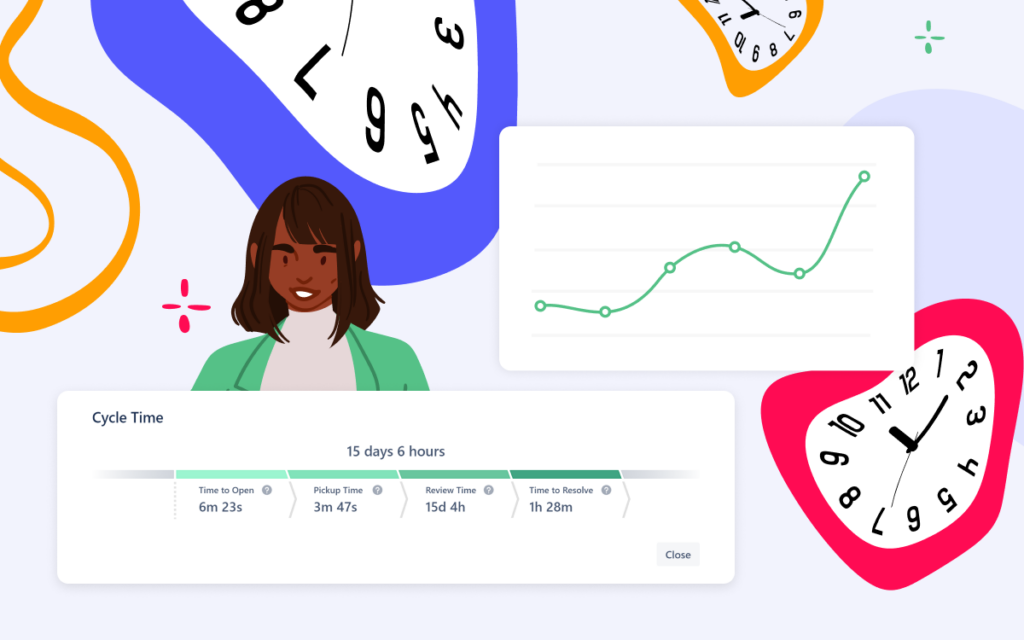
DORA metrics are primarily used to gauge:
Throughput
Deployment frequency – How often code is deployed
Lead time for changes – How long it takes for a commit to get into production
Stability
Change failure rate – Percentage of changes that led to problems in production
Time to restore service – How long it takes to recover service after an incident
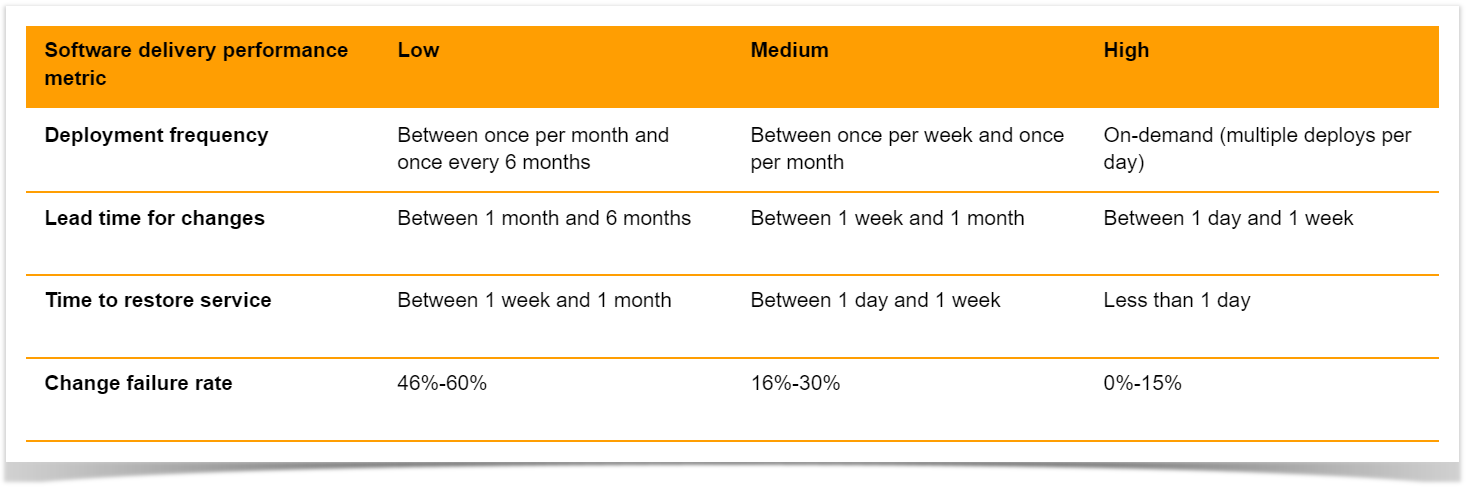
Based on how teams rank in each category, they are added to elite*, high, medium, or low clusters.
Source: 2022 Accelerate State of DevOps Report. *This year an elite cluster was omitted as the highest-performing cluster doesn’t demonstrate enough of the characteristics of last year’s elite cluster.
In addition to software delivery performance indicators, the group recently added the fifth key metric – reliability. It is used to measure operational performance and illustrates how well services meet users’ needs, such as availability and performance.
Let’s have a closer look at the four software delivery performance metrics.
Deployment frequency
This metric indicates how often code is delivered to production or released to end users. According to DORA, the higher the deployment frequency, the better, as it involves more minor changes and minimizes release risks. In addition, it allows you to deliver value to customers faster and get feedback quicker.
But the deployment frequency depends on the type of system. While web apps are typically delivered multiple times a day, this frequency isn’t appropriate for game developers with multi-gigabyte releases. In this case, the frequency of deployment to pre-production environments can be measured.
Lead Time for Changes
Lead time for changes also refers to the speed of development and indicates the time taken to deliver a commit into production. Using it, engineering managers can understand how efficient their teams’ cycle time is, how quickly changes are implemented and how well peaks in demand can be handled. Moreover, a long lead time for changes means that product updates are not delivered to users regularly enough. Therefore the advantage of quick feedback for further improvements cannot be taken.
Change Failure Rate
The change failure rate refers to code quality and measures the percentage of deployments that led to failures in production requiring remediation (e.g., a hotfix, rollback, fix forward, patch). Here is compared the number of post-deployment failures to the number of changes made.
A low change failure rate confirms the quality of the pipeline and indicates that the previous stages have successfully identified the majority of defects before deployments.
Time to Restore Service
This metric also shows the quality of software development and refers to the time taken to restore service after such incidents as an unplanned outage or service impairment. No matter how hard your team tries, the chance of an outage is high. So it’s crucial to organize processes to respond to emerging issues as quickly as possible.
A low time to recovery means that you efficiently identify emerging issues and can either quickly roll back to a previous version or promptly deploy a bug fix.
How to measure DORA metrics in Bitbucket?
As can be seen, DORA metrics are an effective way to understand your teams’ throughput and quality of code and make informed decisions about improving processes.
Using information from your project management systems like Jira and Bitbucket, you can calculate them manually:
Deployment frequency – the average number of days per week or month with at least one deployment
Lead time for changes – the average time between the first commit of a release and the deployment to production
Change failure rate – the ratio of deployment failures to the overall number of deployments
Time to restore service – the average time between a bug report and fix deployment
We use cookies on our website to give you the most relevant experience by remembering your preferences and repeat visits. By clicking “Accept All”, you consent to the use of ALL the cookies. However, you may visit "Cookie Settings" to provide a controlled consent.
We use necessary cookies to optimize our site. We’d also like to set performance cookies that help us make improvements by measuring how you use the site.
By clicking “Accept all”, you voluntarily agree to the data processing mentioned.
The cookies collect information in a way that does not directly identify anyone. For more information on how these cookies work please see our ‘Cookies policy’.
Necessary cookies are used for activities that are strictly necessary to operate or deliver the service you requested from us and, therefore, do not require you to consent. They enable core functionality such as security, network management, and accessibility.
Performance cookies enable improved functionality and personalization and help us measure traffic and analyze your behavior with the goal of improving our service. This means that our services may not work properly if they are disabled.


 Source: