Bitbucket Statistics Dashboards for Project Management in Confluence

In the blog post Handy Jira Dashboards for Project Management in Confluence, we told you how to use the data from Jira to create dashboards for agile project management on your Confluence pages.
Using Confluence as the place for dashboards allows you to achieve better end-to-end visibility: it enables merging and aggregating data from different sources and makes it easily accessible to Leadership. Furthermore, you can export the reports in PDF, Word, JPG, or print them out and email them to external users, attach them to the quarterly report, or distribute them to managers and stakeholders.
Today we want to show how you can enhance your reports built with Table Filter and Charts for Confluence by adding engineering metrics from Bitbucket using the Awesome Graphs for Bitbucket app and build dashboards for PMs and stakeholders in Confluence. These metrics make up a comprehensive view of the processes and help managers make informed decisions.
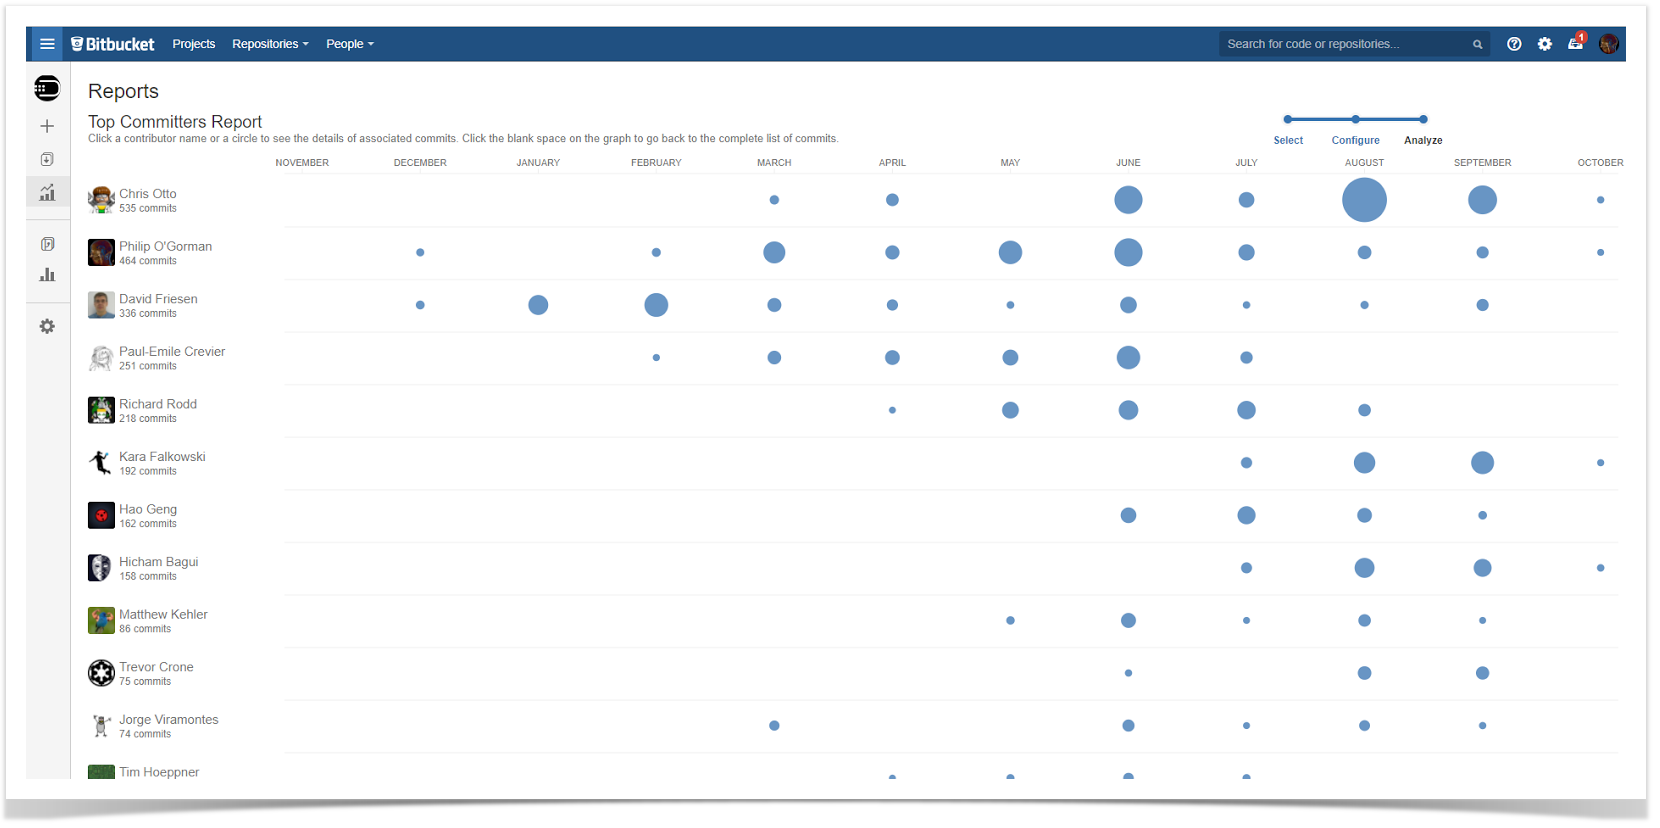
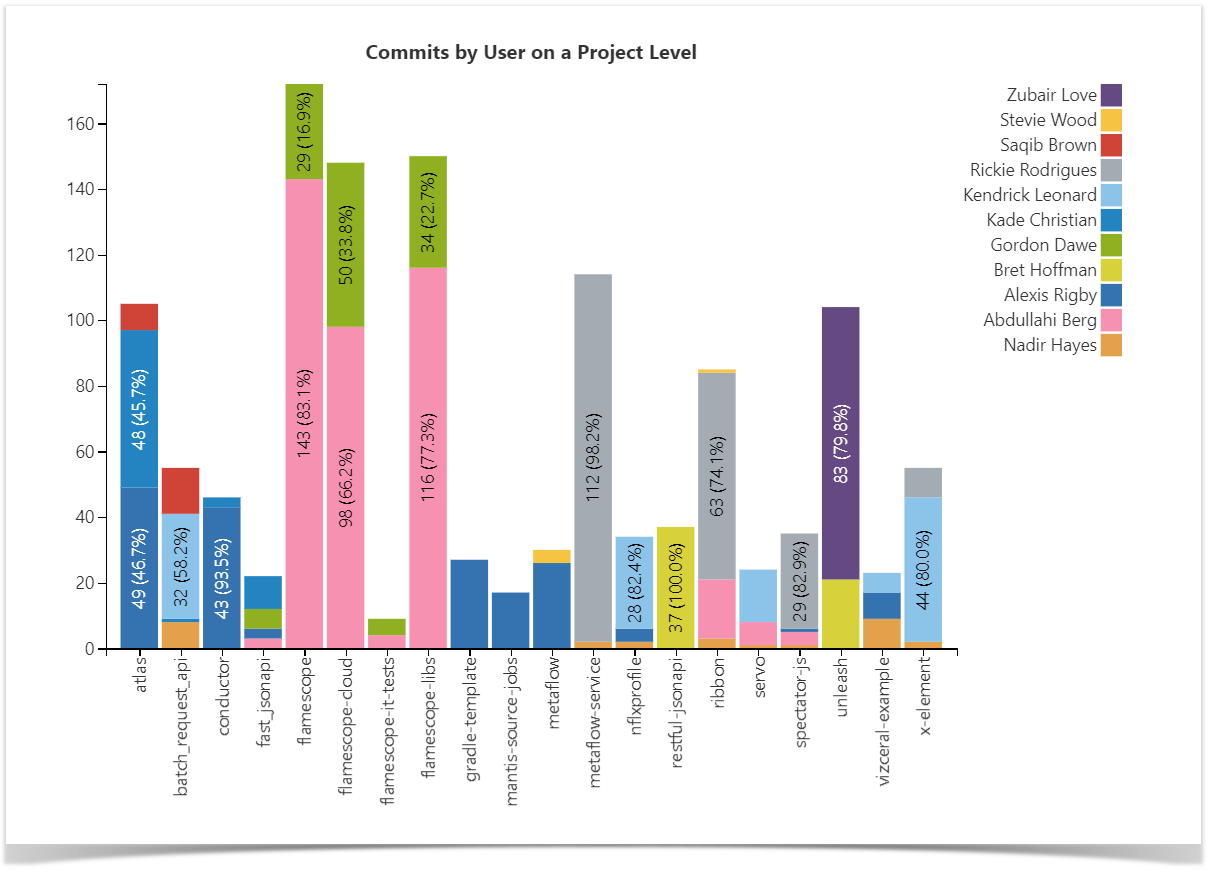
Commits by User Chart
This chart is aimed to show you which developer worked on which project and their level of activity in terms of the number of commits so that you can identify the top contributors for each repository. You can also find the most active repositories in the whole instance, particularly for a specific project. This data can help you decide which repositories to target first with particular process improvement.
Check out a full guide on how to build this chart.
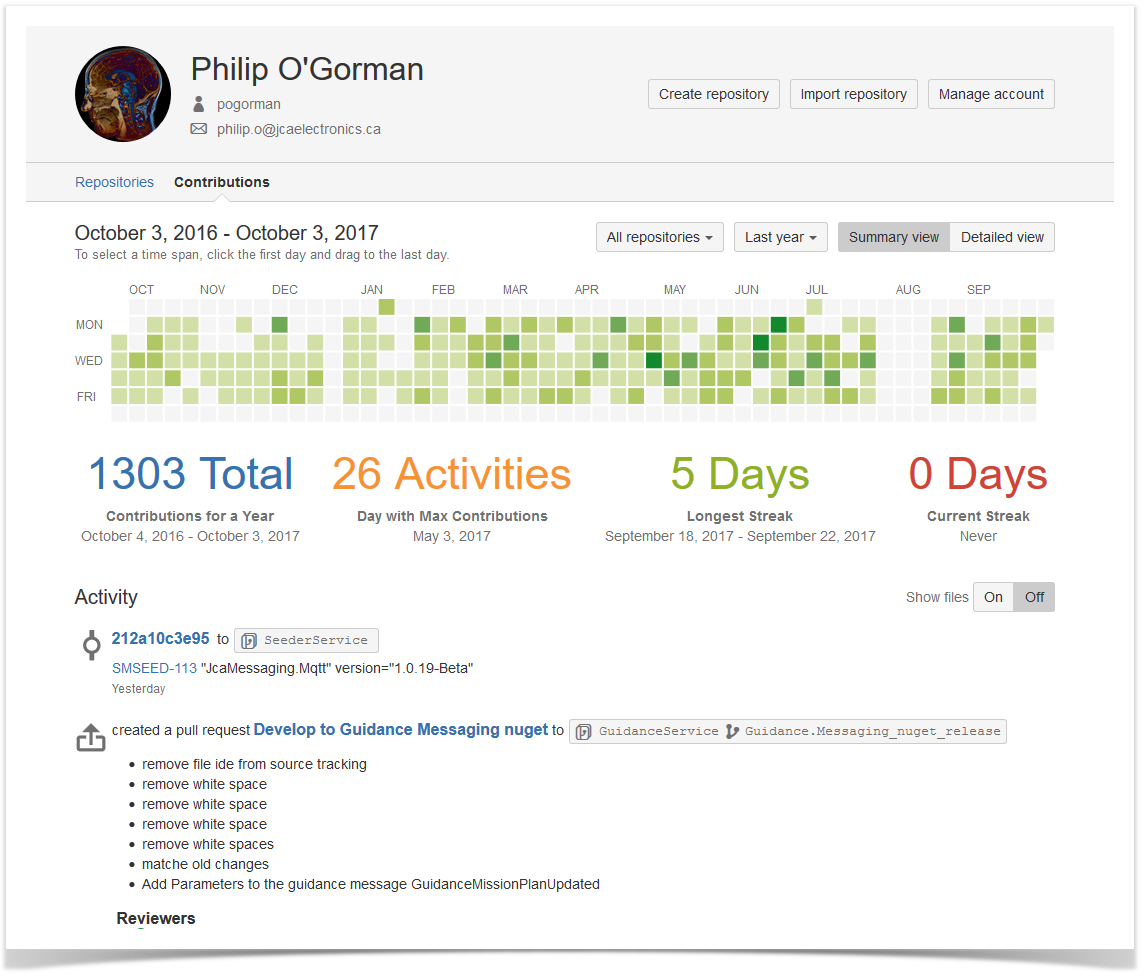
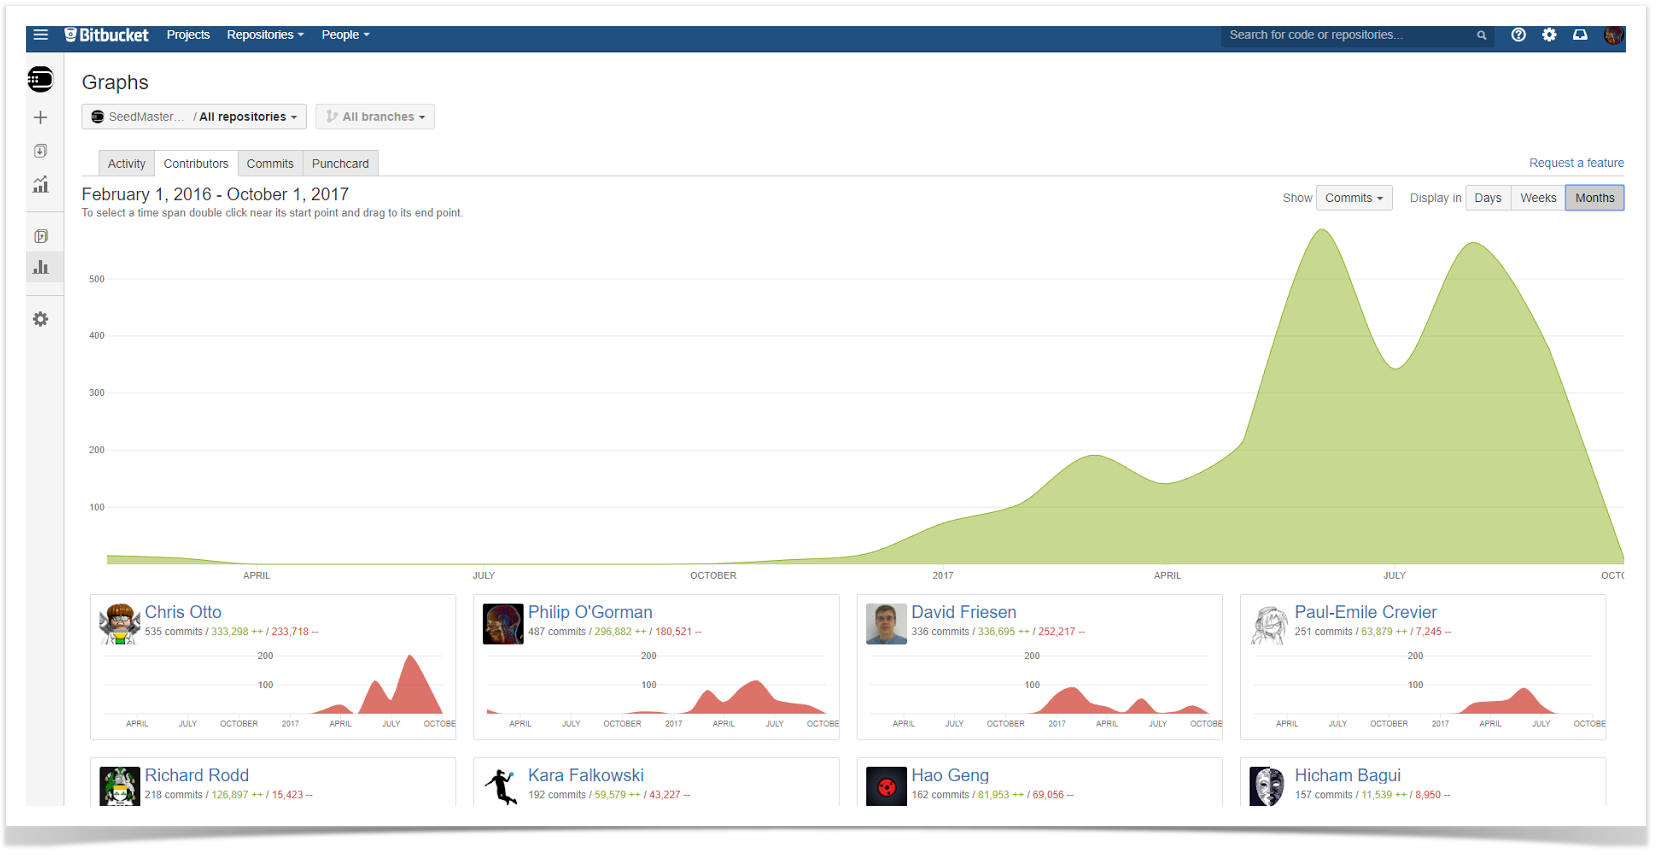
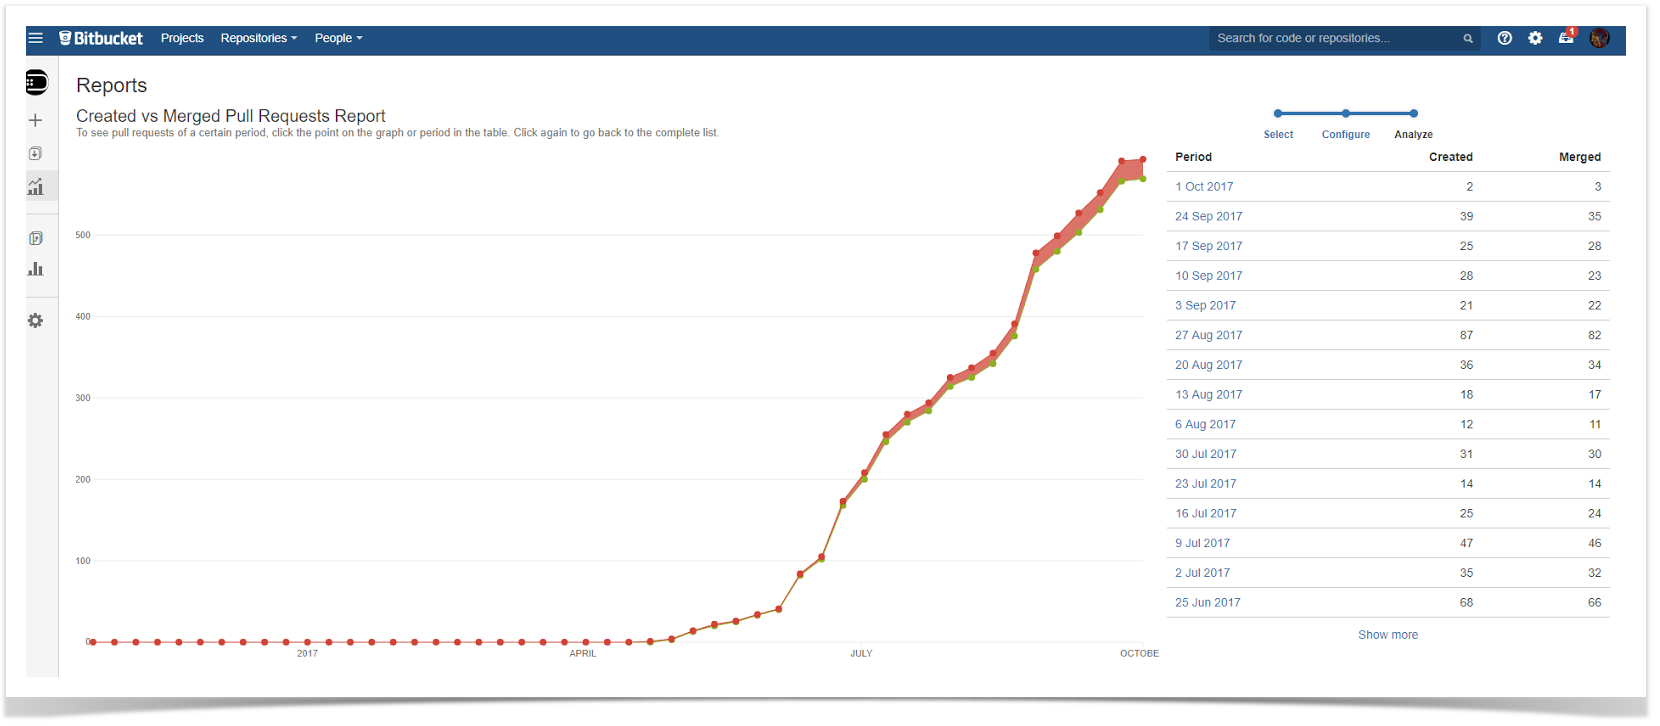
Commits Dynamics Chart
There may be cases when the snapshot is not enough, and it’s necessary for planning to see the actual change in progress. To examine trends over time, you can build the chart that will show the dynamics of contributions made by users over the chosen period. Using this, you can then compare the periods and answer questions like “Are we committing more code now than before?”.
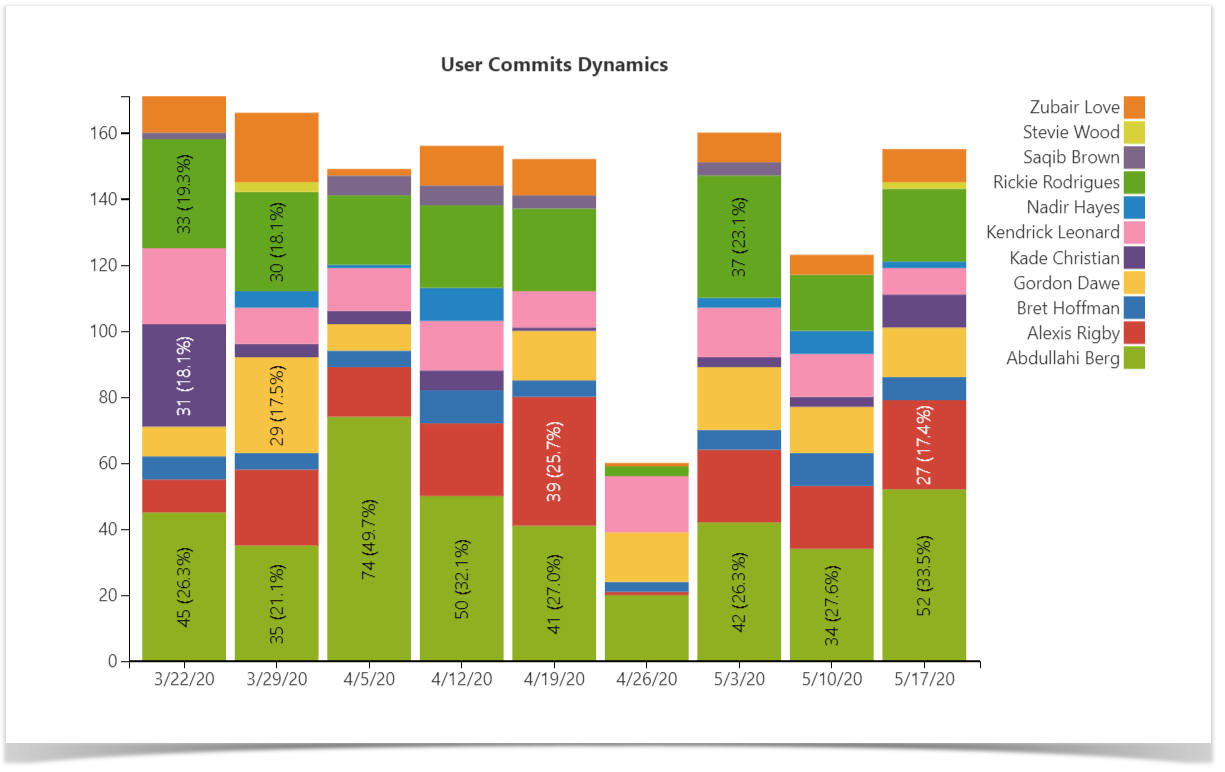
Follow our guide to build this chart.
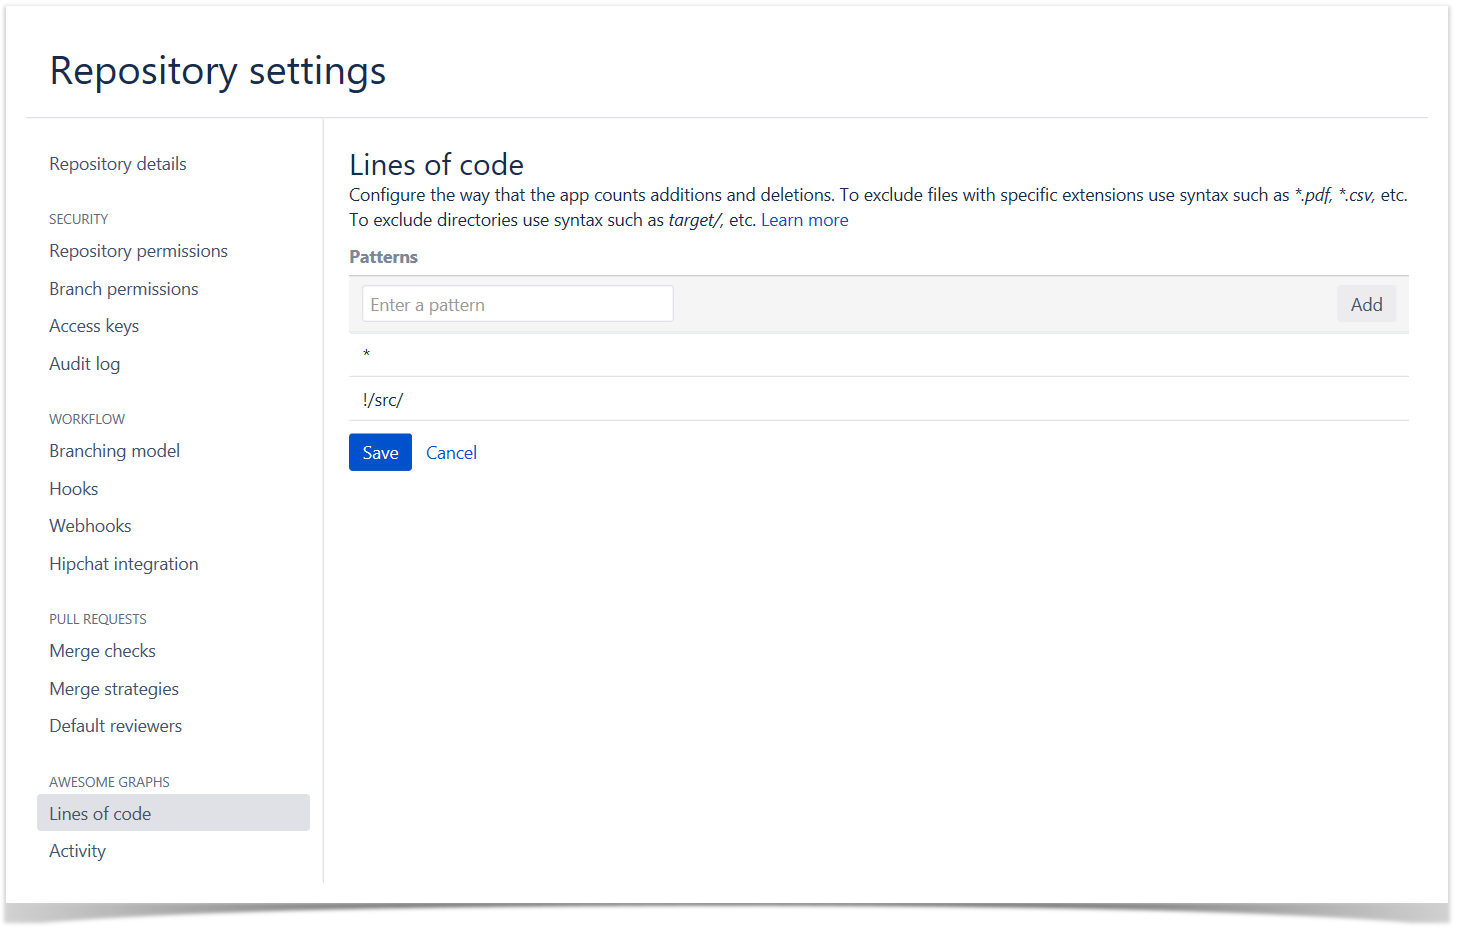
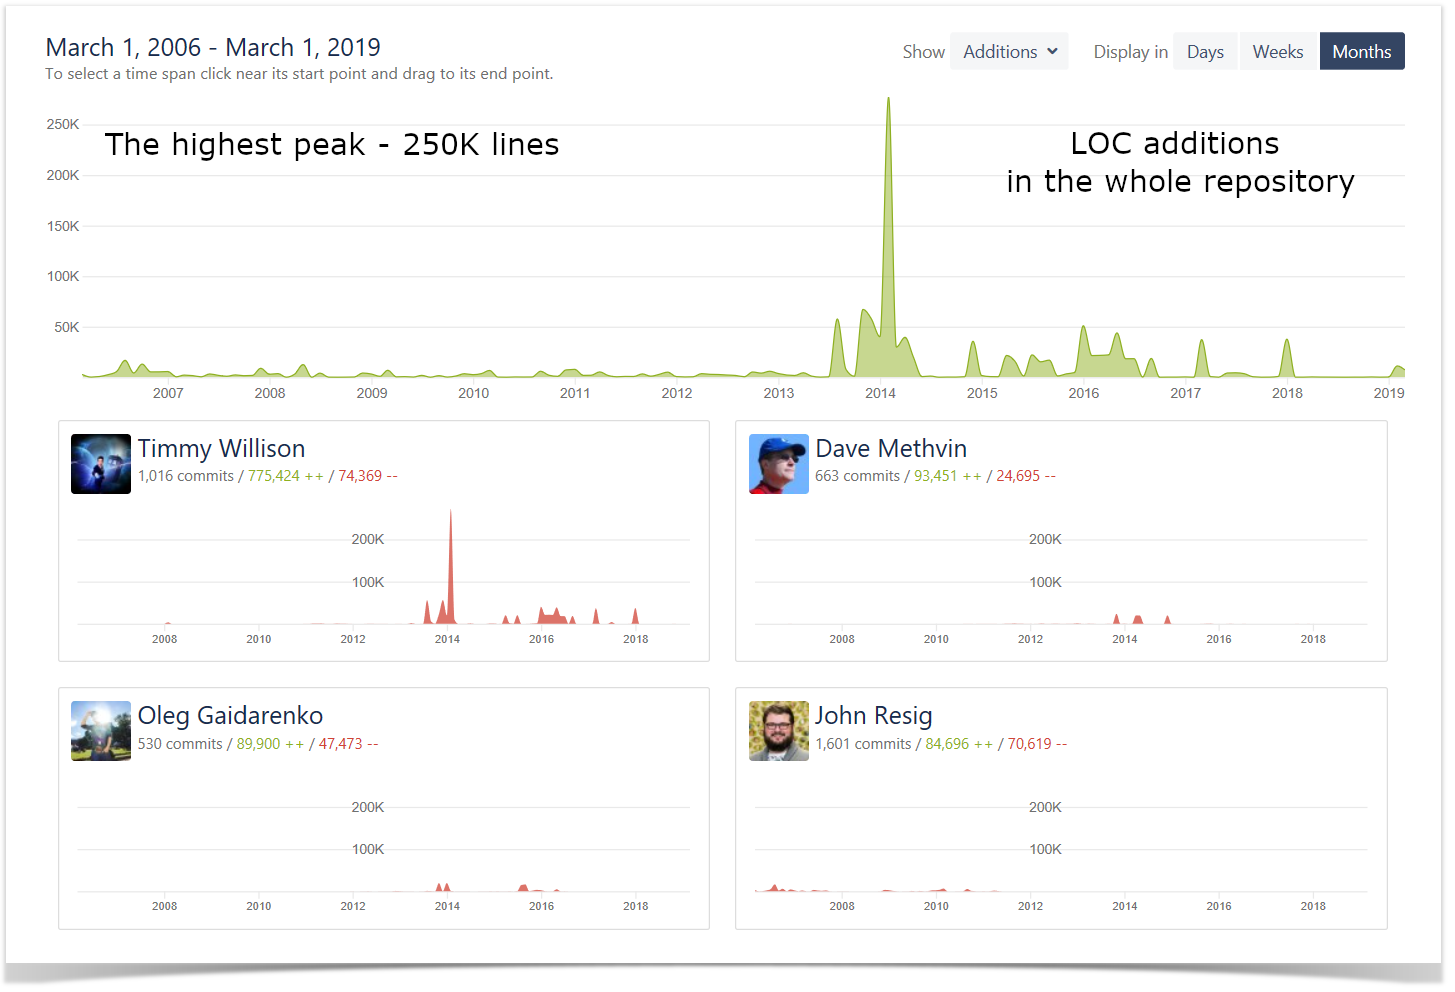
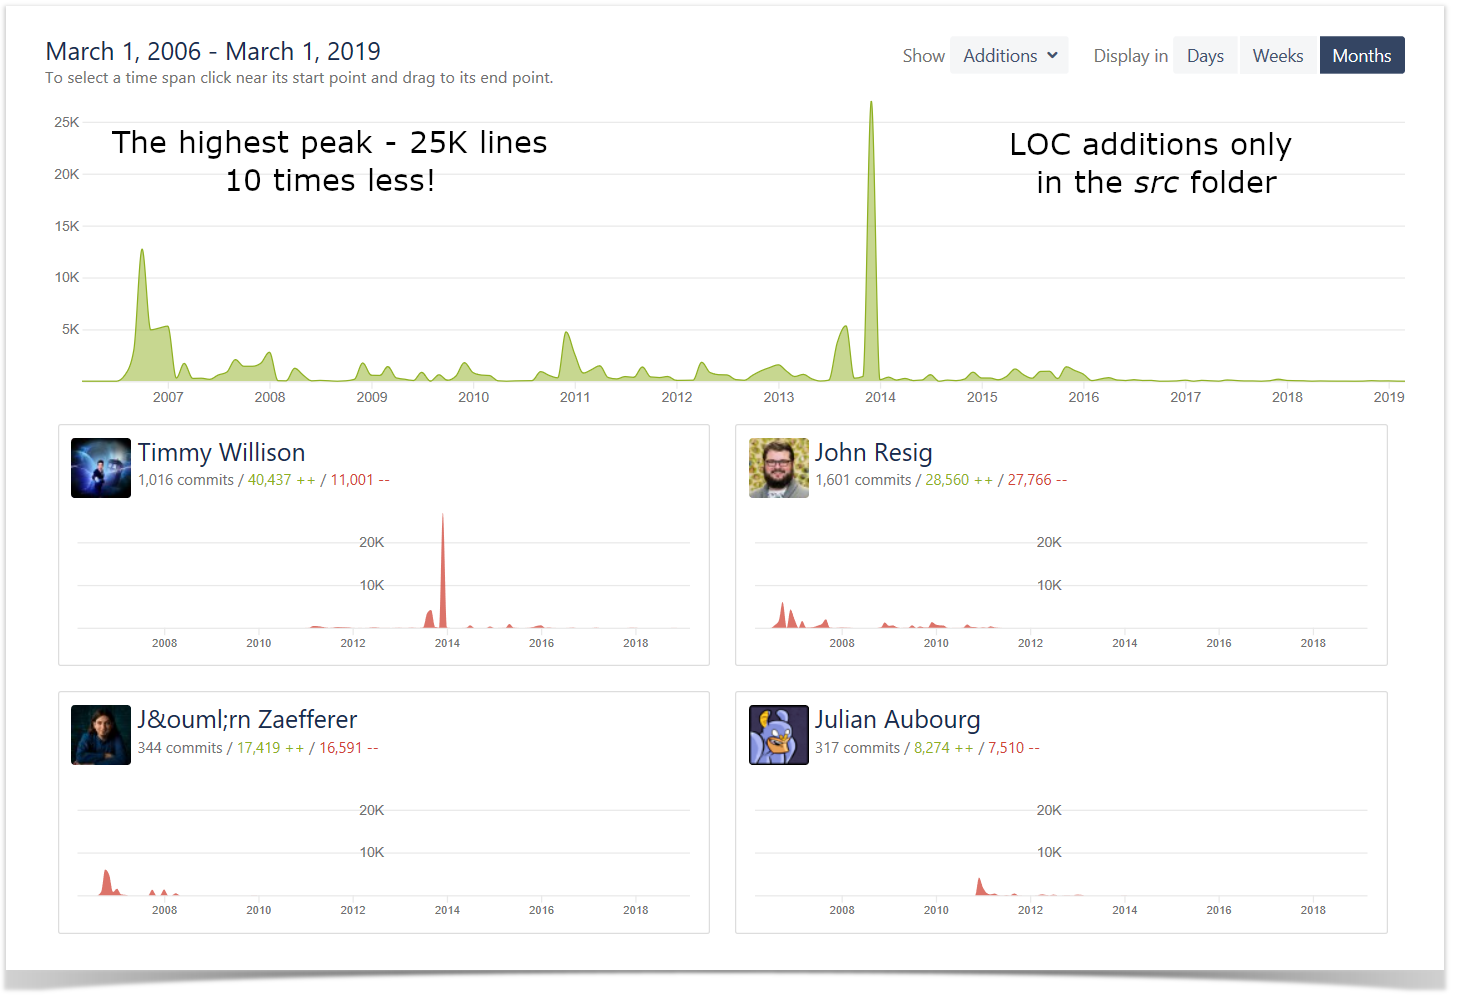
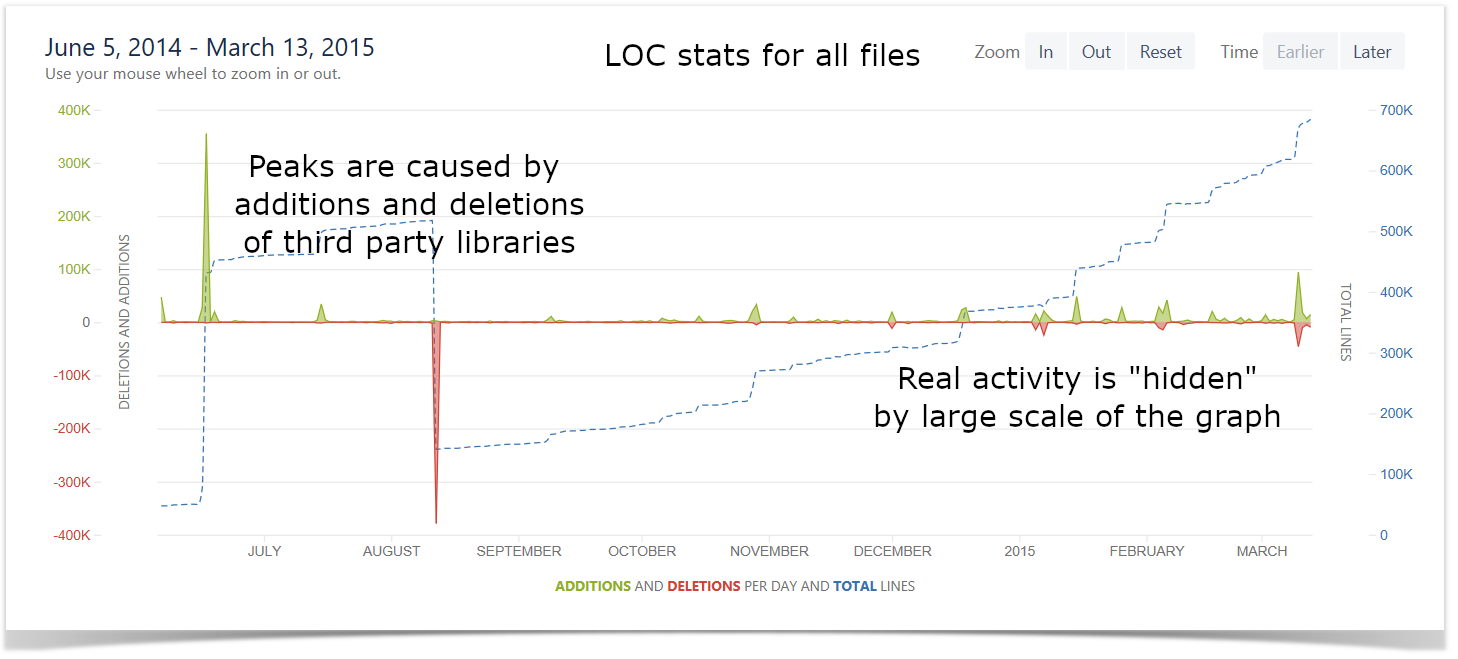
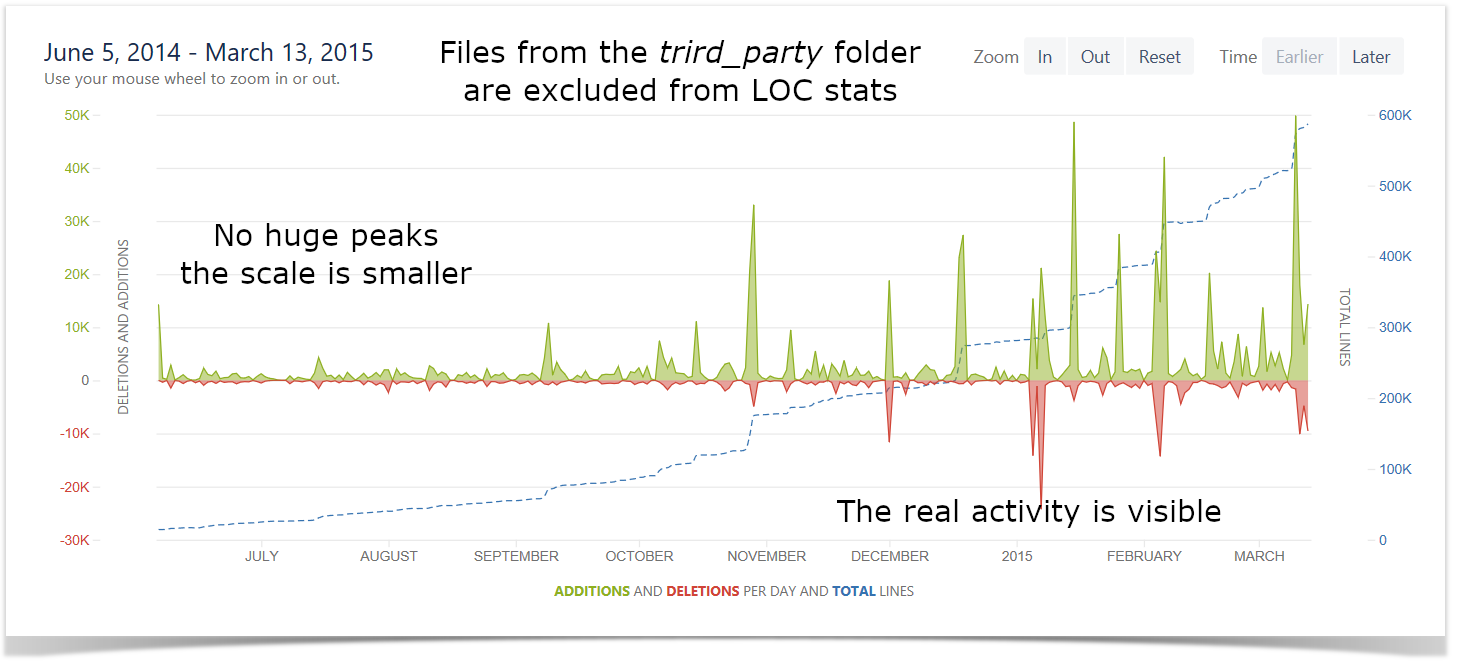
Lines of Code Chart
Another way to get a better understanding of the amount of work done across the projects and measure the activity and efficiency of the teams is to look at the number of lines of code added and deleted. On this chart, you can see the visualized statistics of the user’s activity in terms of lines of code on the project level.
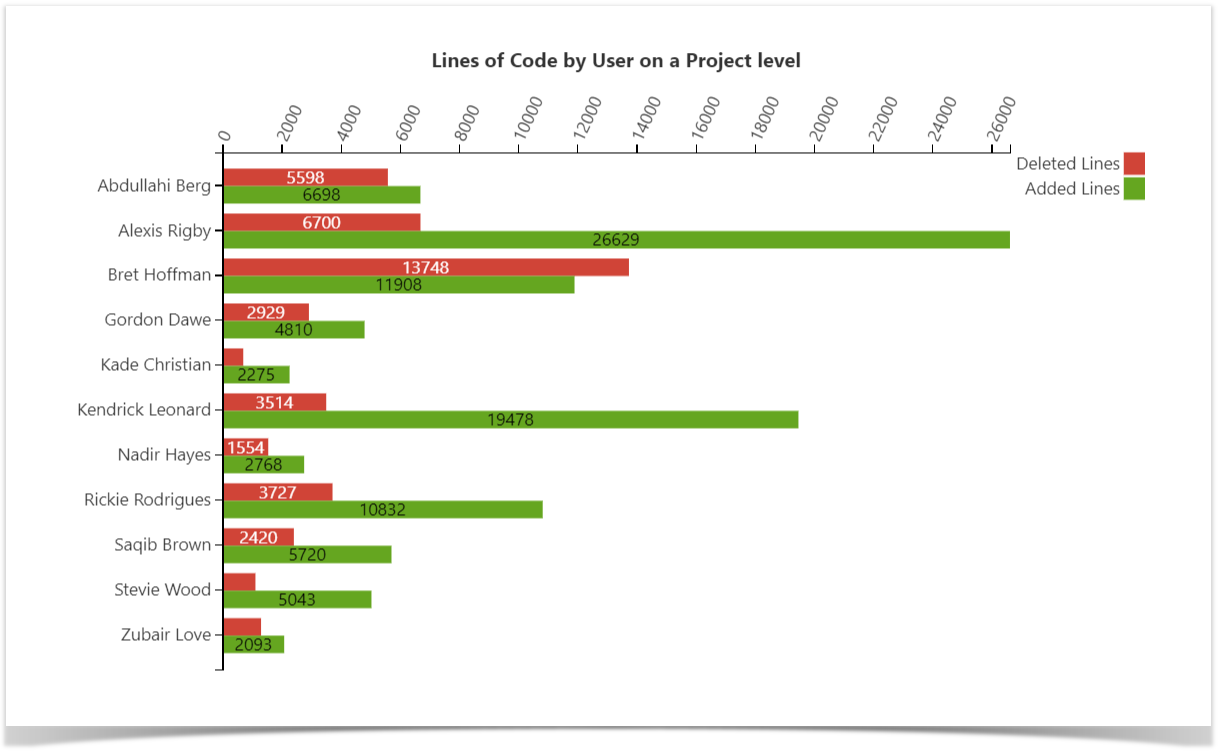
Read the step-by-step instructions to build this chart.
Pull Requests Activities Charts
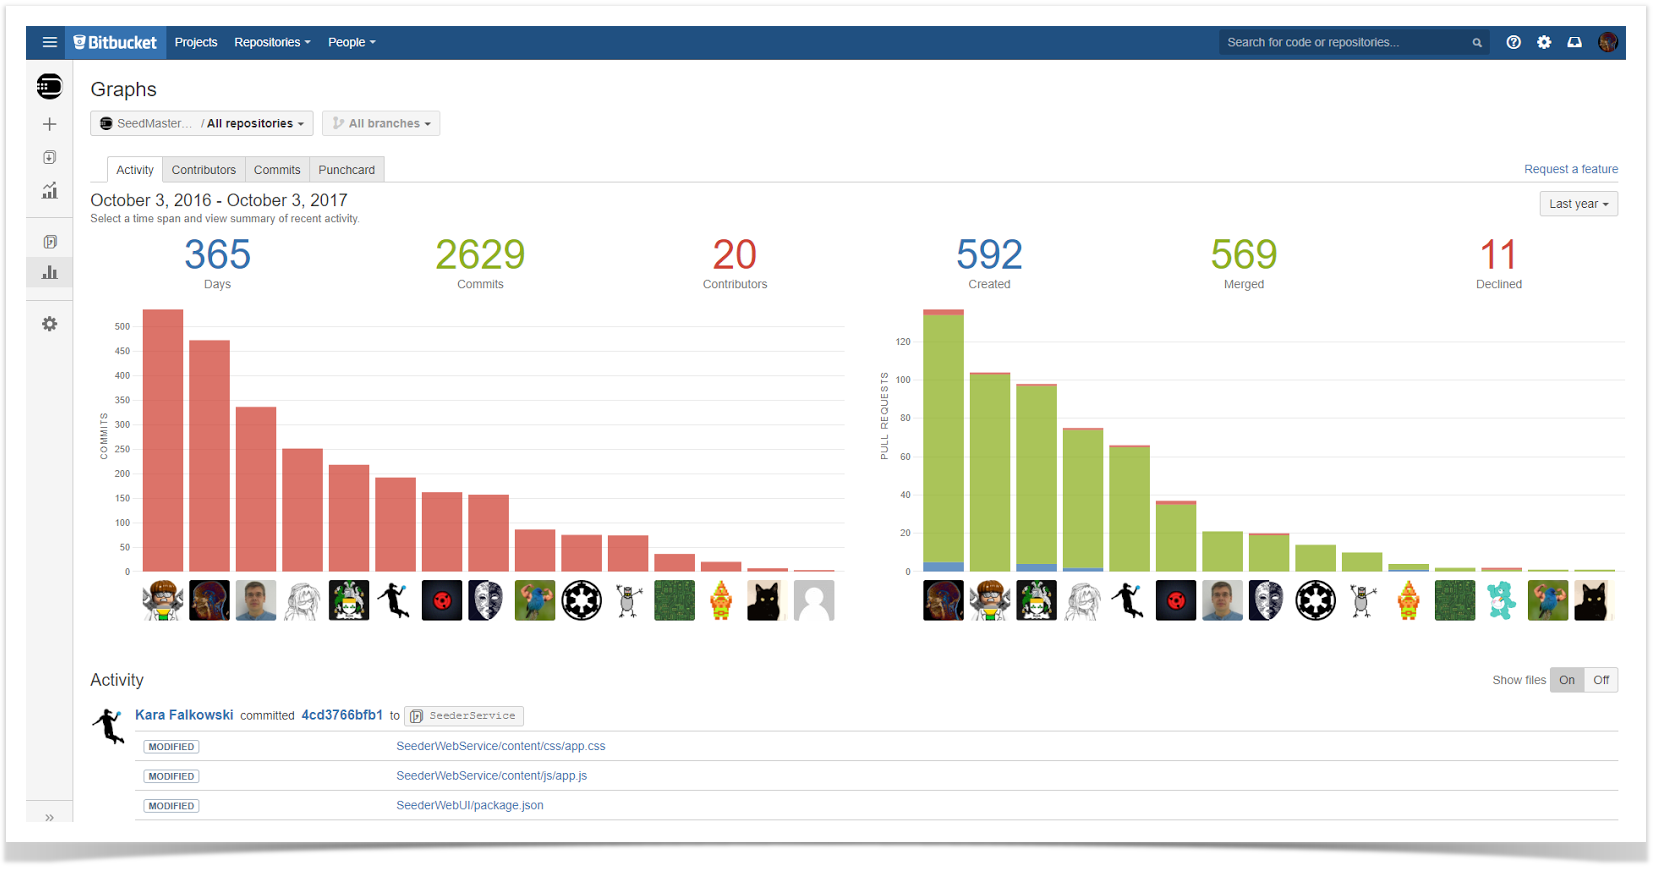
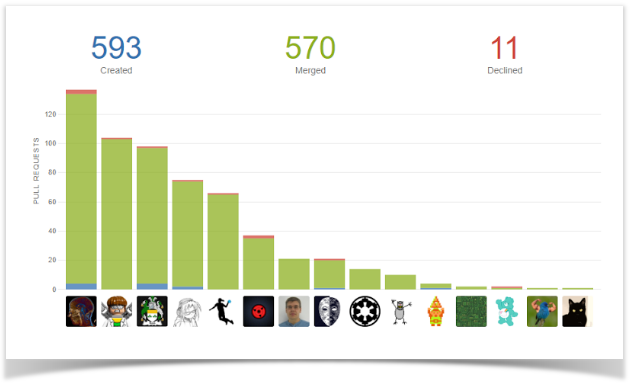
To complete the picture, you can use the two following graphs showing the Pull Request activities of the developers, i.e., the number of Open, Merged, and Declined Pull Requests on the project level basis.
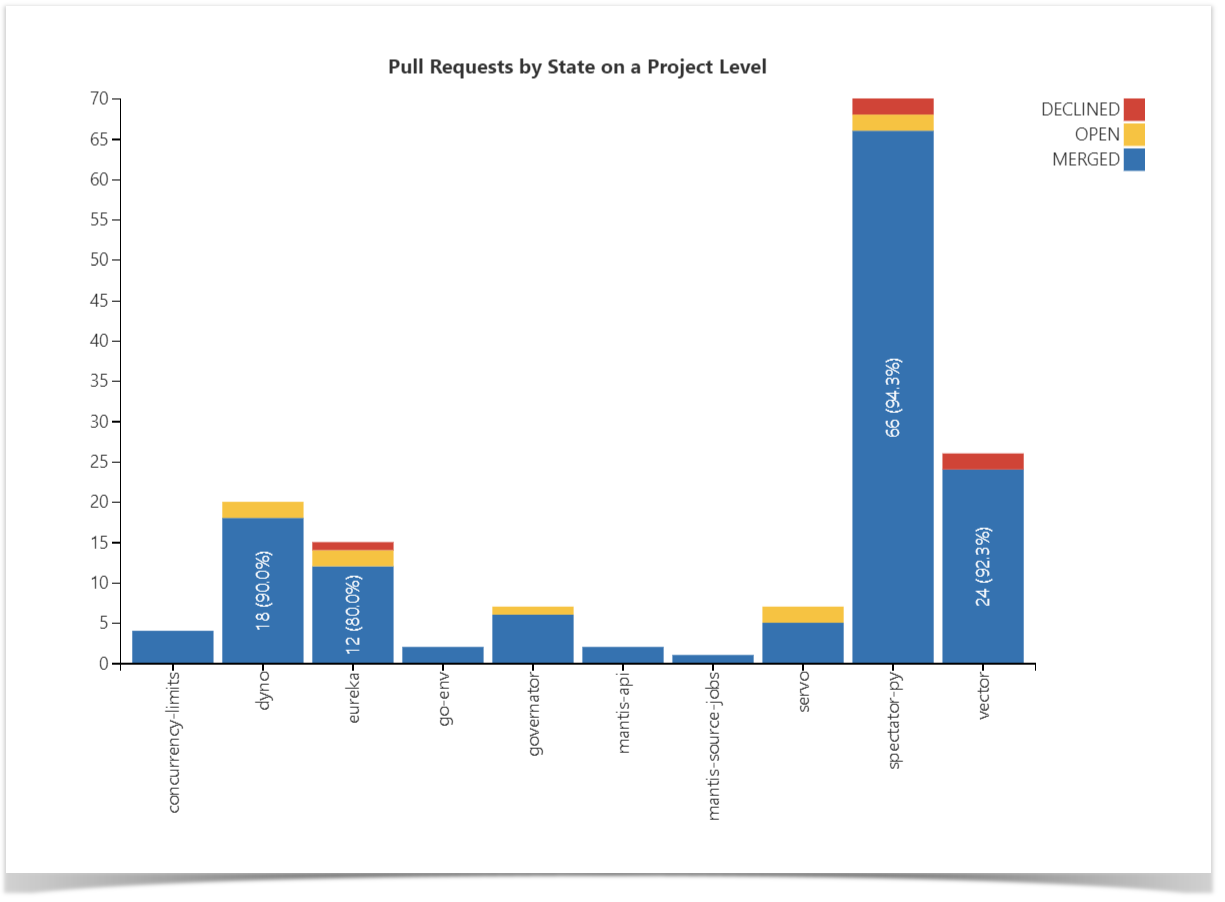
The first chart provides you with an organizational view and allows you to visualize the statistics across multiple or all of the repositories, grouping the Pull Requests by their state.
You can then drill down for more detailed data and build the chart to discern the output and productivity of each particular user:
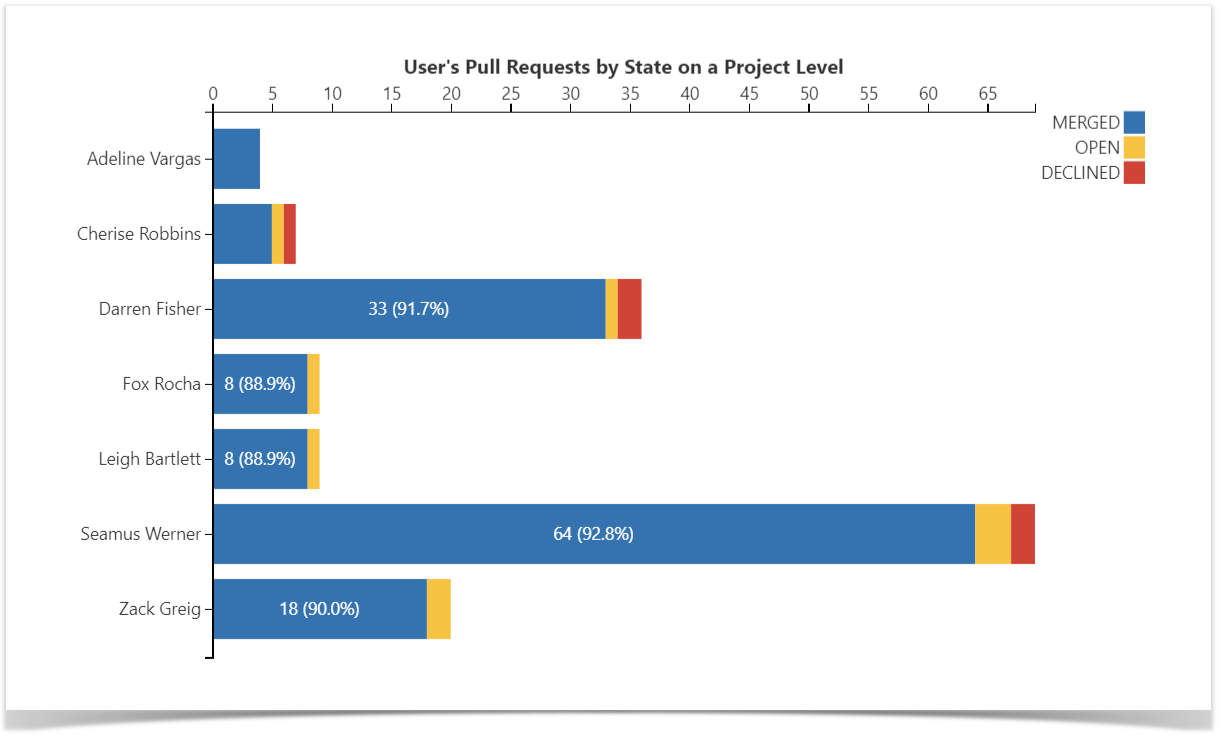
Learn how to build these charts.
Enhance your reports
Using the charts described in this article, you can analyze engineers’ activity and productivity, evaluate the capacity to work, and make data-driven decisions to improve engineering efficiency.
All of the charts on this page were built with the help of Table Filter and Charts for Confluence as the means of aggregation and visualization and the Awesome Graphs for Bitbucket app serving as a data provider.
The combination of these apps is capable of building much more complex structures that would allow you to aggregate all the information in a single dynamic chart, where you could choose and change the components on the go to get different visualizations each time in a few clicks.