


Confluence Cloud has evolved far beyond a traditional documentation platform. Today, many organizations use it as a central workspace for operational reporting, project tracking, dashboards, and knowledge sharing. At the…
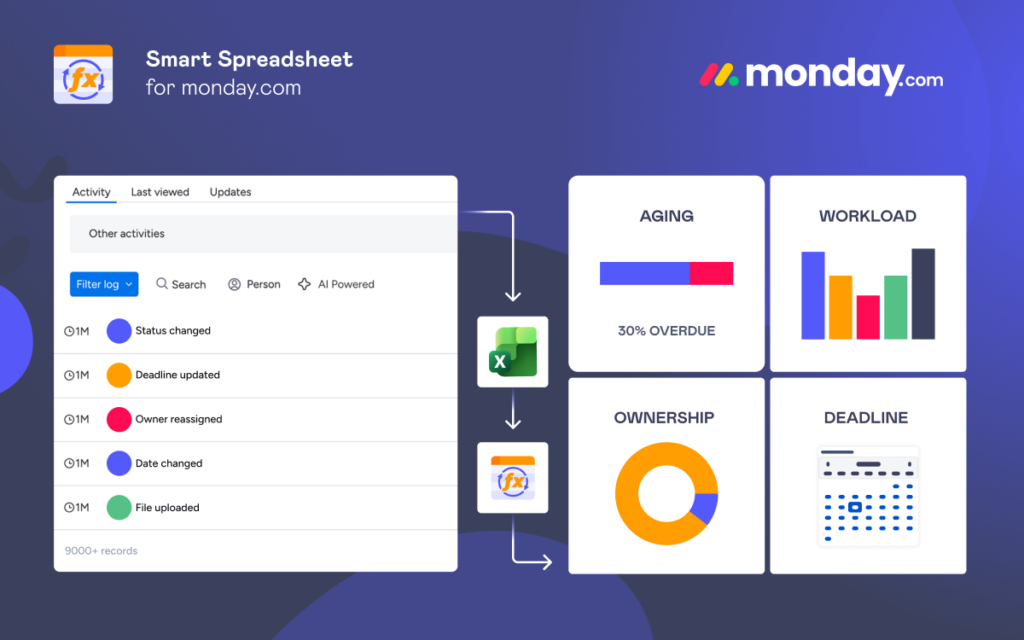
As teams scale and work becomes more complex, relying on individual boards alone is no longer enough to understand what’s really happening across projects. Dashboards in monday are built to…
Tracking current and historical status distribution in monday.com is one of the quickest ways to identify bottlenecks, forecast delivery timelines, and keep stakeholders aligned. This blog post shows how to…
The Time in Status report helps teams identify bottlenecks and optimize project workflows. By generating this report, you gain instant visibility into how long each work item spends in every…
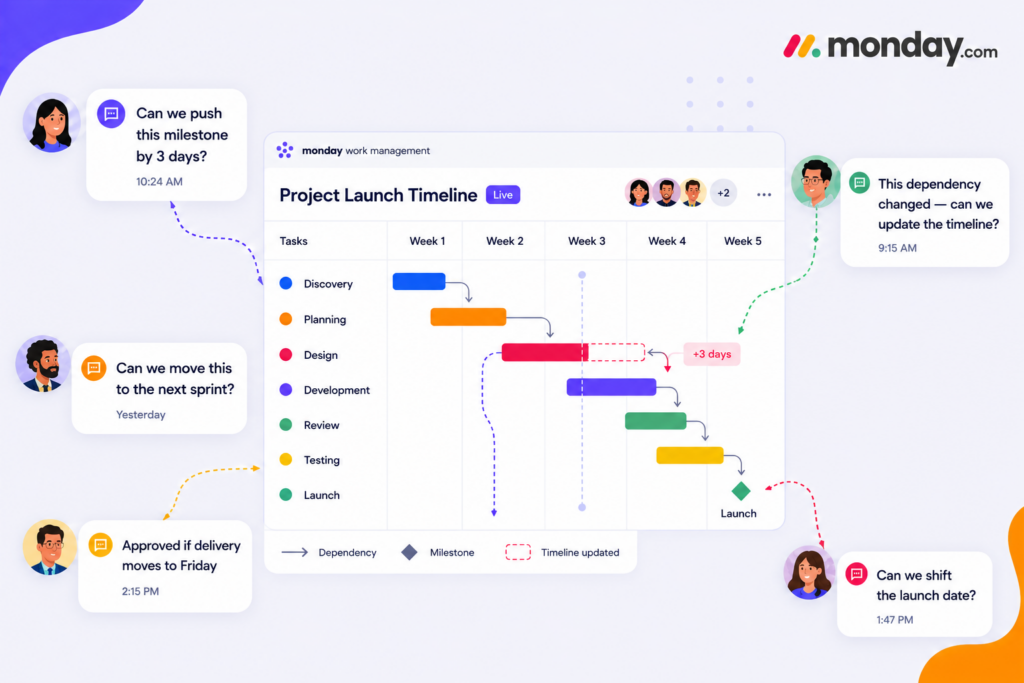
The Gantt chart is one of the most popular chart types. While it’s often associated with tracking IT projects, its use goes far beyond that. In practice, a Gantt chart…
No matter how long you’ve used monday.com, there’s always that one feature that makes you think, “How did I not know this before?” In this article, 10 Tips I Wish I…
What is the Time Tracking Column in monday.com? The Time Tracking column in monday.com is a built-in feature that allows teams to log and monitor the exact amount of time spent on tasks….