15K+
 4.9/5
 3M
Build a dynamic catalog of 550+ APIs from Confluence and Jira data — instead of maintaining an Excel table
Context and Challenge
The API catalog originally lived in Excel and was later moved to a regular Confluence table. As the number of APIs grew, maintaining a single master table manually became prone to human error.
The team needed a more scalable setup where information about each API could be maintained on its own Confluence page, combining API-specific information with data from the related Jira Epic, while still providing one up-to-date catalog of all 550+ APIs.
Result
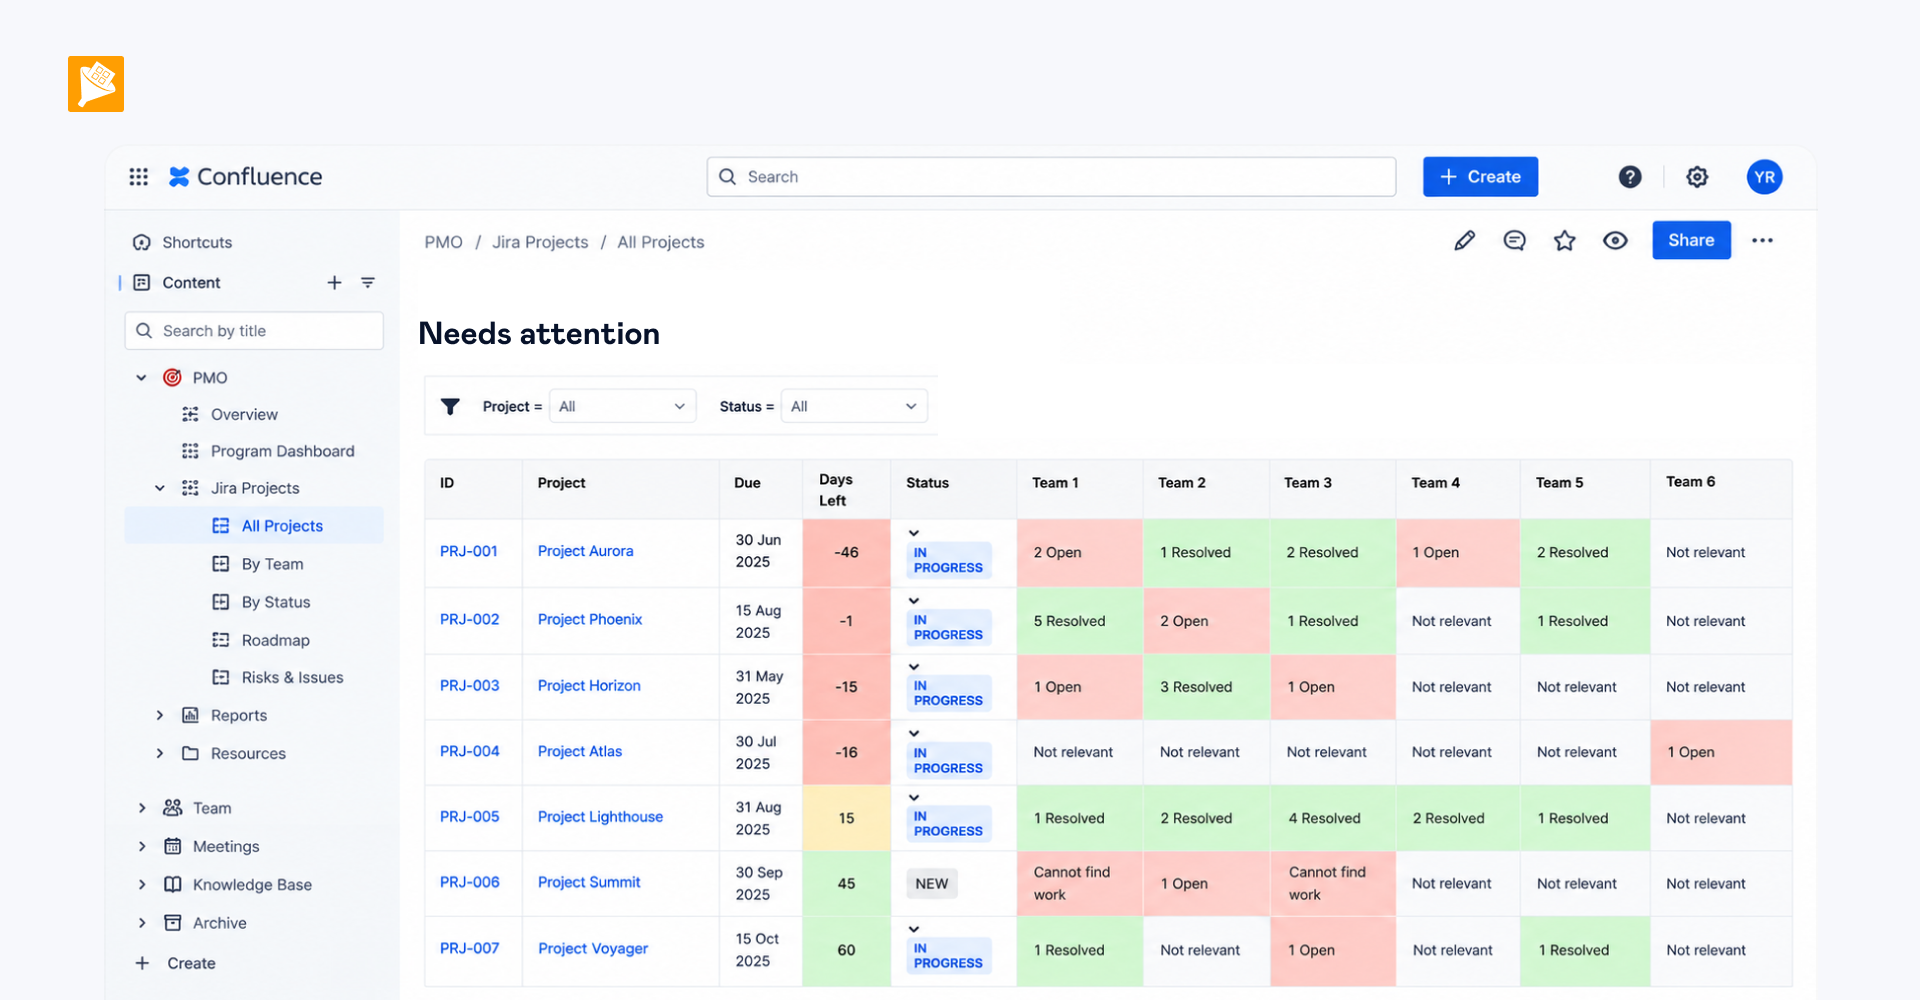
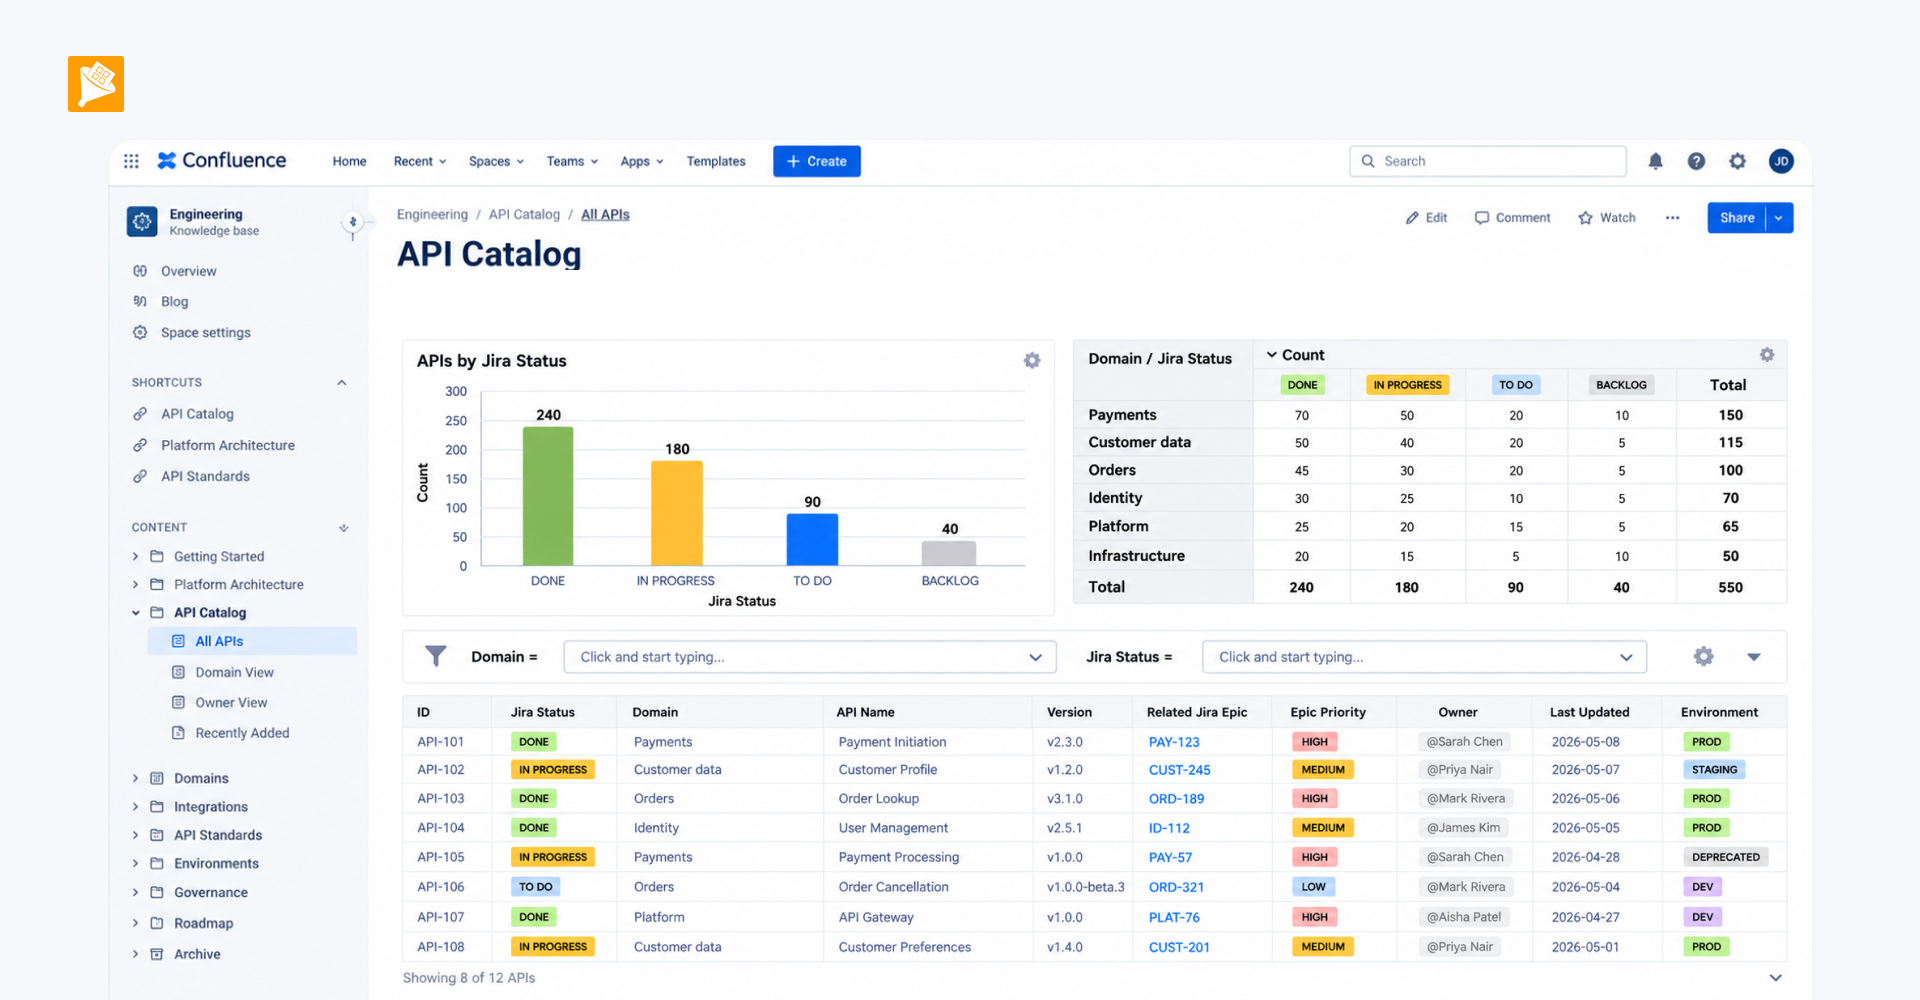
The team now has a dynamic catalog of 550+ APIs that serves as a self-service source of truth across the organization.
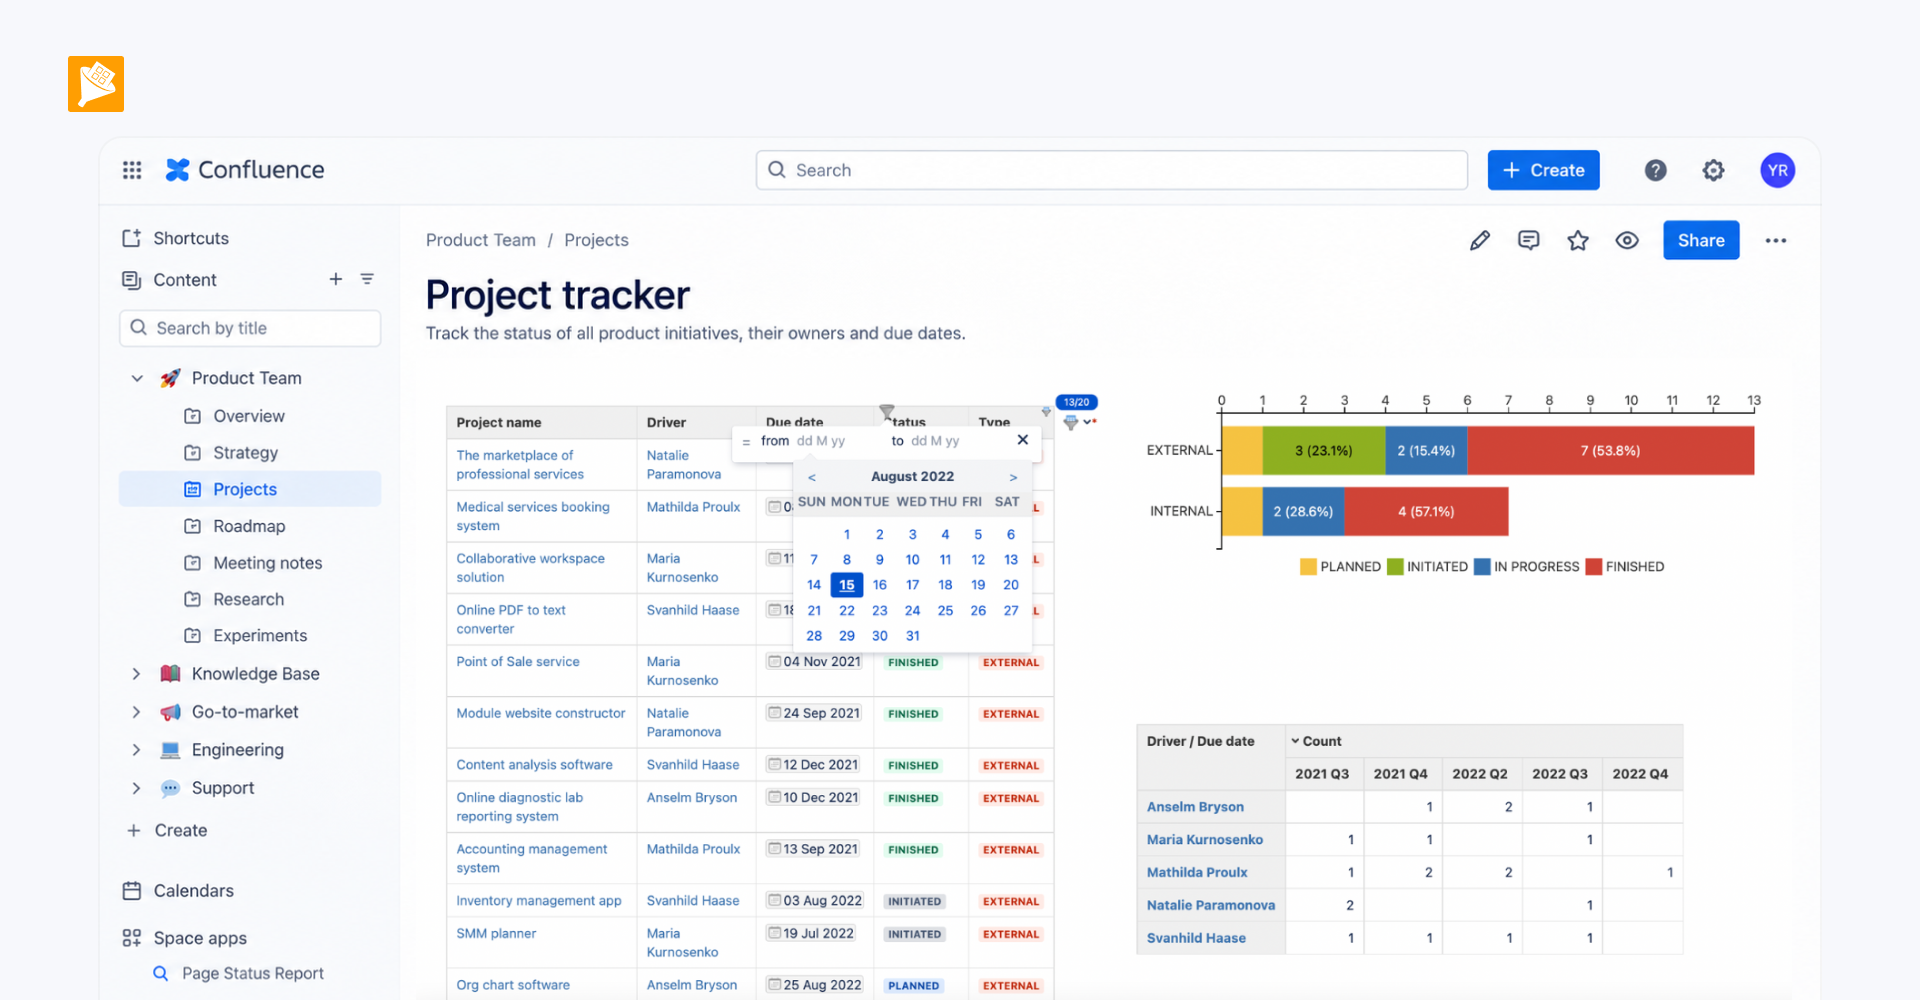
Users can search and filter the catalog to find the APIs they need, while the same consolidated data can be used to build aggregated views and charts. The catalog can also be exported to CSV for further reporting in Power BI.
How it is built
- Create a dedicated Confluence page for each API. Each API has its own page where the team maintains API-specific information in a structured table. Wrap the table in Page Properties or Table Excerpt so the data can later be collected and reused on another Confluence page.
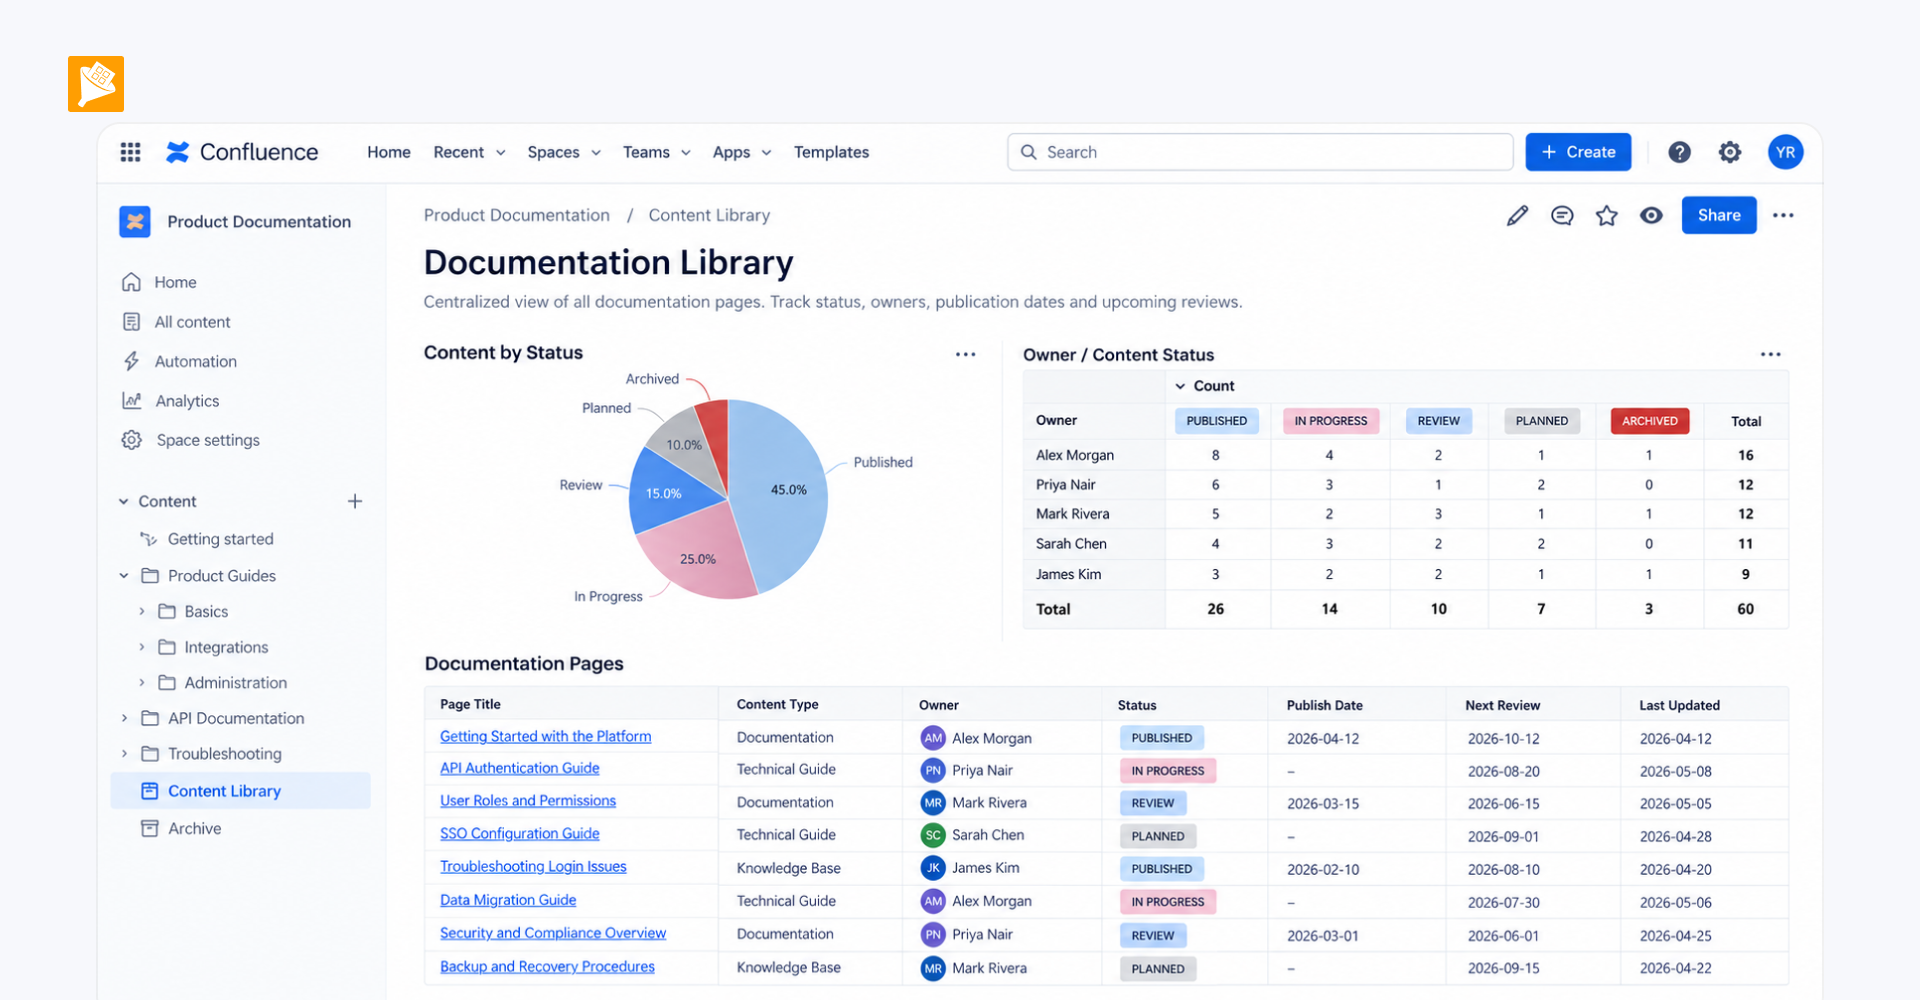
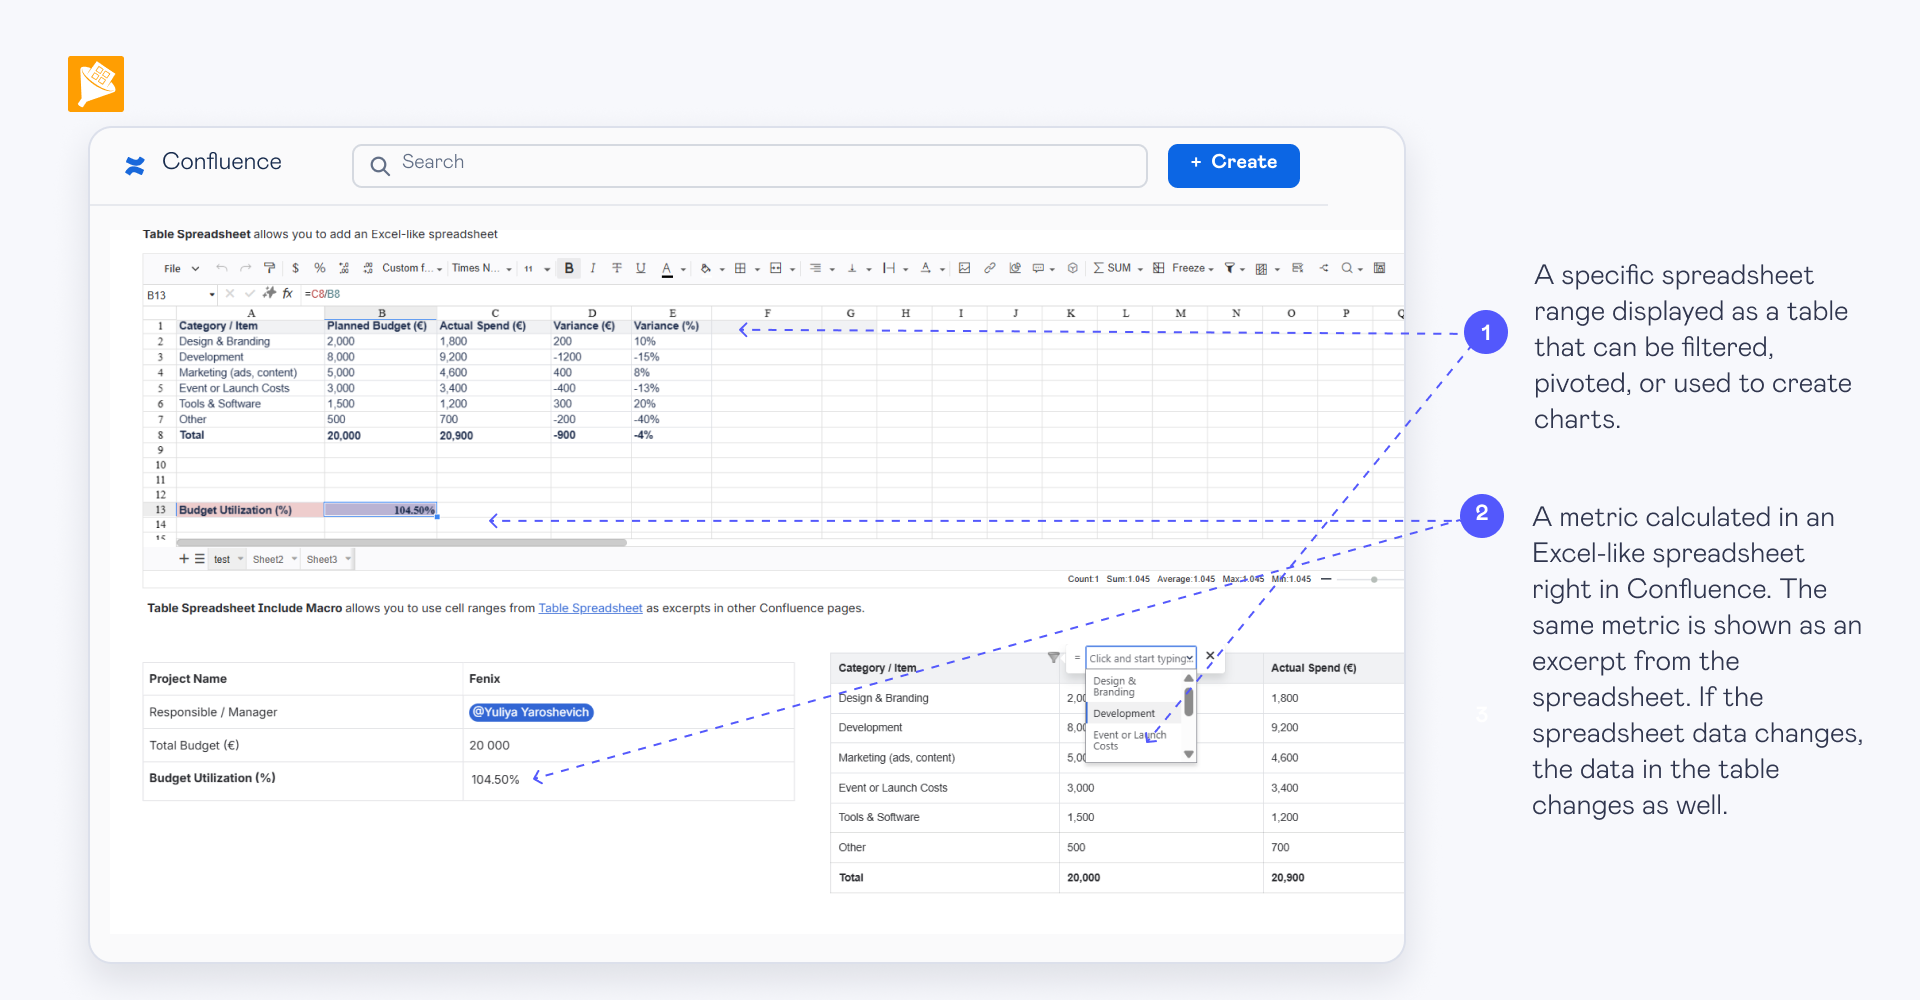
- Collect information from all API pages. Use Page Properties Report or Table Excerpt Include to pull structured information from all individual API pages into one consolidated table. Each row in the resulting table represents an API.
- Add Jira data for each API. Use the native Jira Work Items macro to bring Jira data onto the Confluence page. Then use Table Transformer and its SQL module to merge the Jira data with the consolidated API table, matching each API with its corresponding Jira Epic.
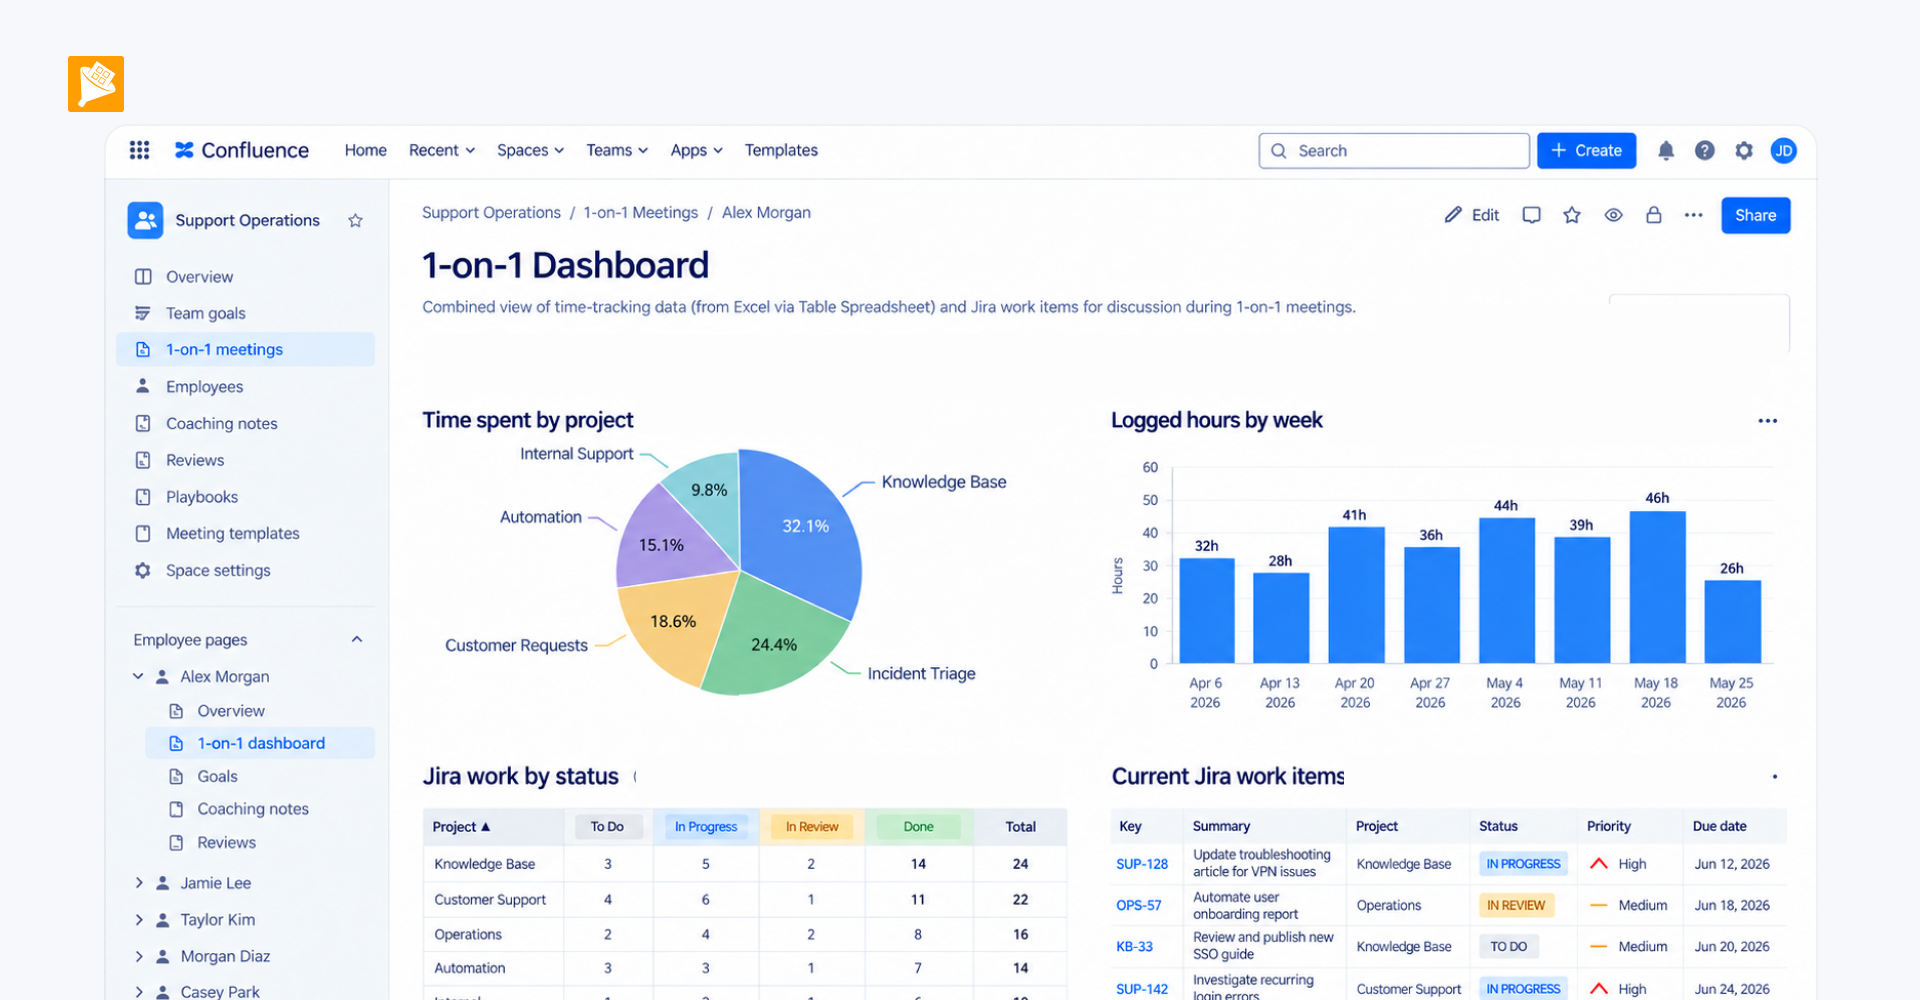
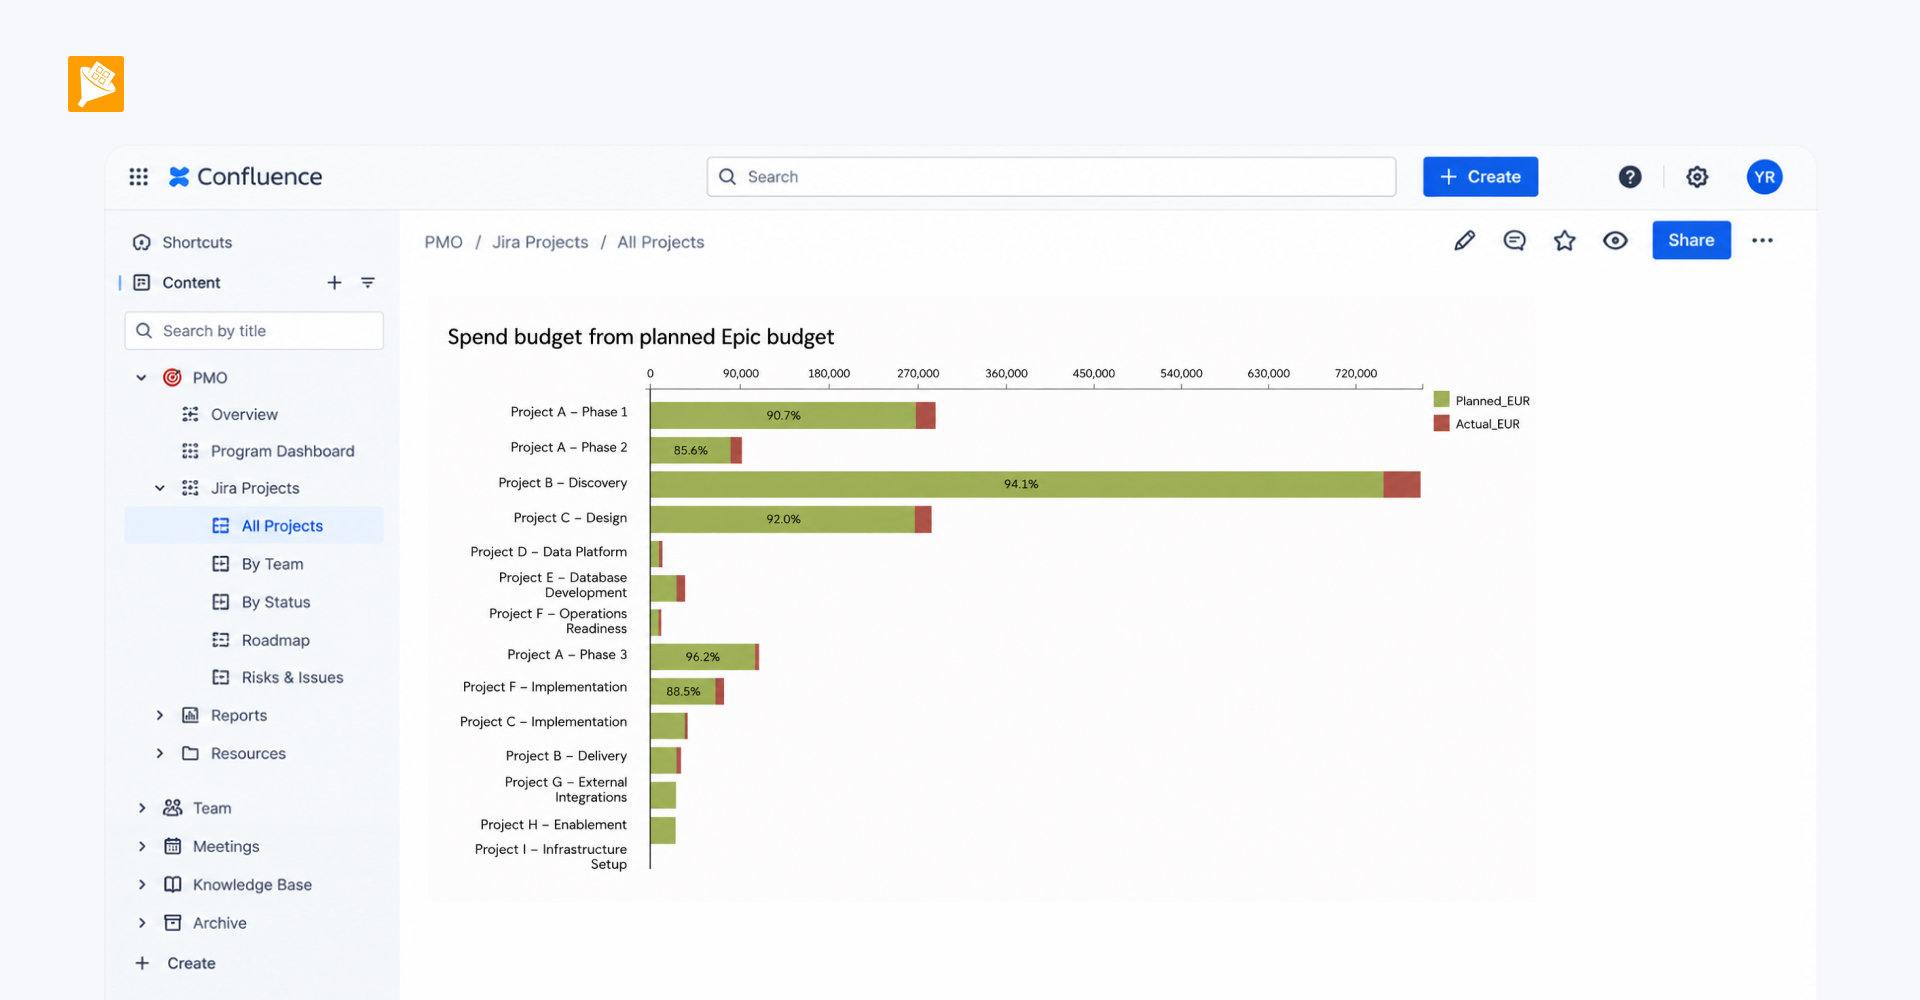
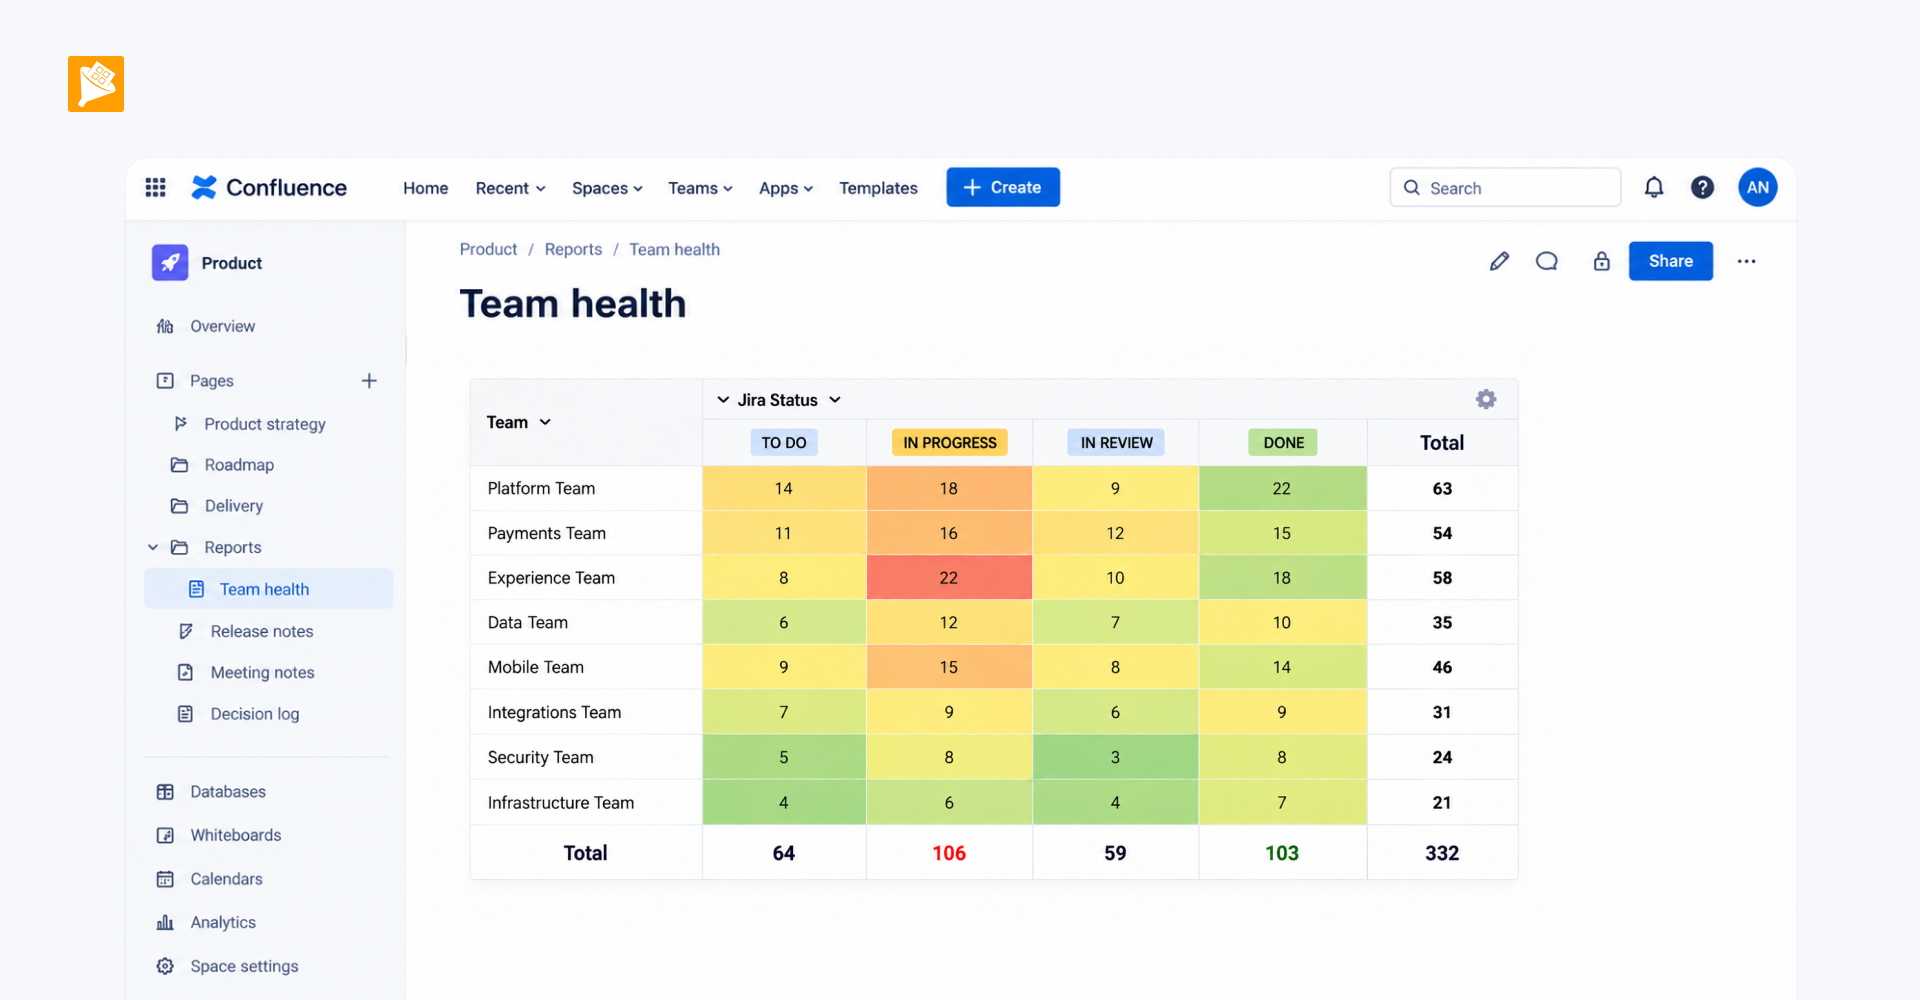
- Turn the consolidated data into a searchable API catalog. Wrap the resulting table in Table Filter so users can search the catalog and filter APIs by the fields relevant to them. You can then wrap the consolidated table in Pivot Table or Chart from Table to create aggregated views and charts, and reuse them across other Confluence pages.