15K+
 4.9/5
 3M
Manage content in Confluence with a centralized catalog and custom views by team, quarter, and more
Context and Challenge
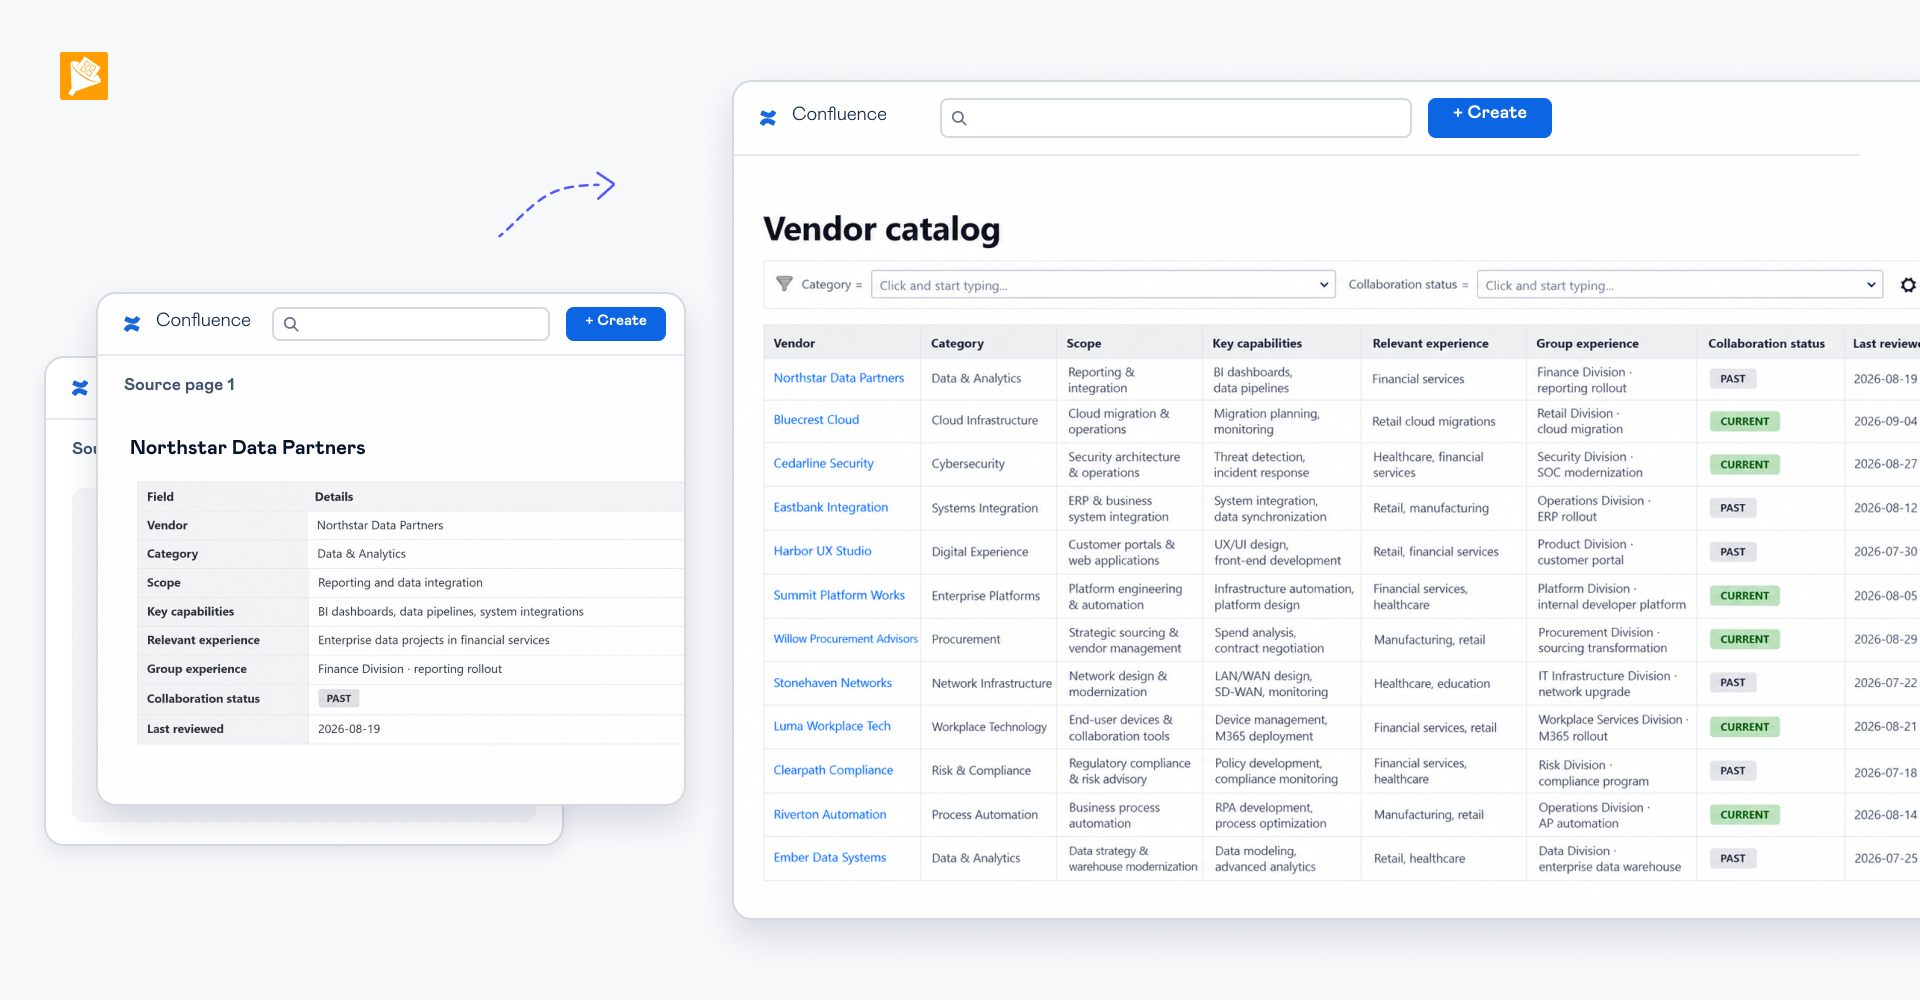
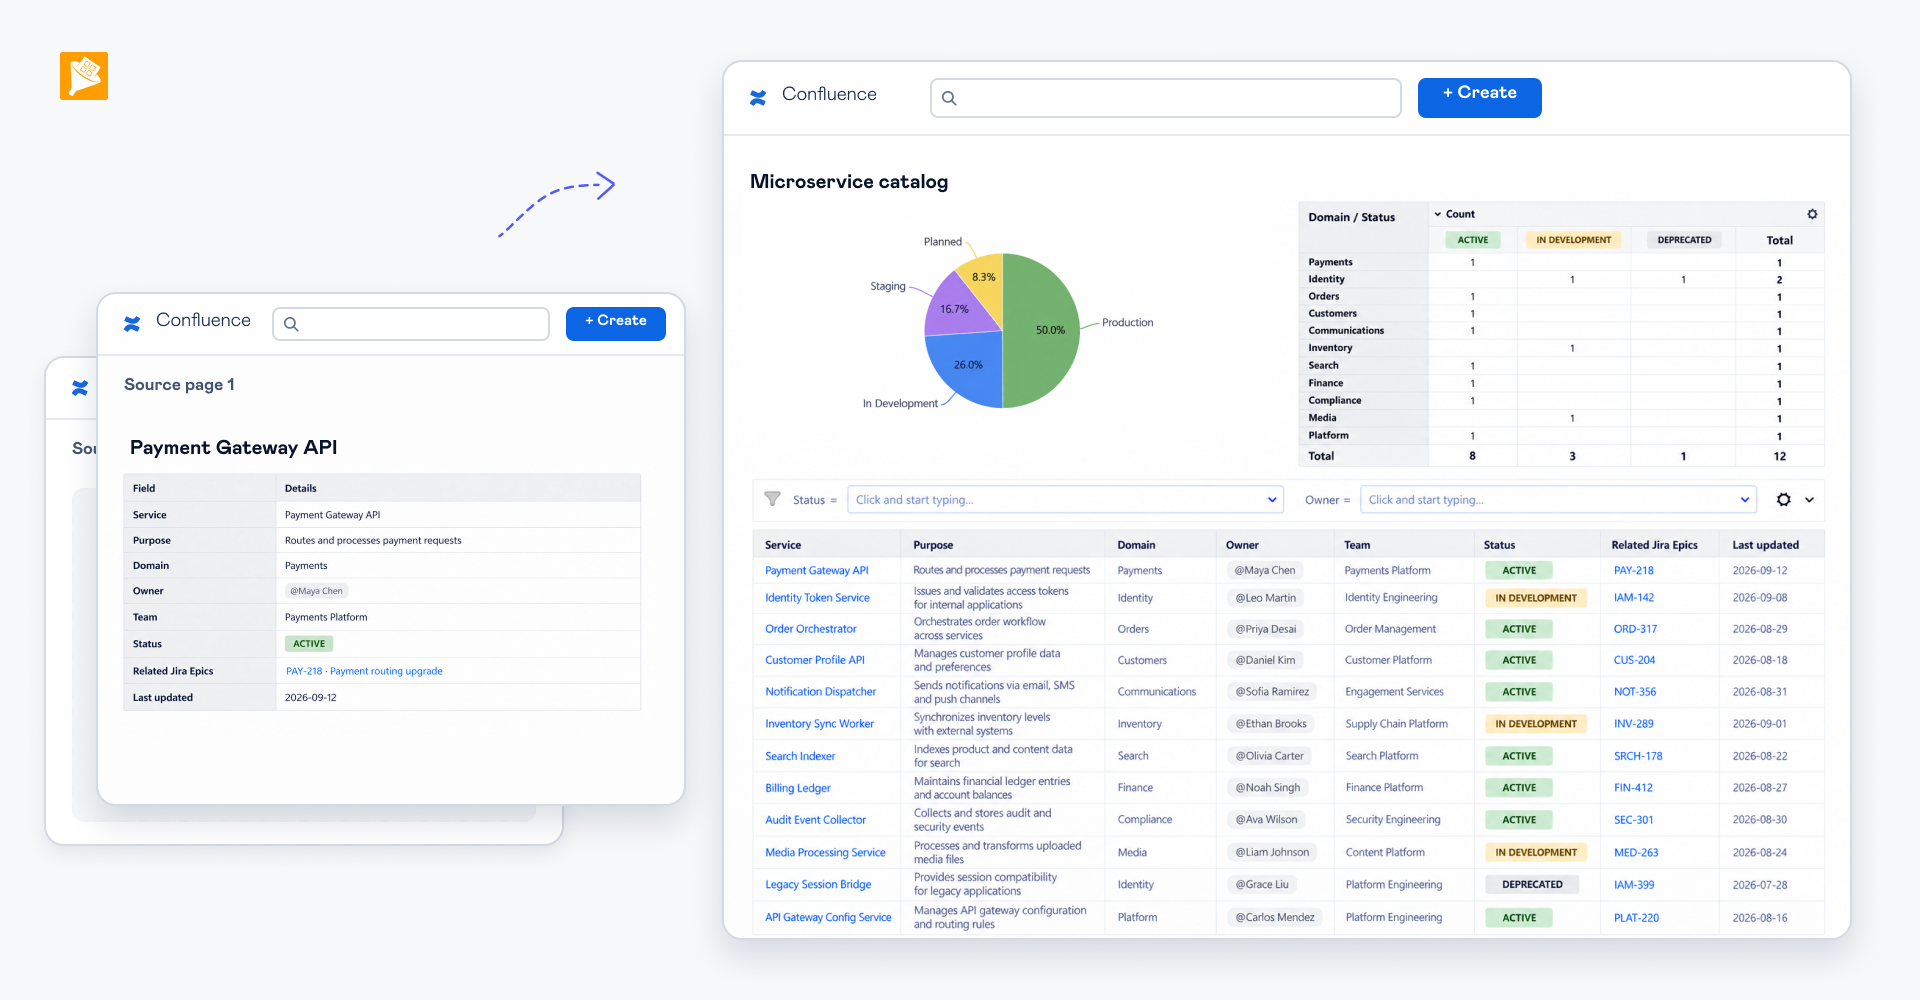
As the amount of content grows, managing each item on its own Confluence page makes sense: the page can contain all the context, details, and materials related to that particular content item. But this creates another problem. Information becomes distributed across many pages, making it difficult to answer questions across the whole content library:
What content is currently in progress? Who owns each item? What is ready for publication? What is planned for a particular period?
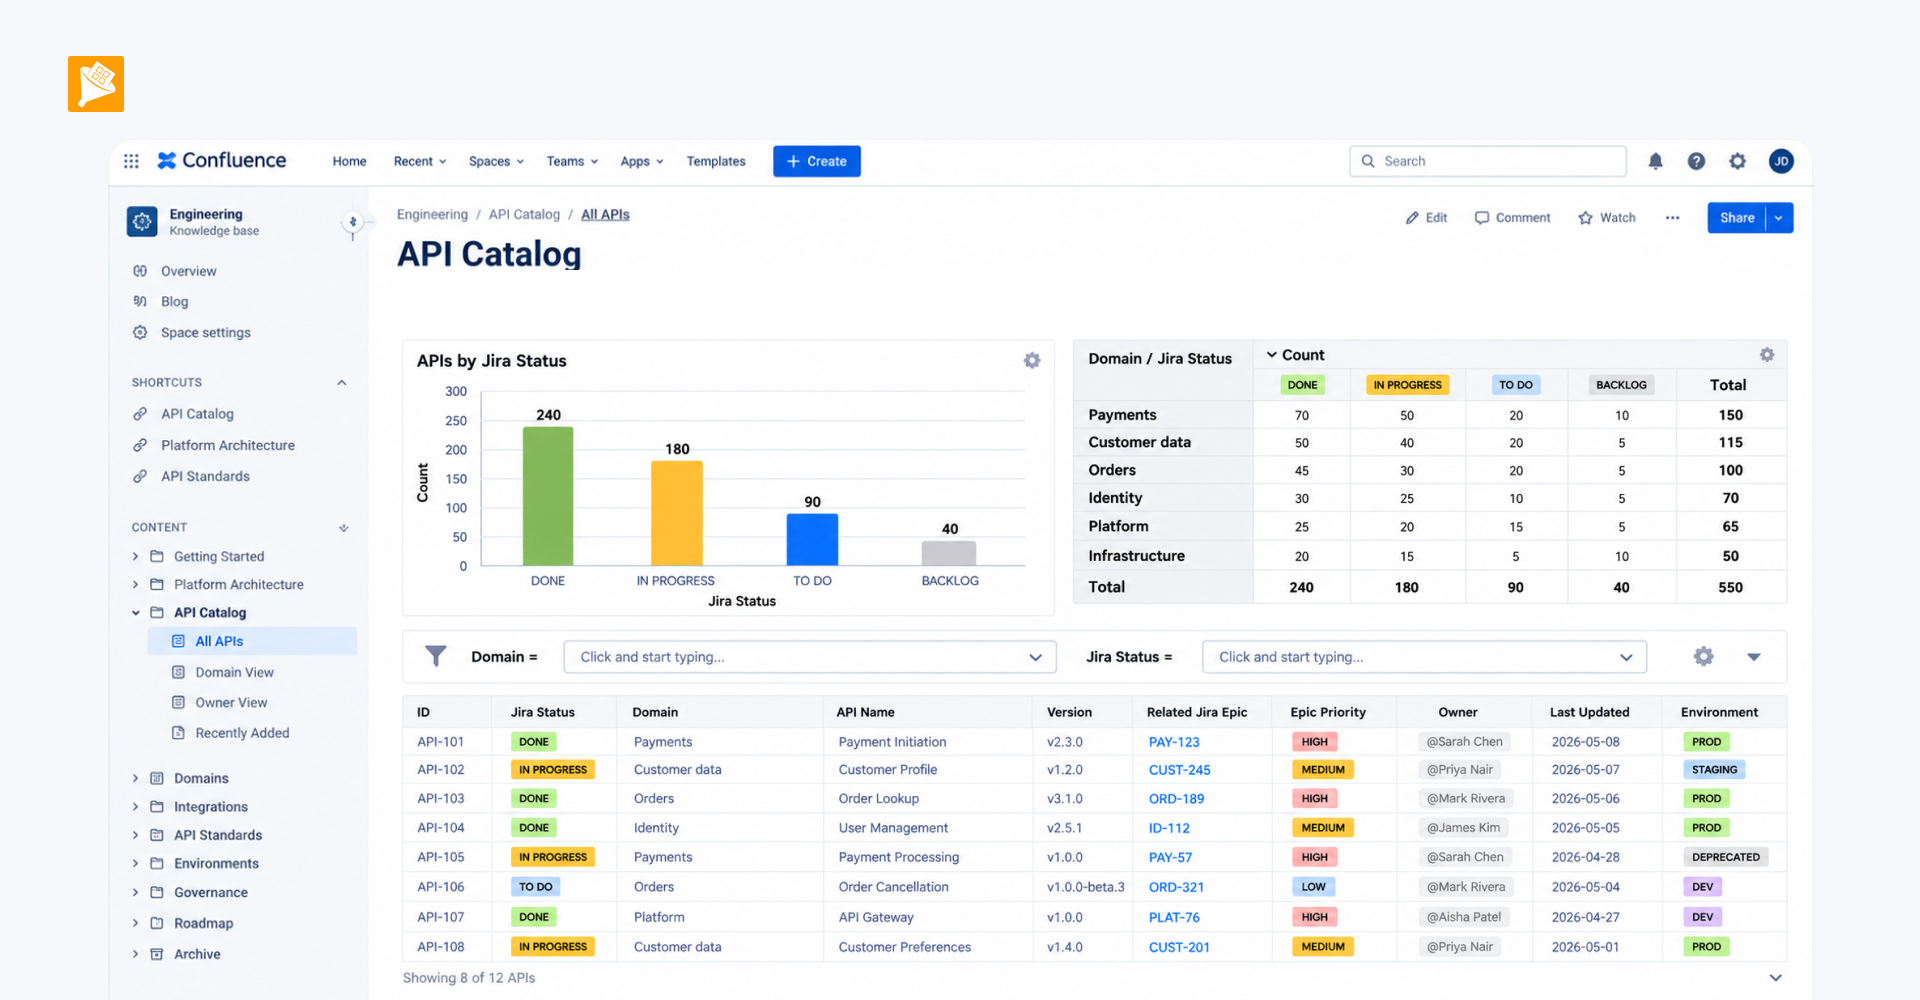
The goal is to keep one page per content item while still being able to work with all content as a single structured dataset. In this case, each content page becomes an asset with structured fields such as status, owner, publication date, next review date, and other fields relevant to your team. The main page then brings information about those assets together for content planning and management.
Result
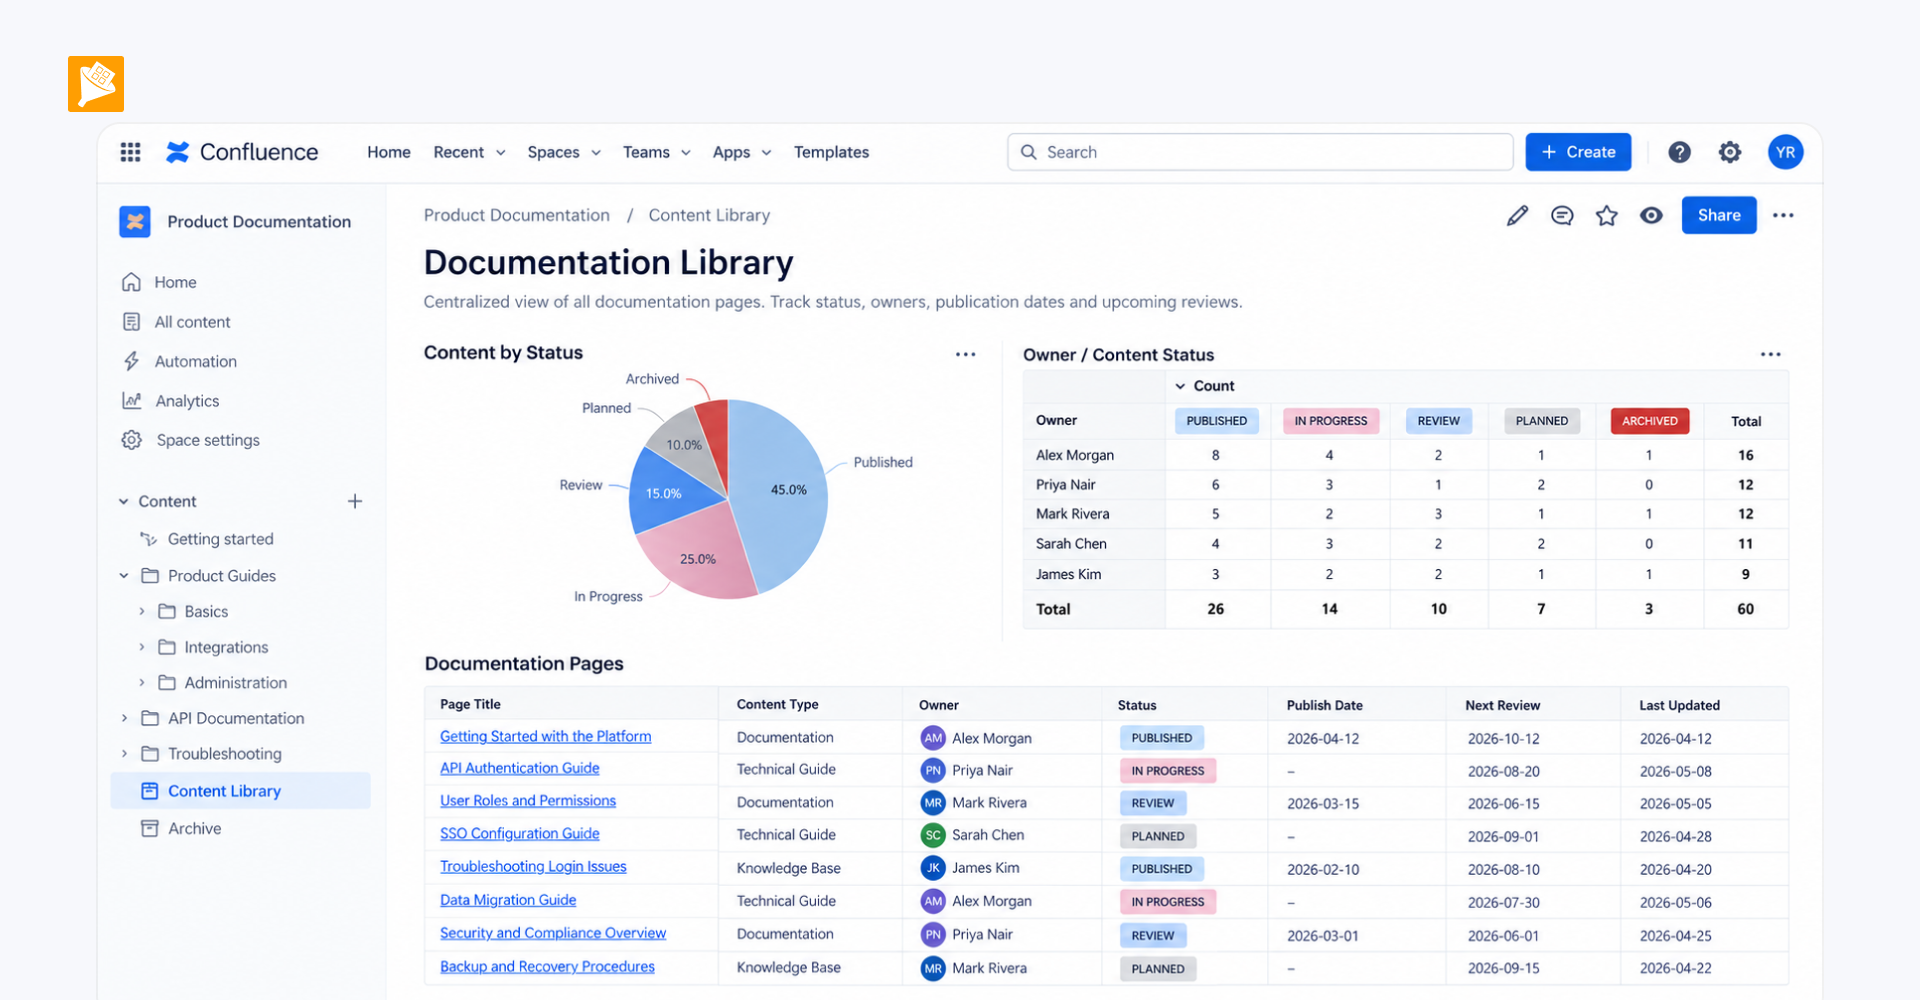
Teams can manage detailed information directly on individual content pages while getting a centralized overview across the entire content library.
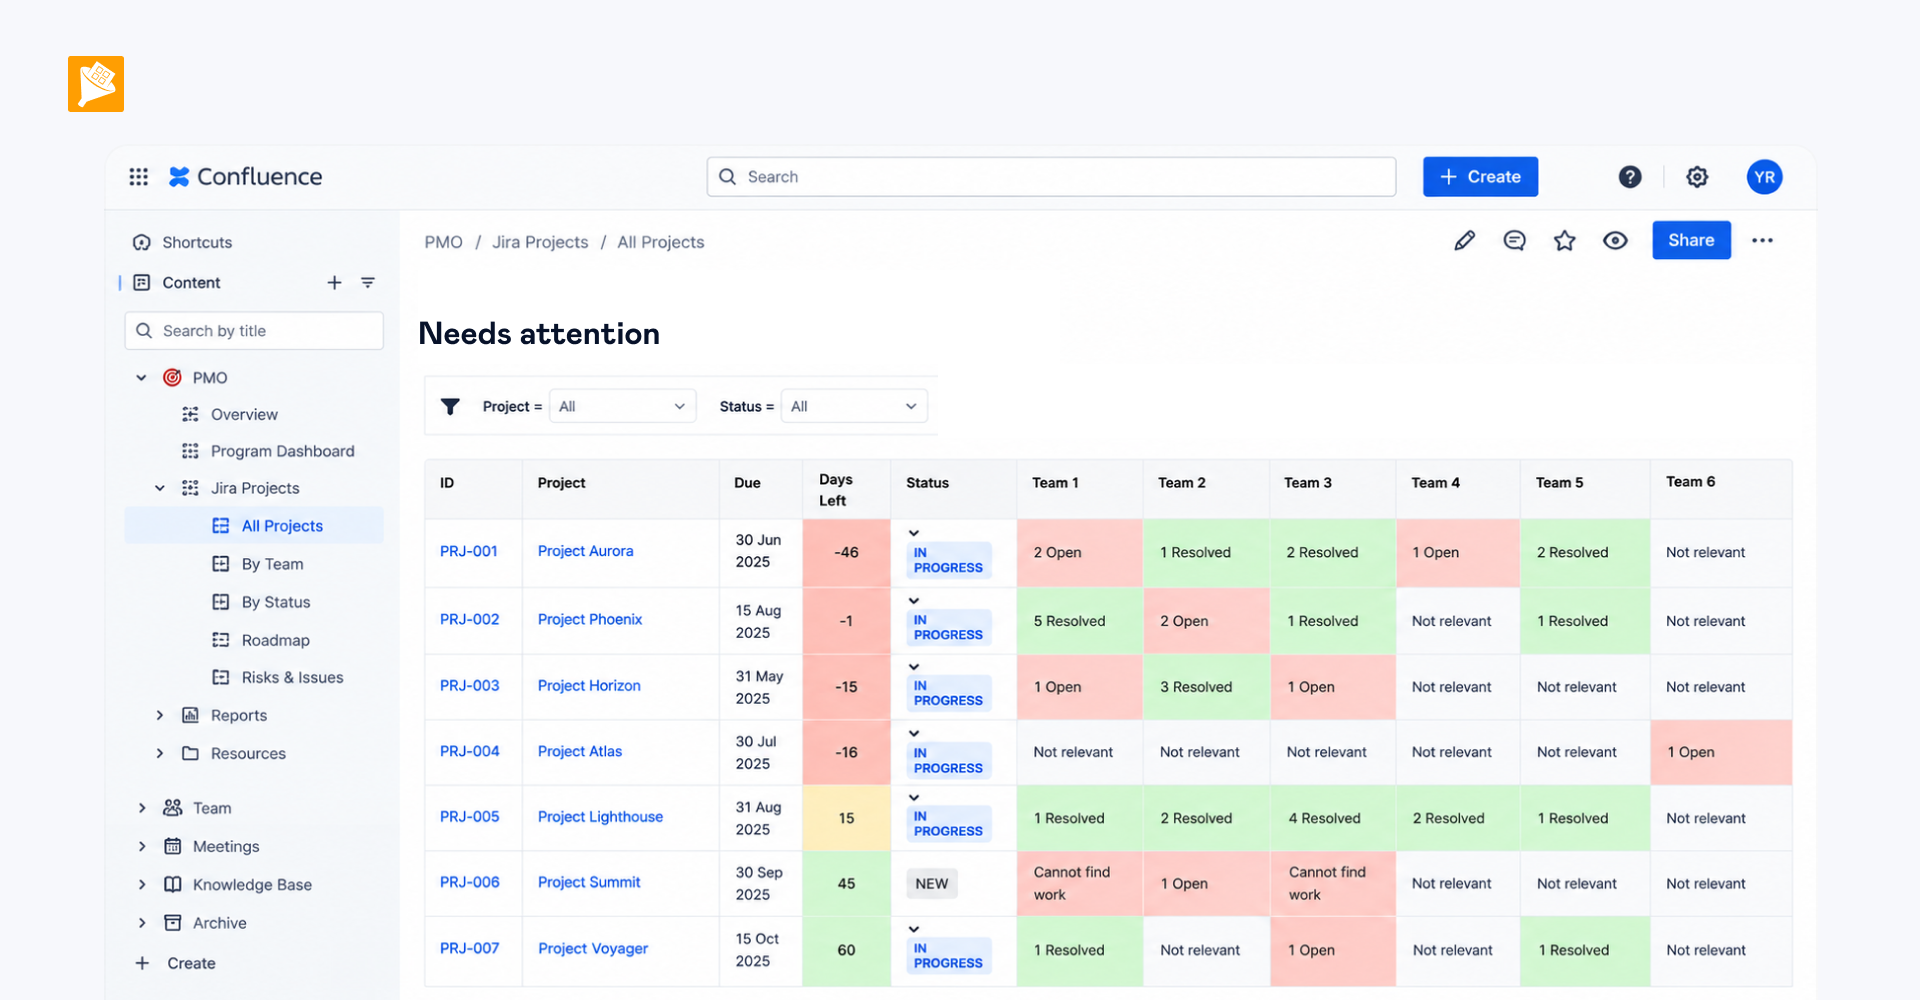
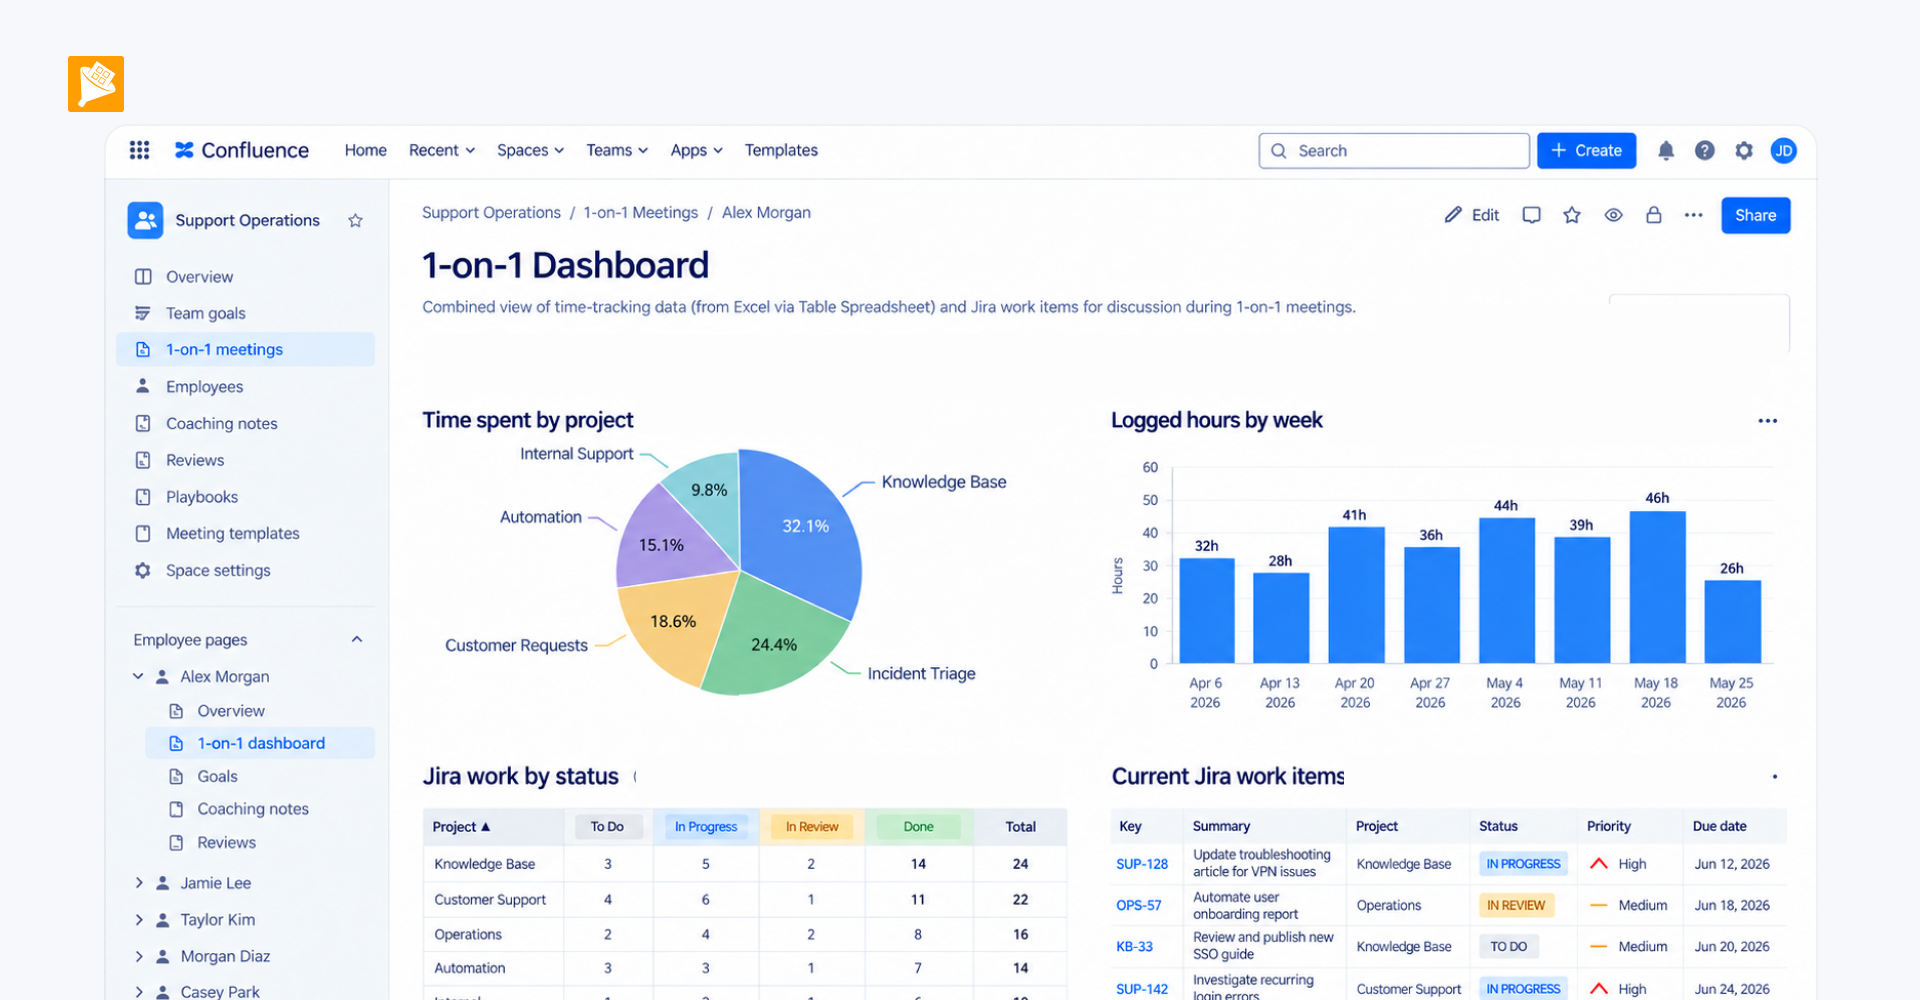
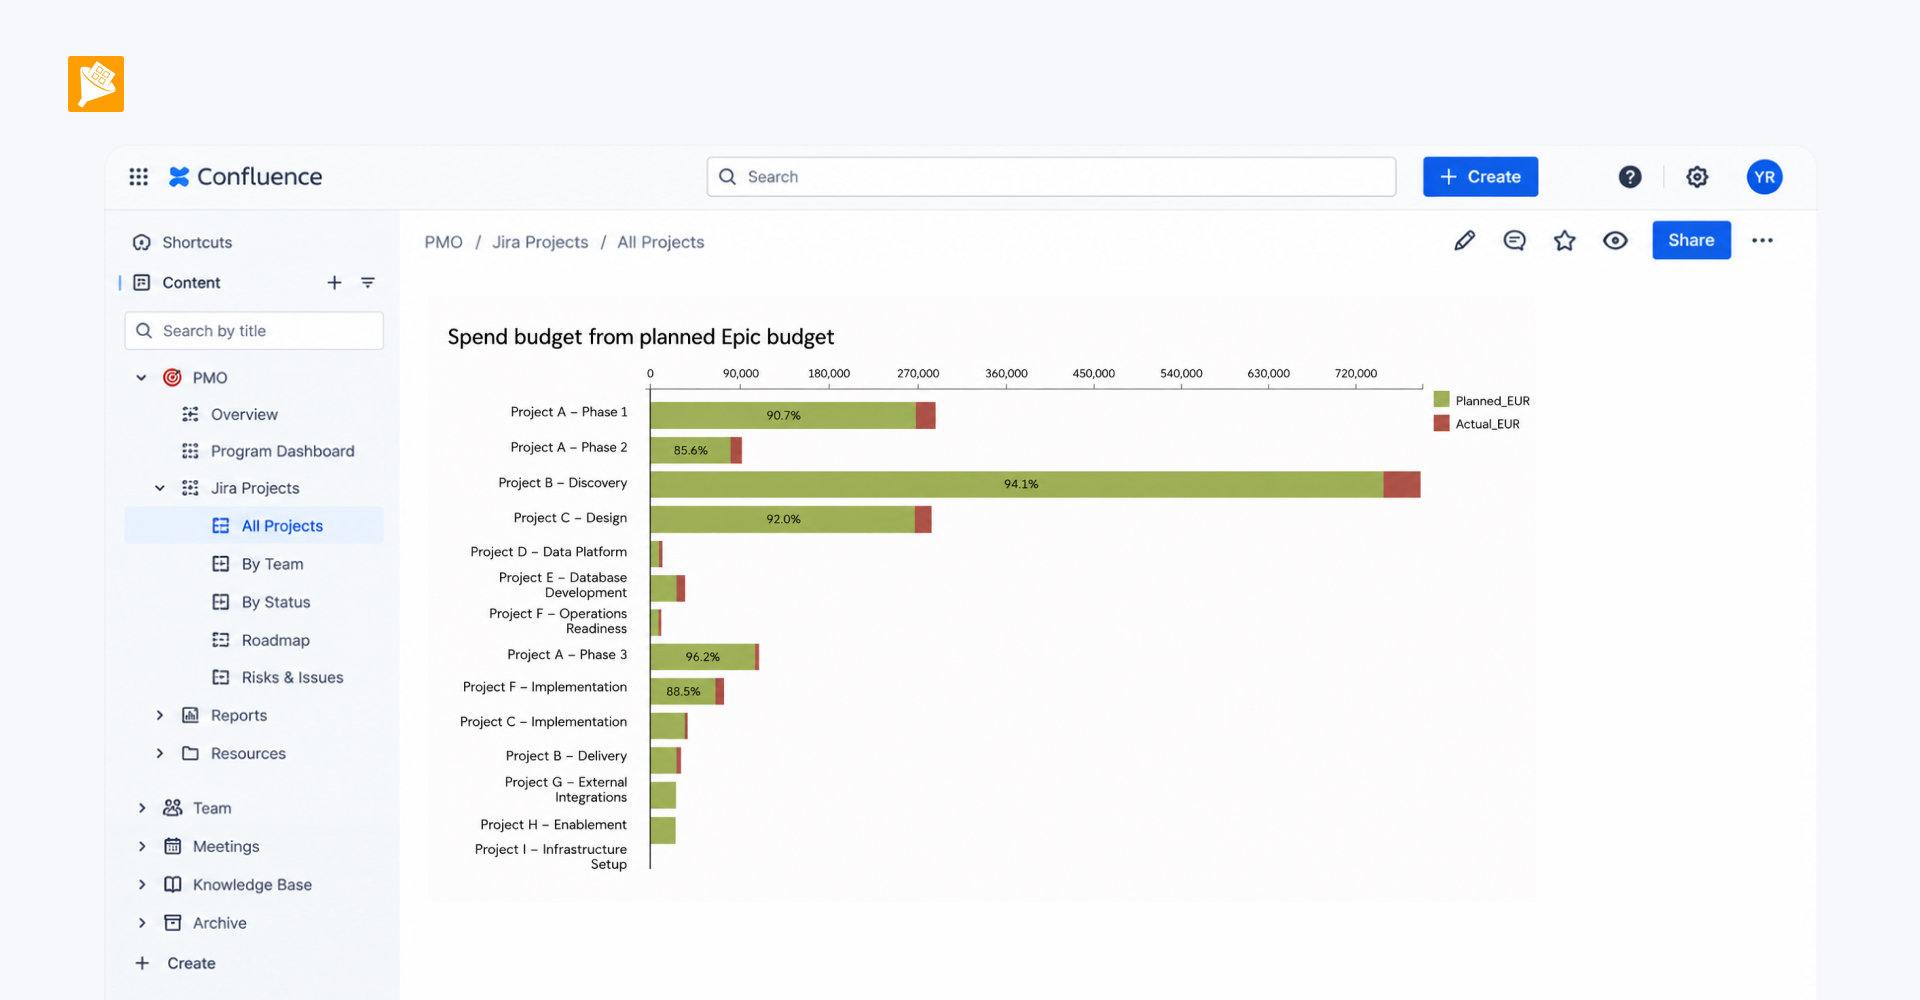
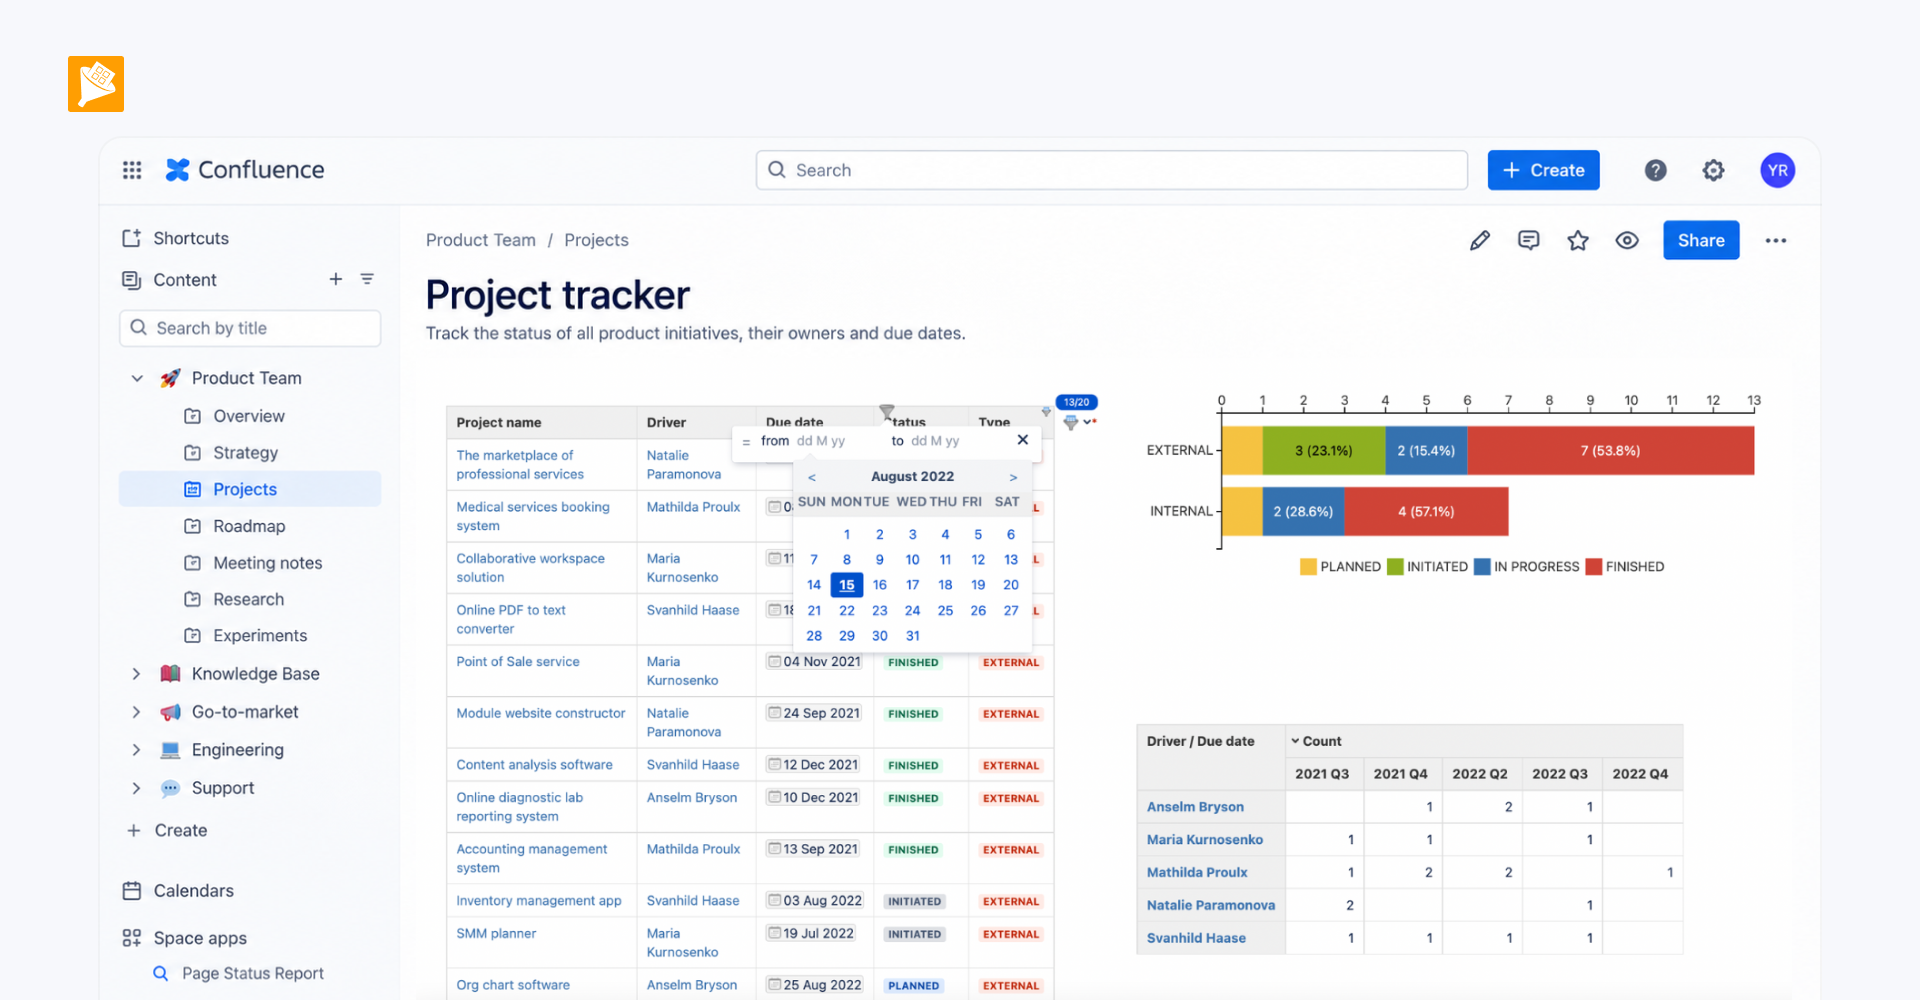
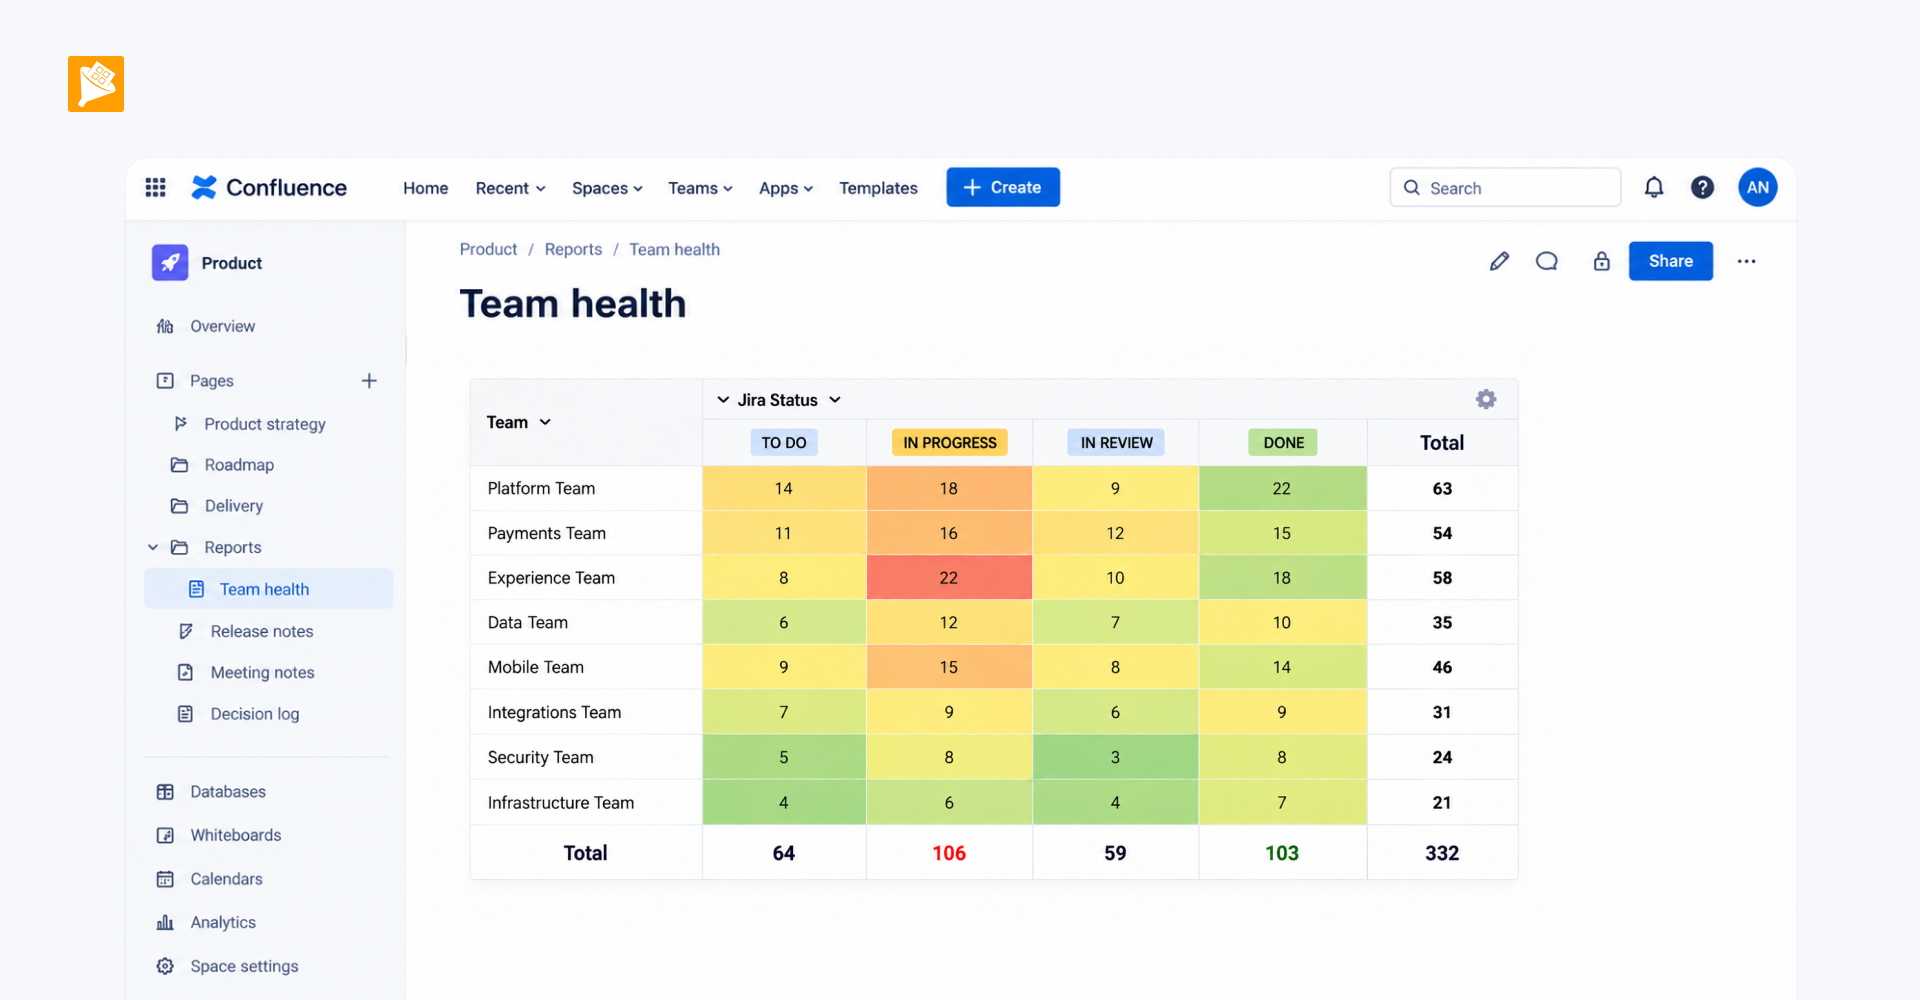
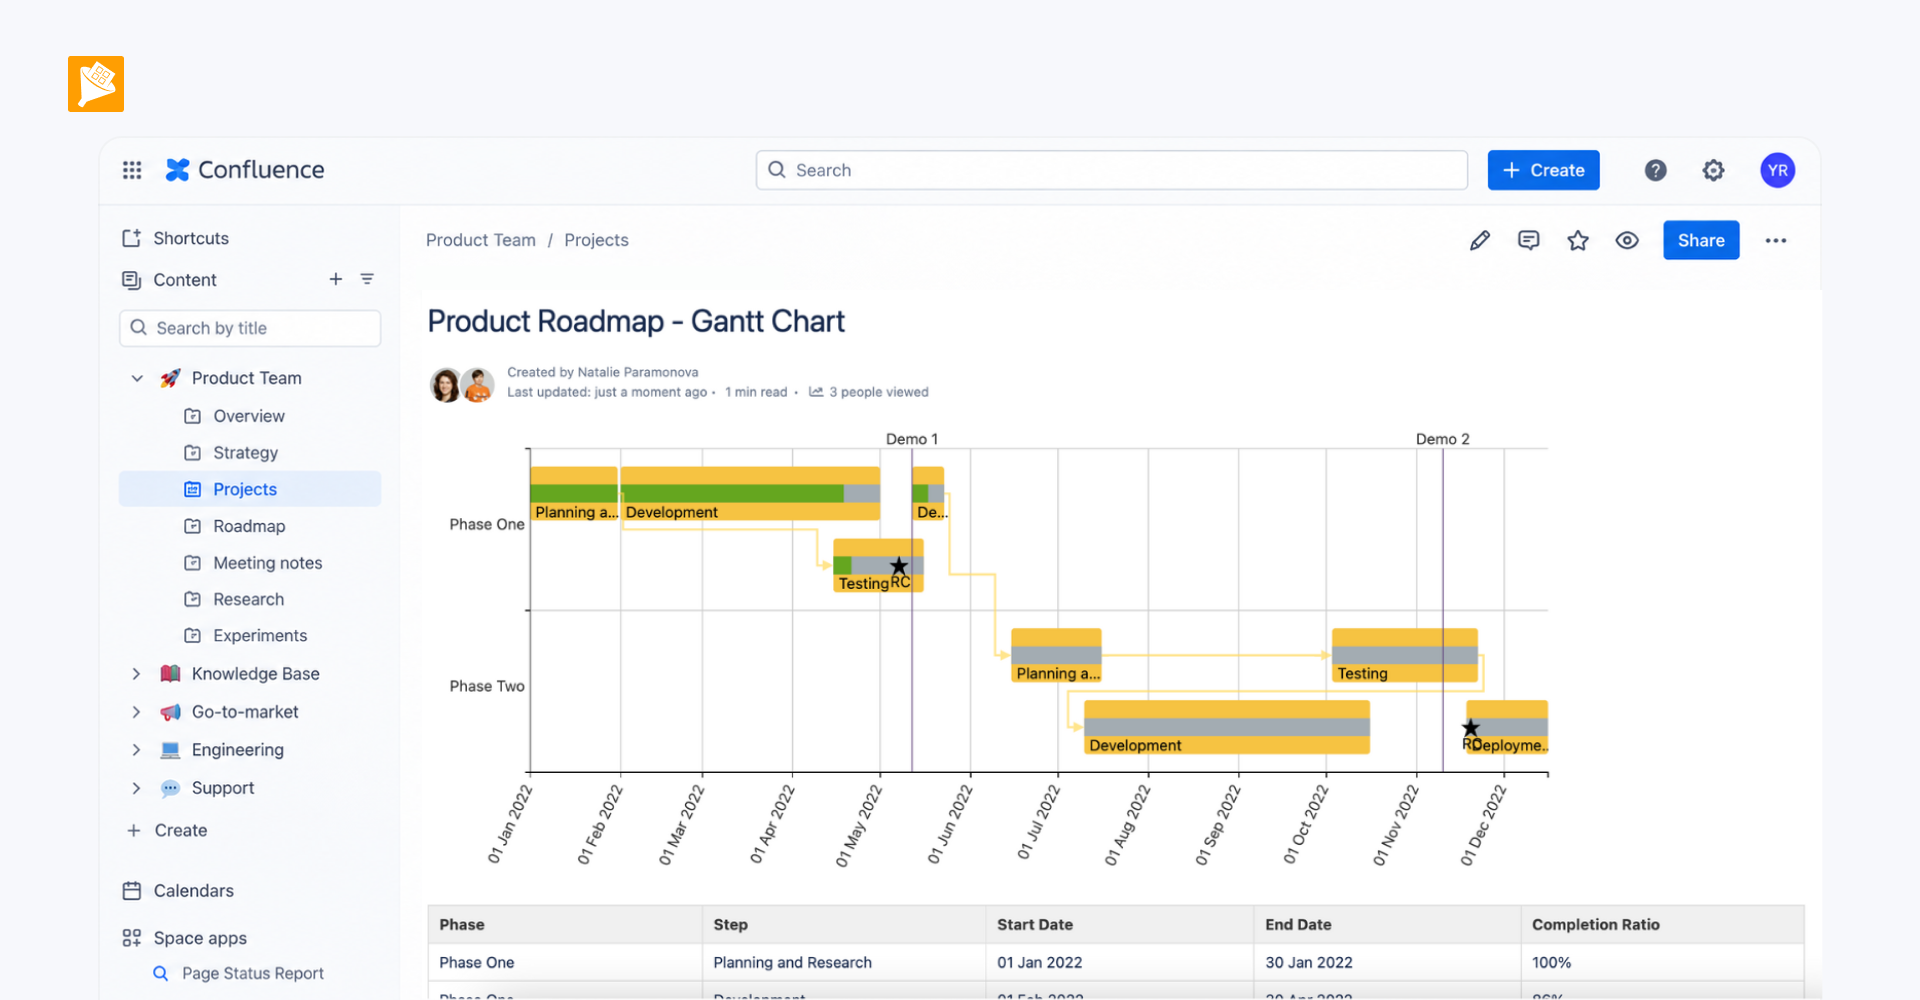
The consolidated dataset can then be filtered by owner, status, or publication date, reorganized into different views, summarized, and visualized depending on what the team needs to see.
How it is built
- Each content item gets its own Confluence page. A structured table on the page contains the fields needed for content management, such as status, owner, publication date, and next review date.
- The table is wrapped in Page Properties or Table Excerpt.
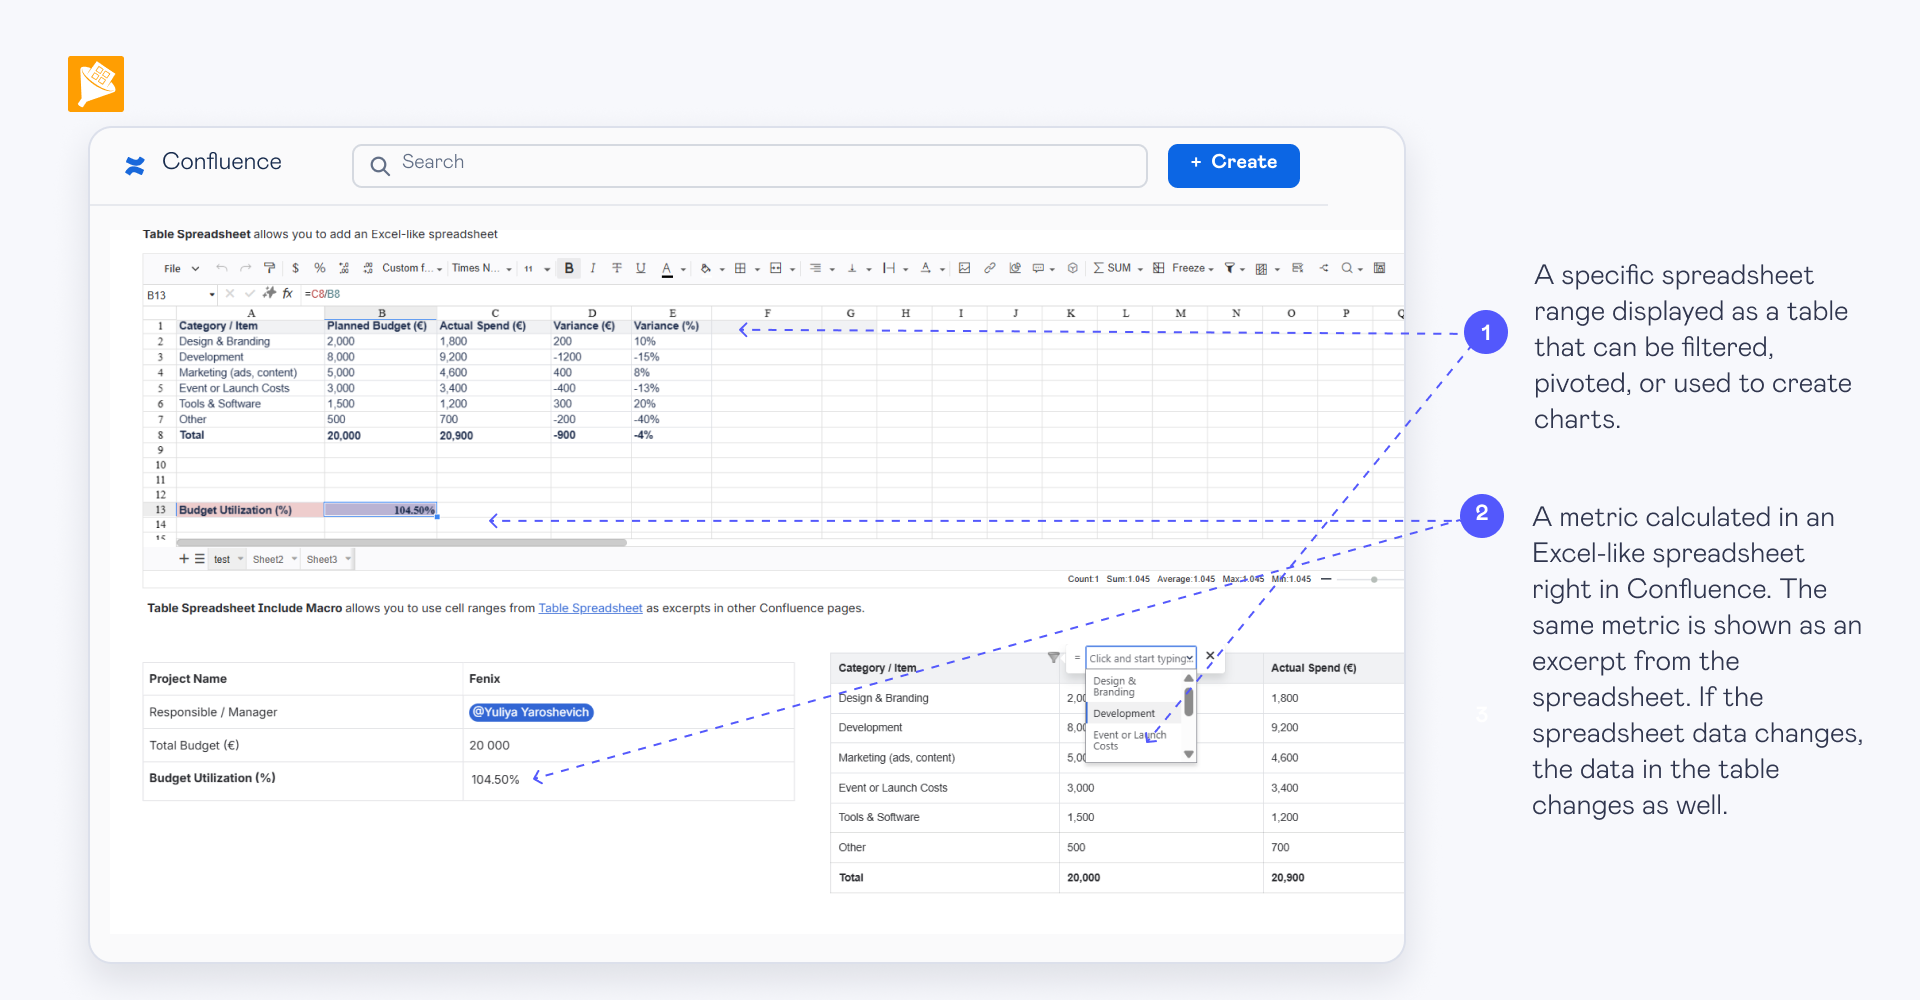
- Page Properties Report or Table Excerpt Include brings data from multiple Confluence pages together into a consolidated dataset. The source tables can also be transposed or aggregated when their original structure is not suitable for the final report.
- Table Filter adds interactive filtering and search so users can narrow the content overview to the items they need.
- The same dataset can be used with Pivot Table to aggregate and summarize content; Table Transformer to reshape the data or apply additional calculations and logic, such as setting a status based on the next review date and today’s date; and Chart from Table to visualize the resulting overview.