15K+
 4.9/5
 3M
Track planned vs. actual budget from Jira — without exporting data to Excel
Context and Challenge
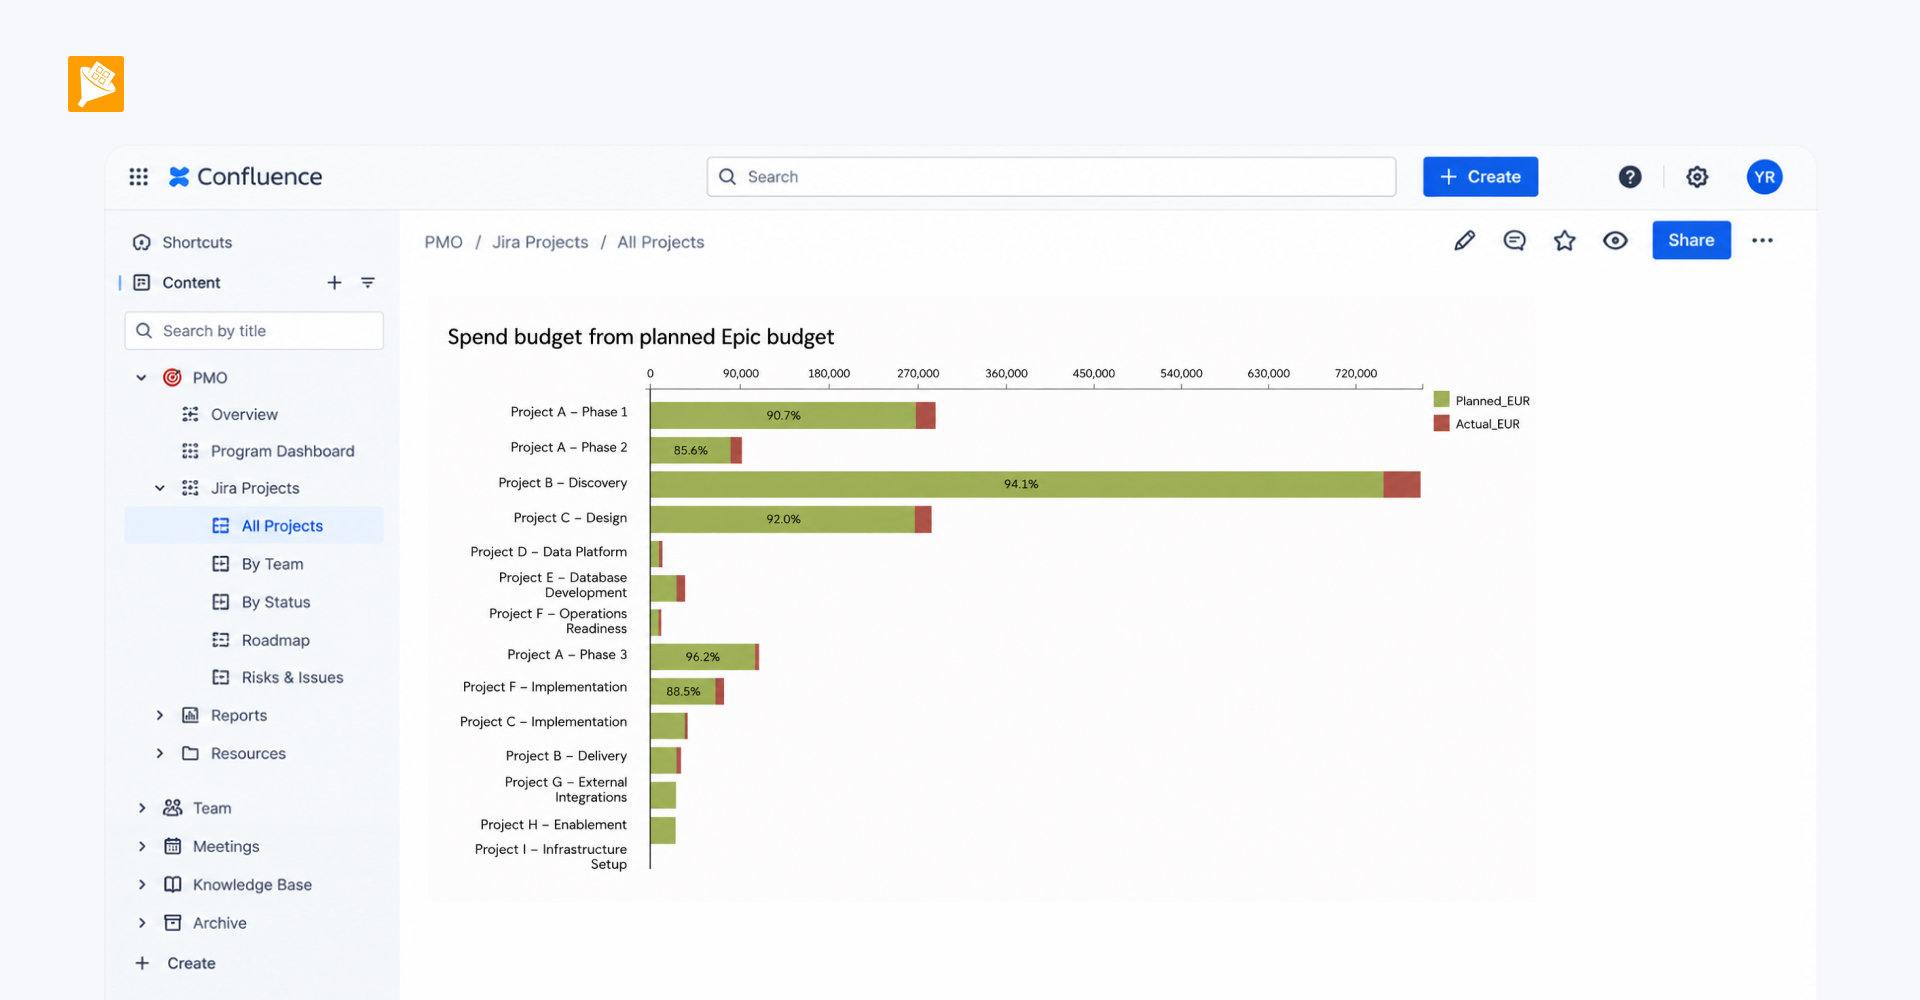
An Application Owner manages 13 IT applications, each with its own Jira project. Every Jira story has a monetary value, so Jira isn't just tracking work—it's also tracking budgets. Planned budgets are defined at the Epic and Sprint level, while actual spend grows as Jira stories are completed.
She needs to continuously compare planned vs. actual spend by sprint, epic, and application to see where the budget stands and spot potential overruns early.
Excel was the obvious option, but it required exporting Jira data, reformatting it, and sharing a static file. For ongoing budget monitoring, the report could already be outdated by the time stakeholders opened it.
Result
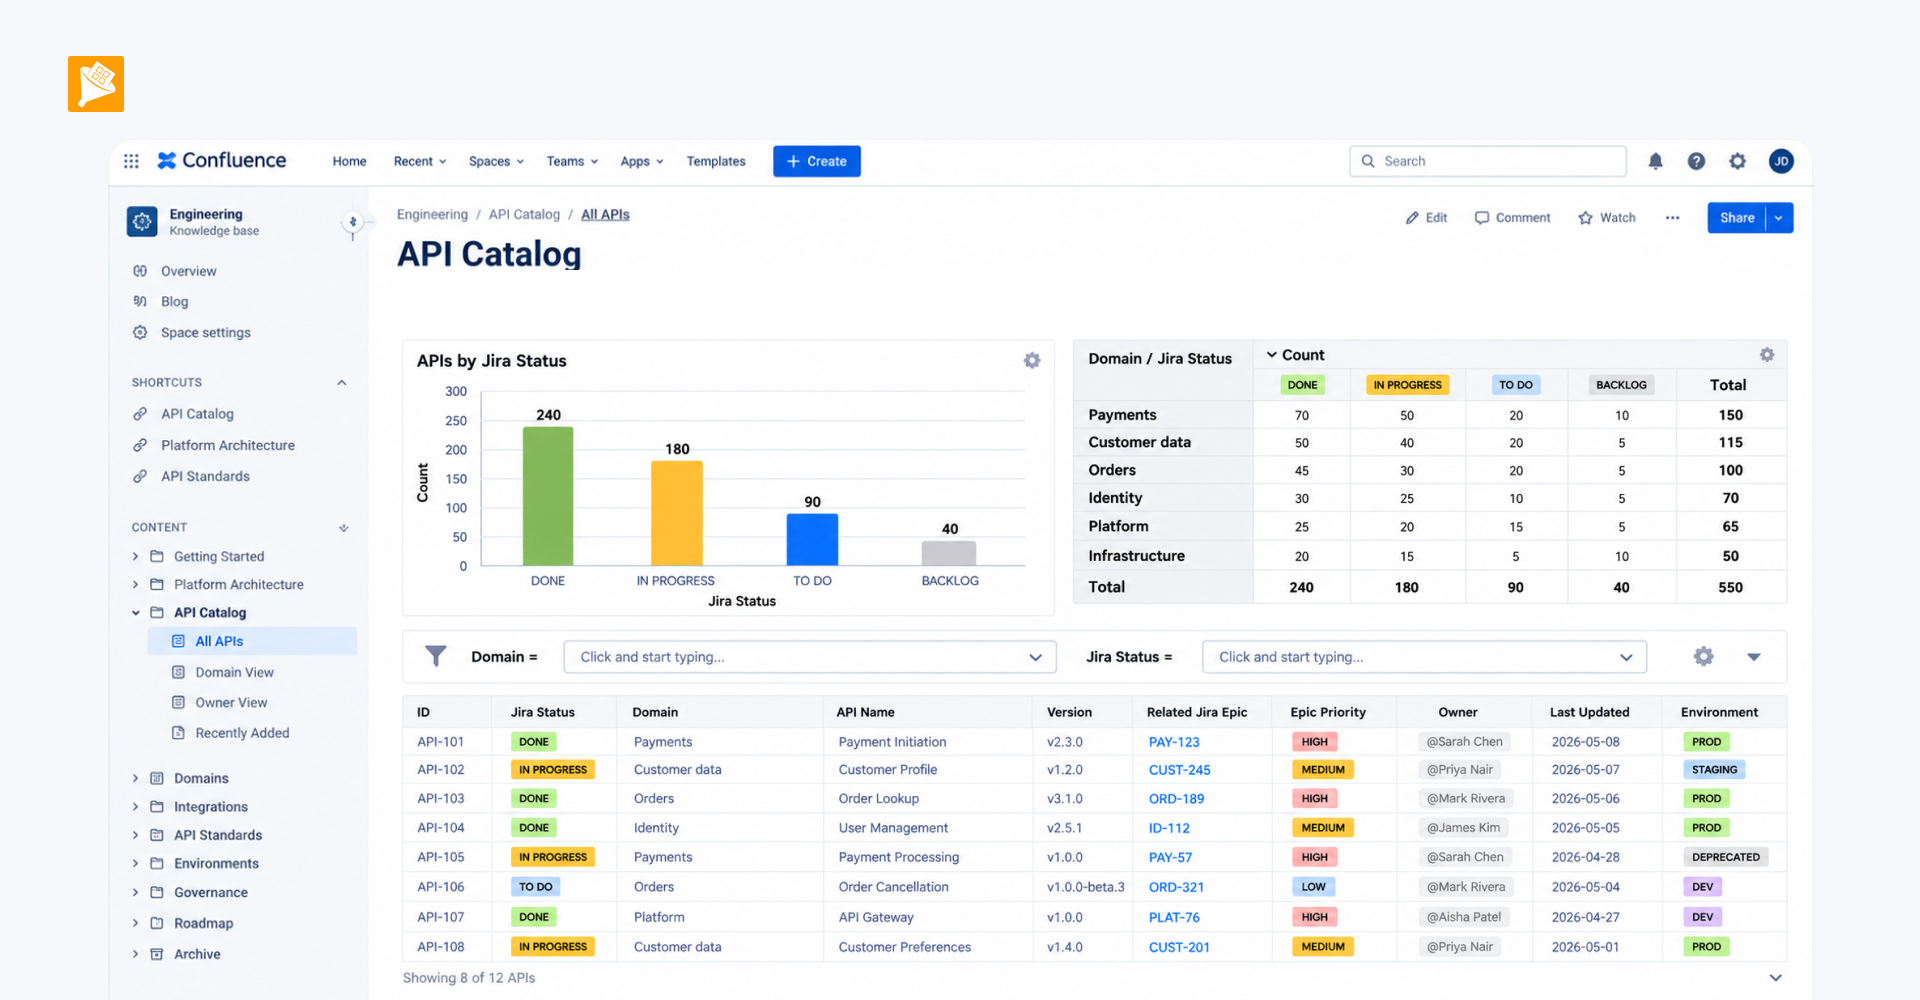
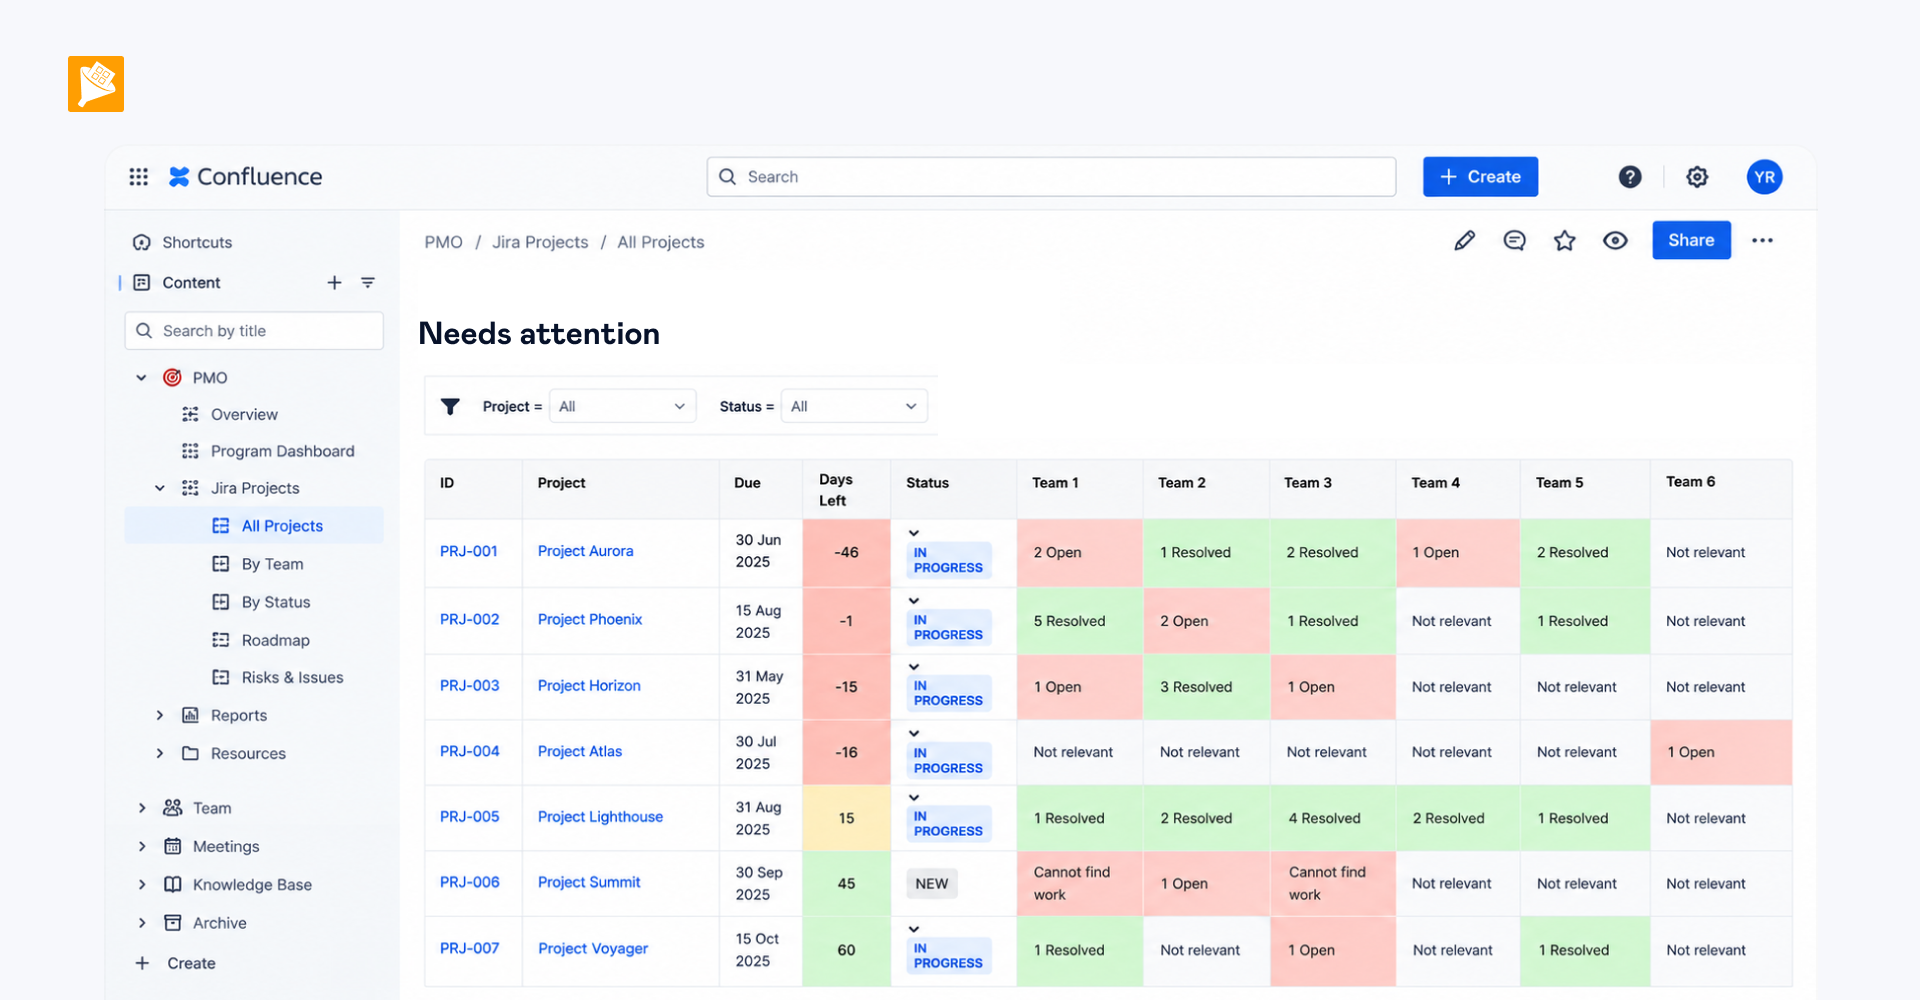
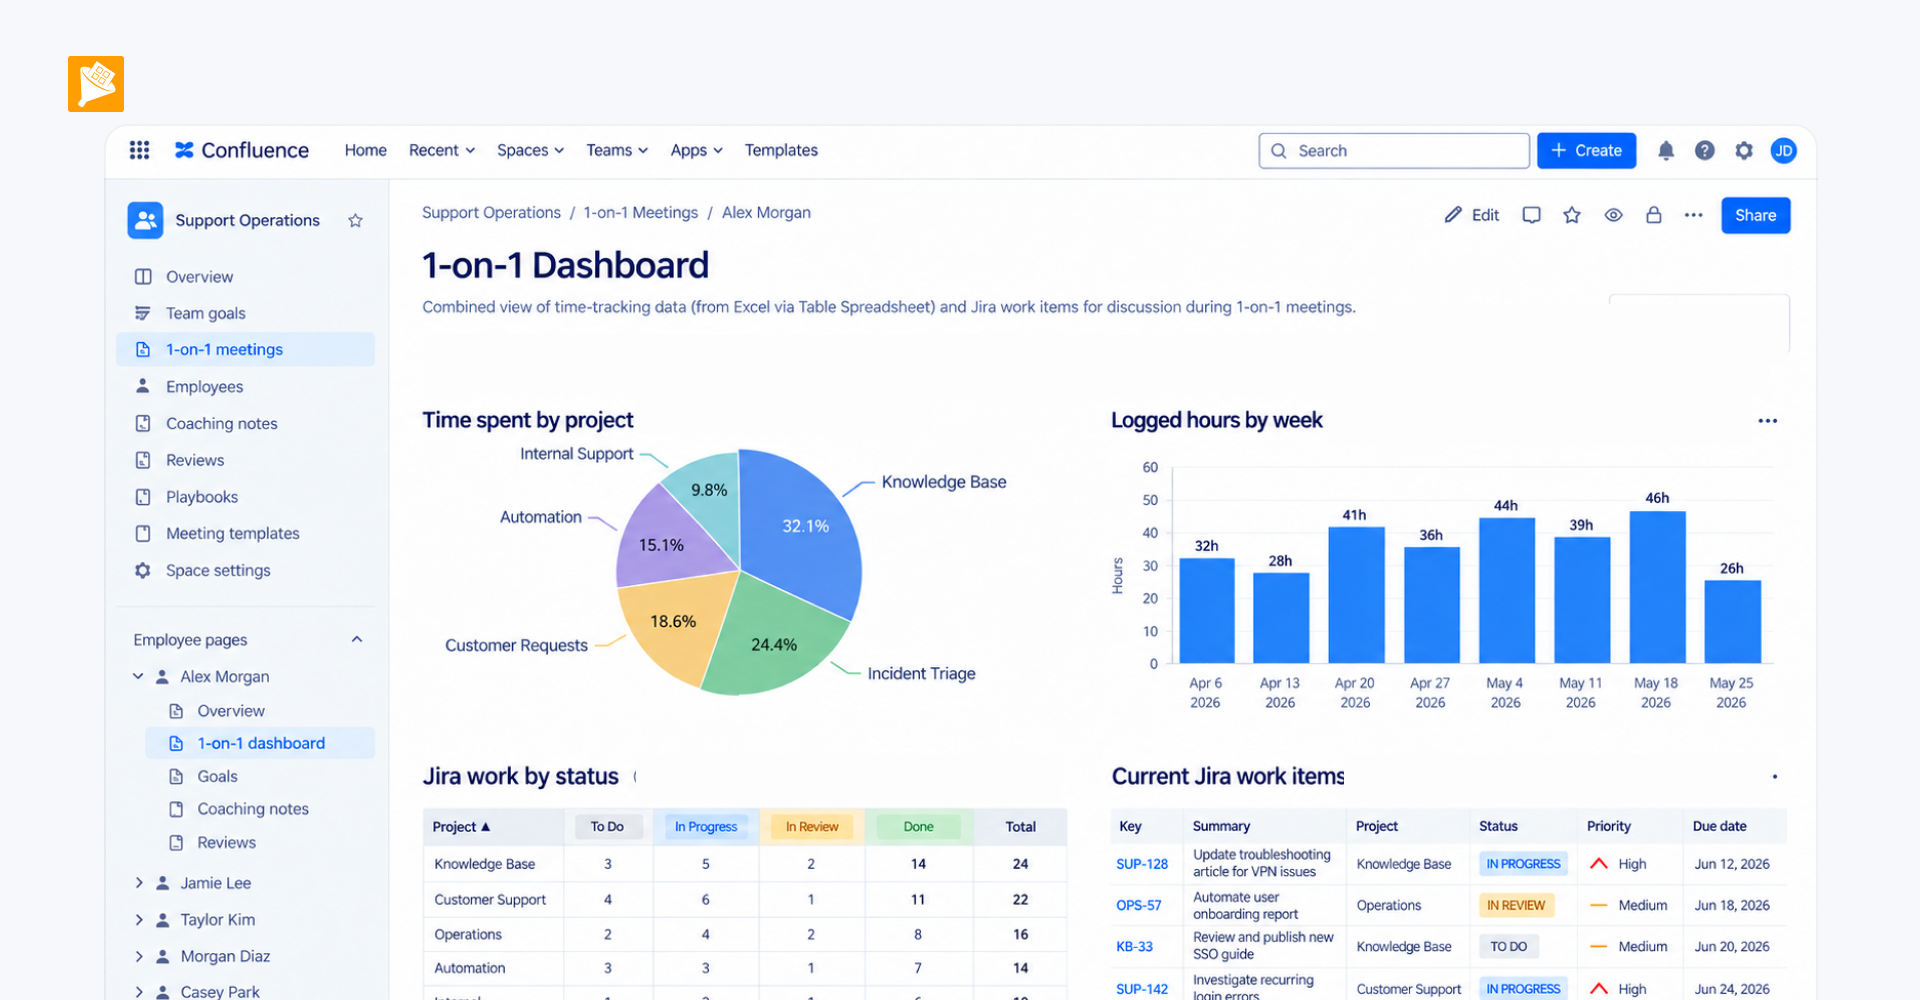
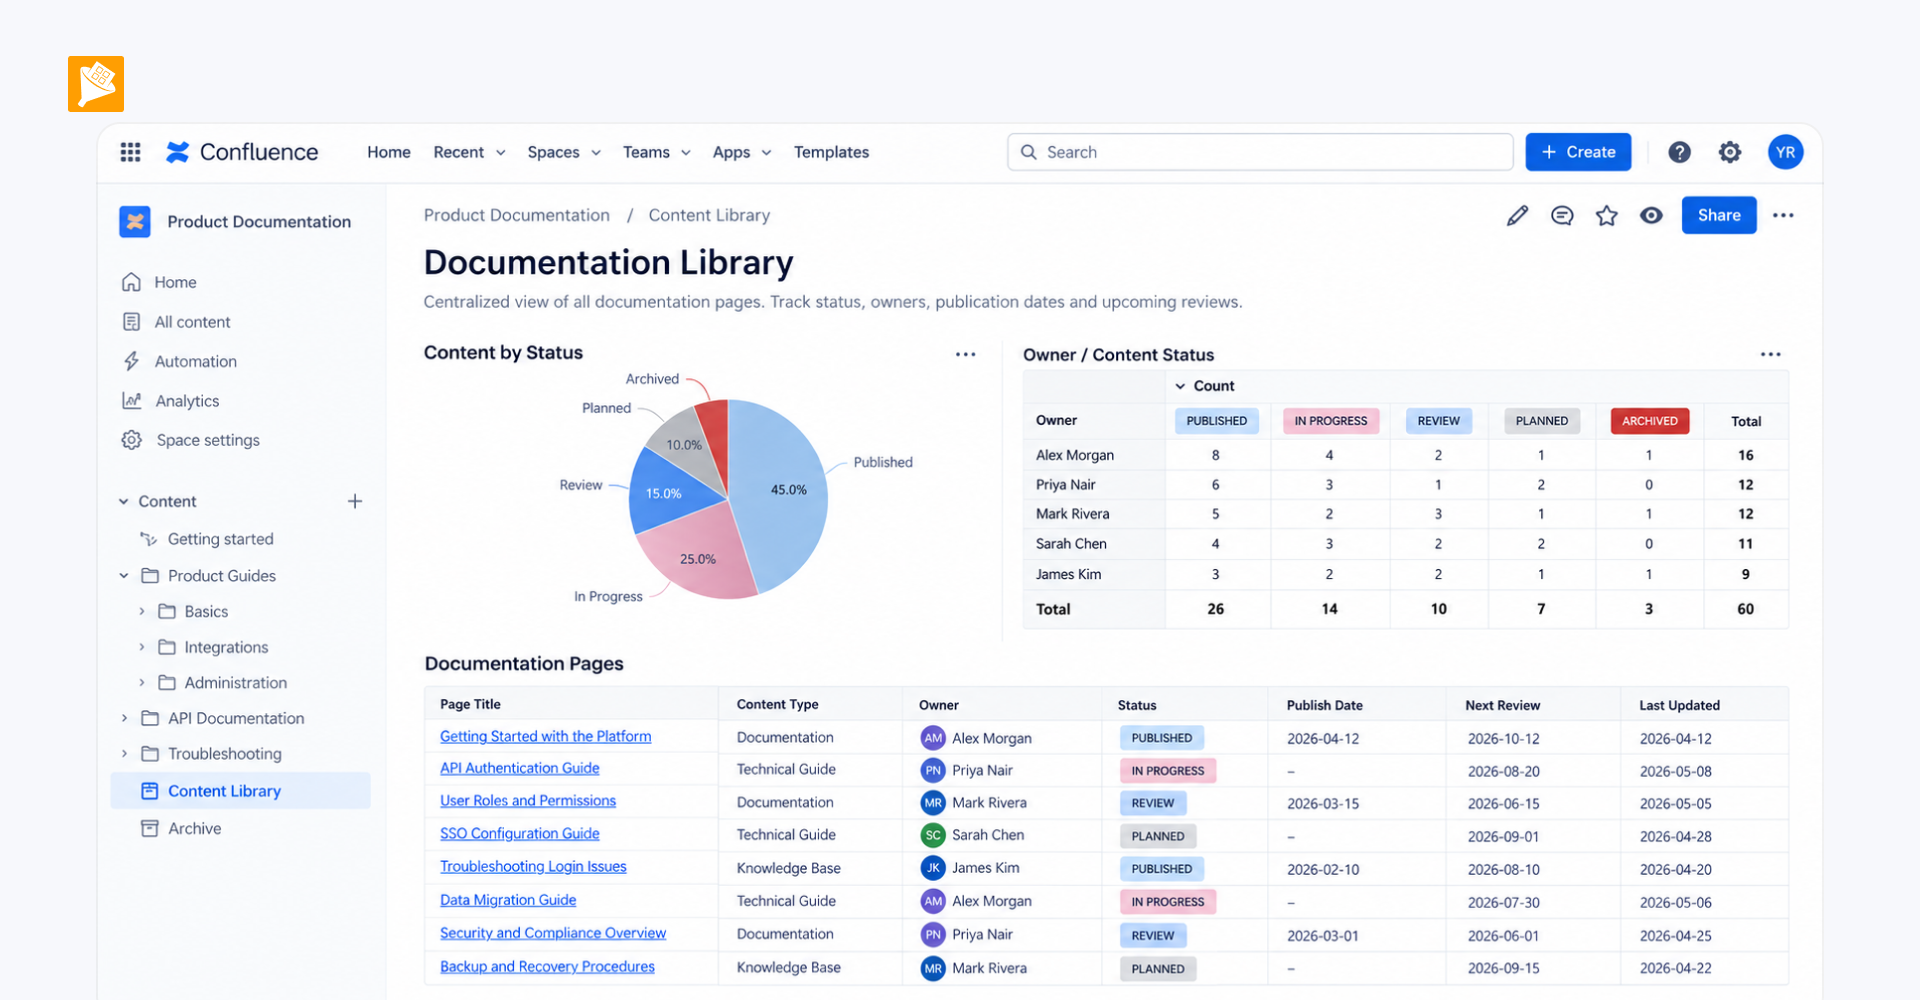
Each application now has a live Confluence dashboard that combines the latest Jira data, calculates planned vs. actual spend, and visualizes budget progress. Stakeholders can see the current budget position at a glance and drill down into specific sprints, epics, or cost categories without exporting Jira data to Excel.
The same dashboard structure — including macro configuration, SQL logic, and table layout — is reused across all 13 applications.
How it is built
The solution combines several macros working together:
- Jira Work Items macros pull live data from the application’s Jira project, including stories, epics, sprint assignments, and the monetary values attached to them.
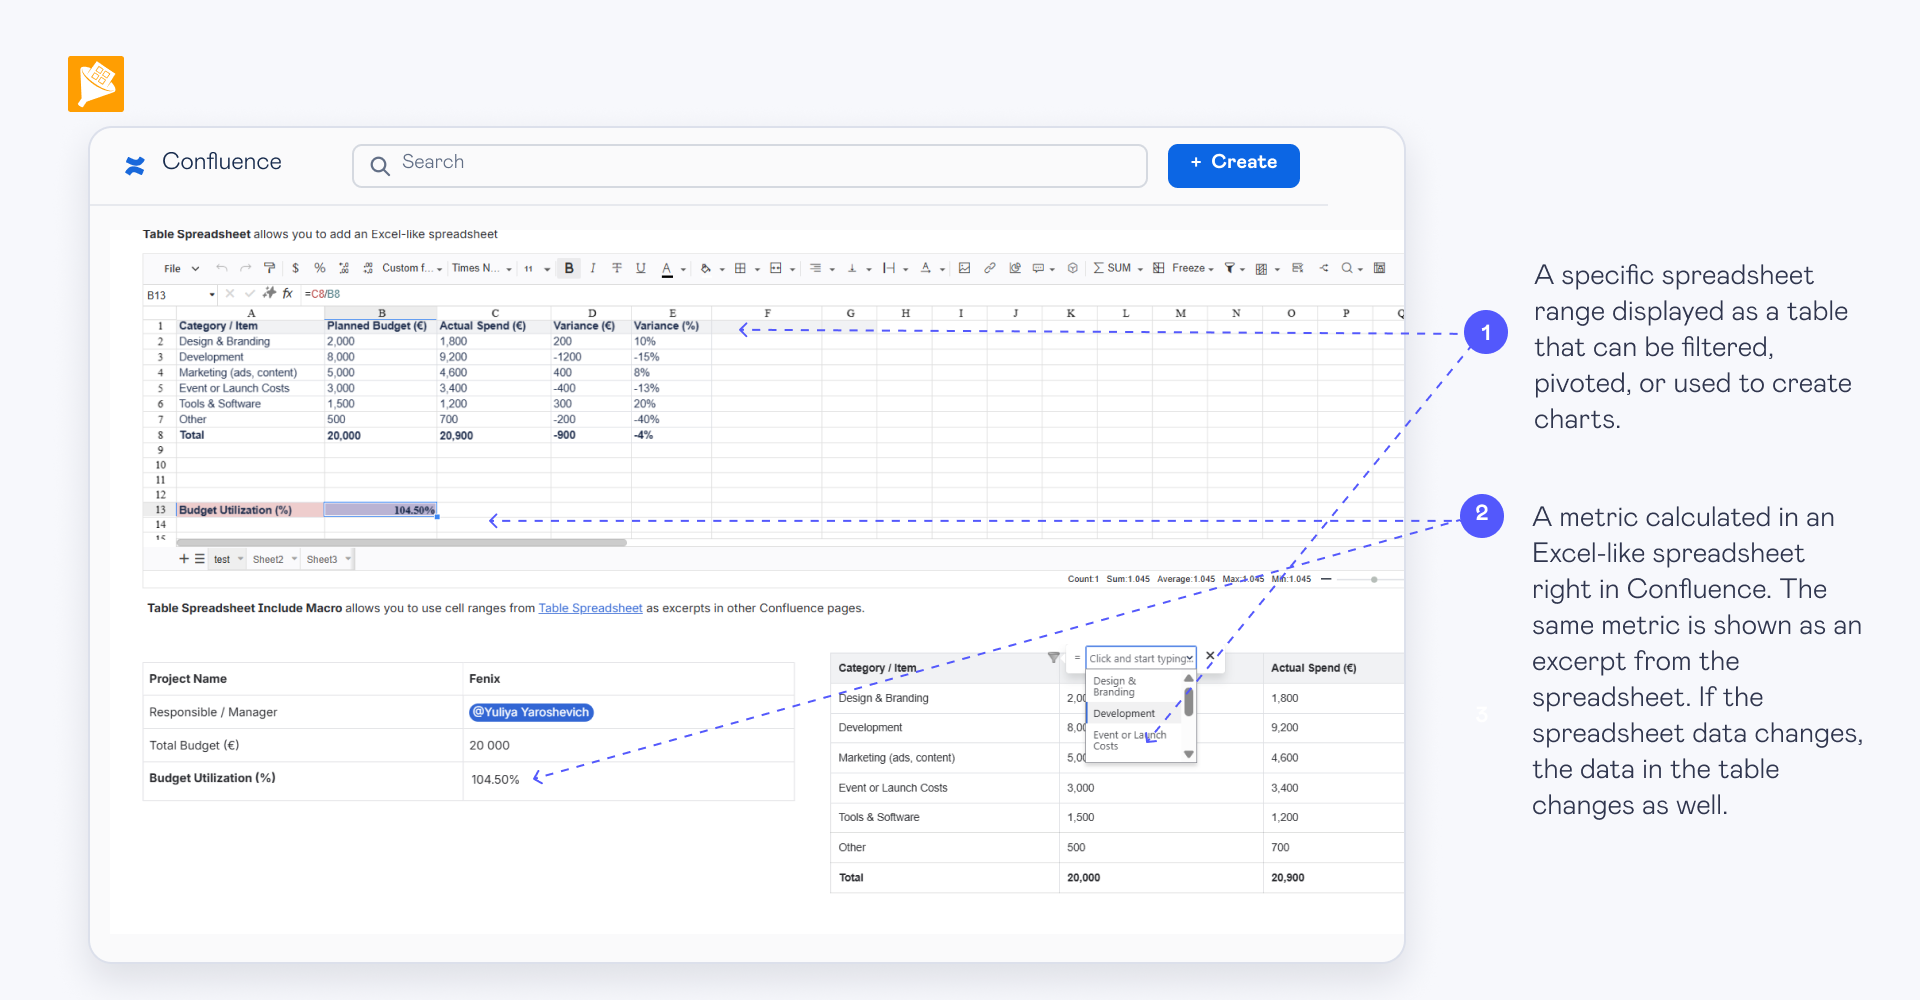
- Table Transformer joins and reshapes the Jira data and uses SQL to calculate planned vs. actual spend by sprint and epic.
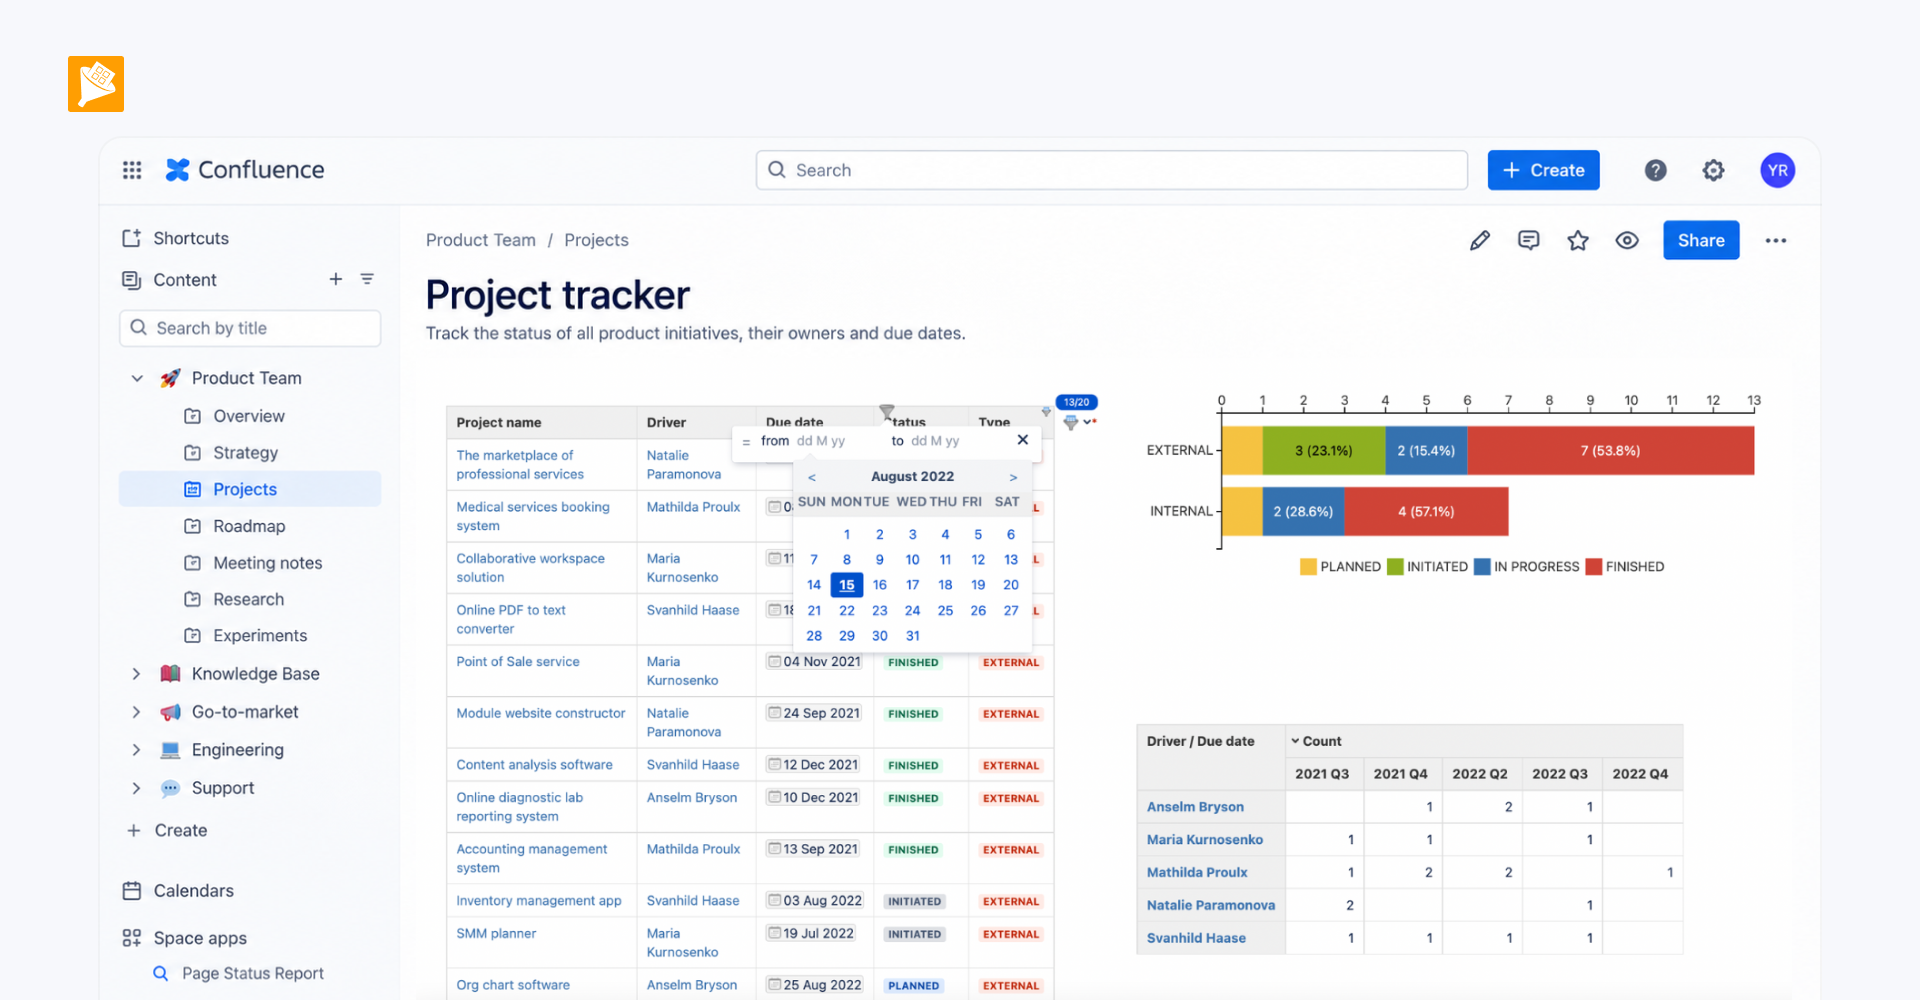
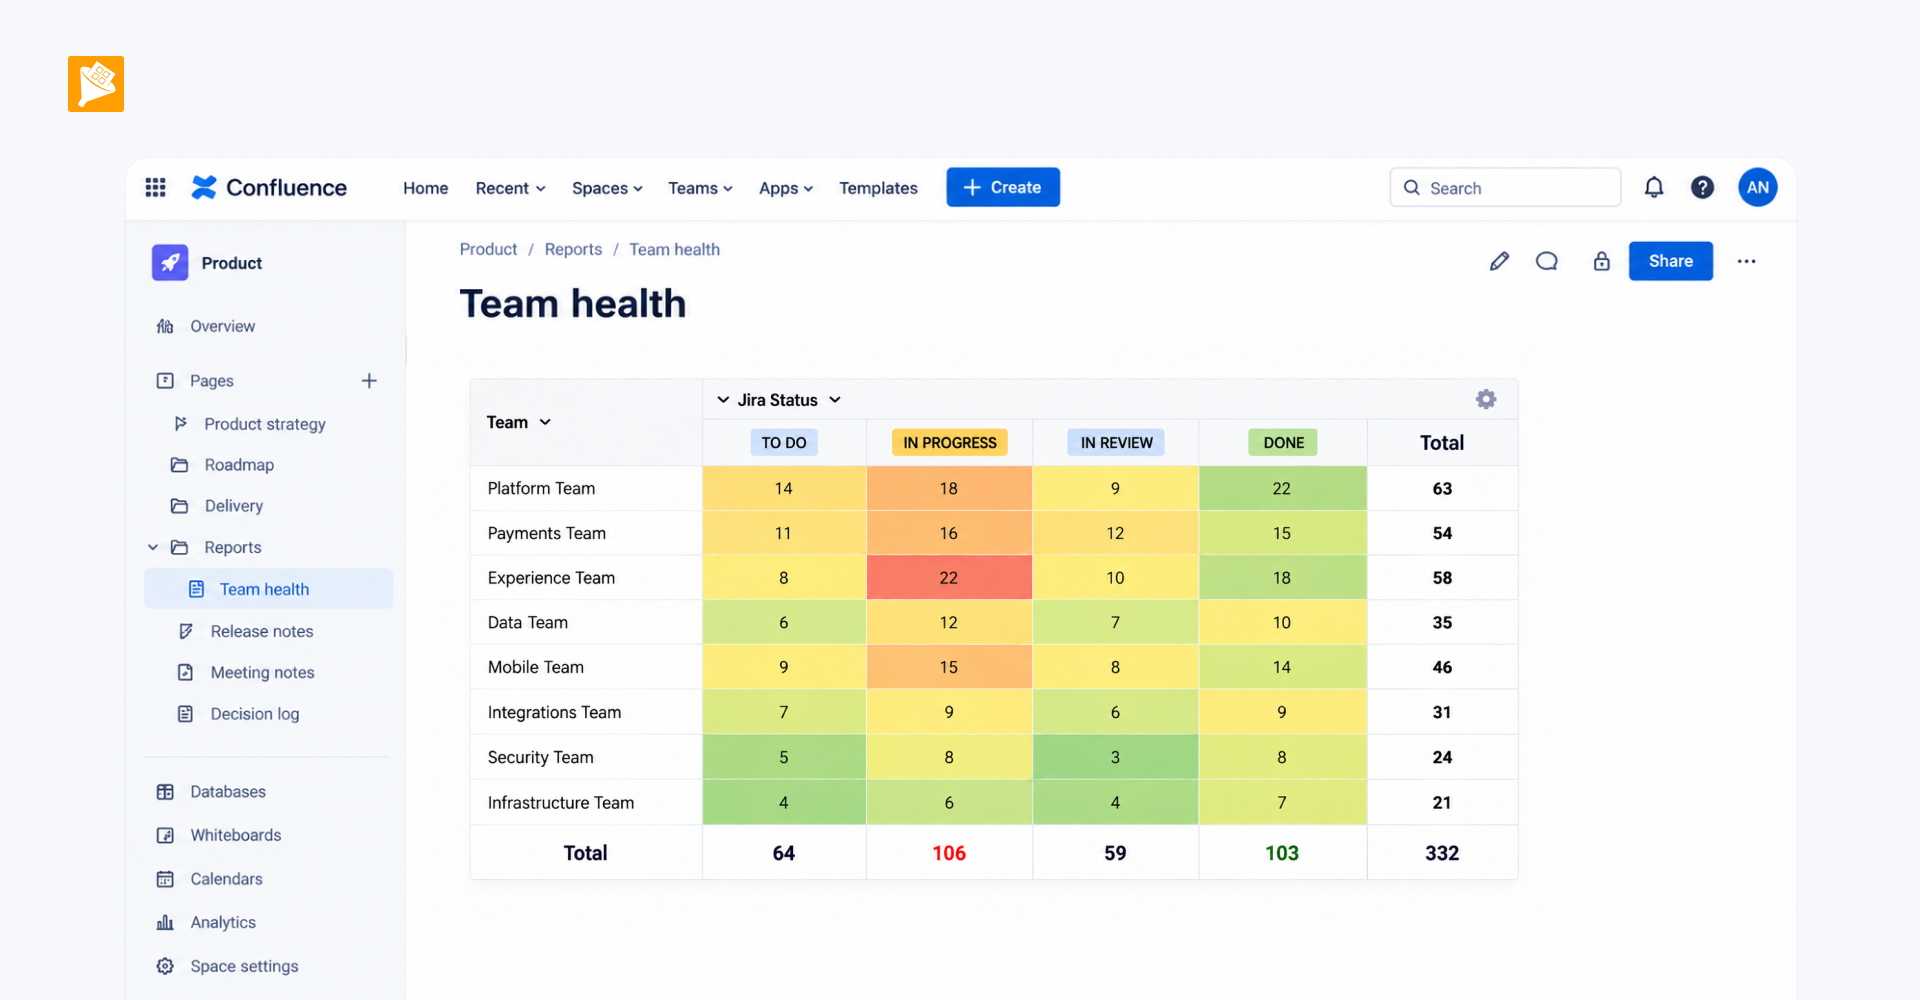
- Pivot Table turns the calculated data into a matrix for comparing spend across time periods and work categories.
- Chart from Table visualizes budget progress and shows where actual spend stands against the plan.