15K+
 4.9/5
 3M
Build an interactive project roadmap in Confluence instead of managing it in Excel
Context and Challenge
Portfolio managers, project managers, and EPMO teams needed a better way to share project roadmaps during meetings. Excel attachments were not interactive enough for these discussions, while Jira Plans could not provide the complete picture: not every team worked in Jira, and some roadmap items did not have corresponding Jira objects.
They needed a way to keep the planning data in Confluence and present it visually, including timelines, dependencies between departments, and scheduling conflicts.
Result
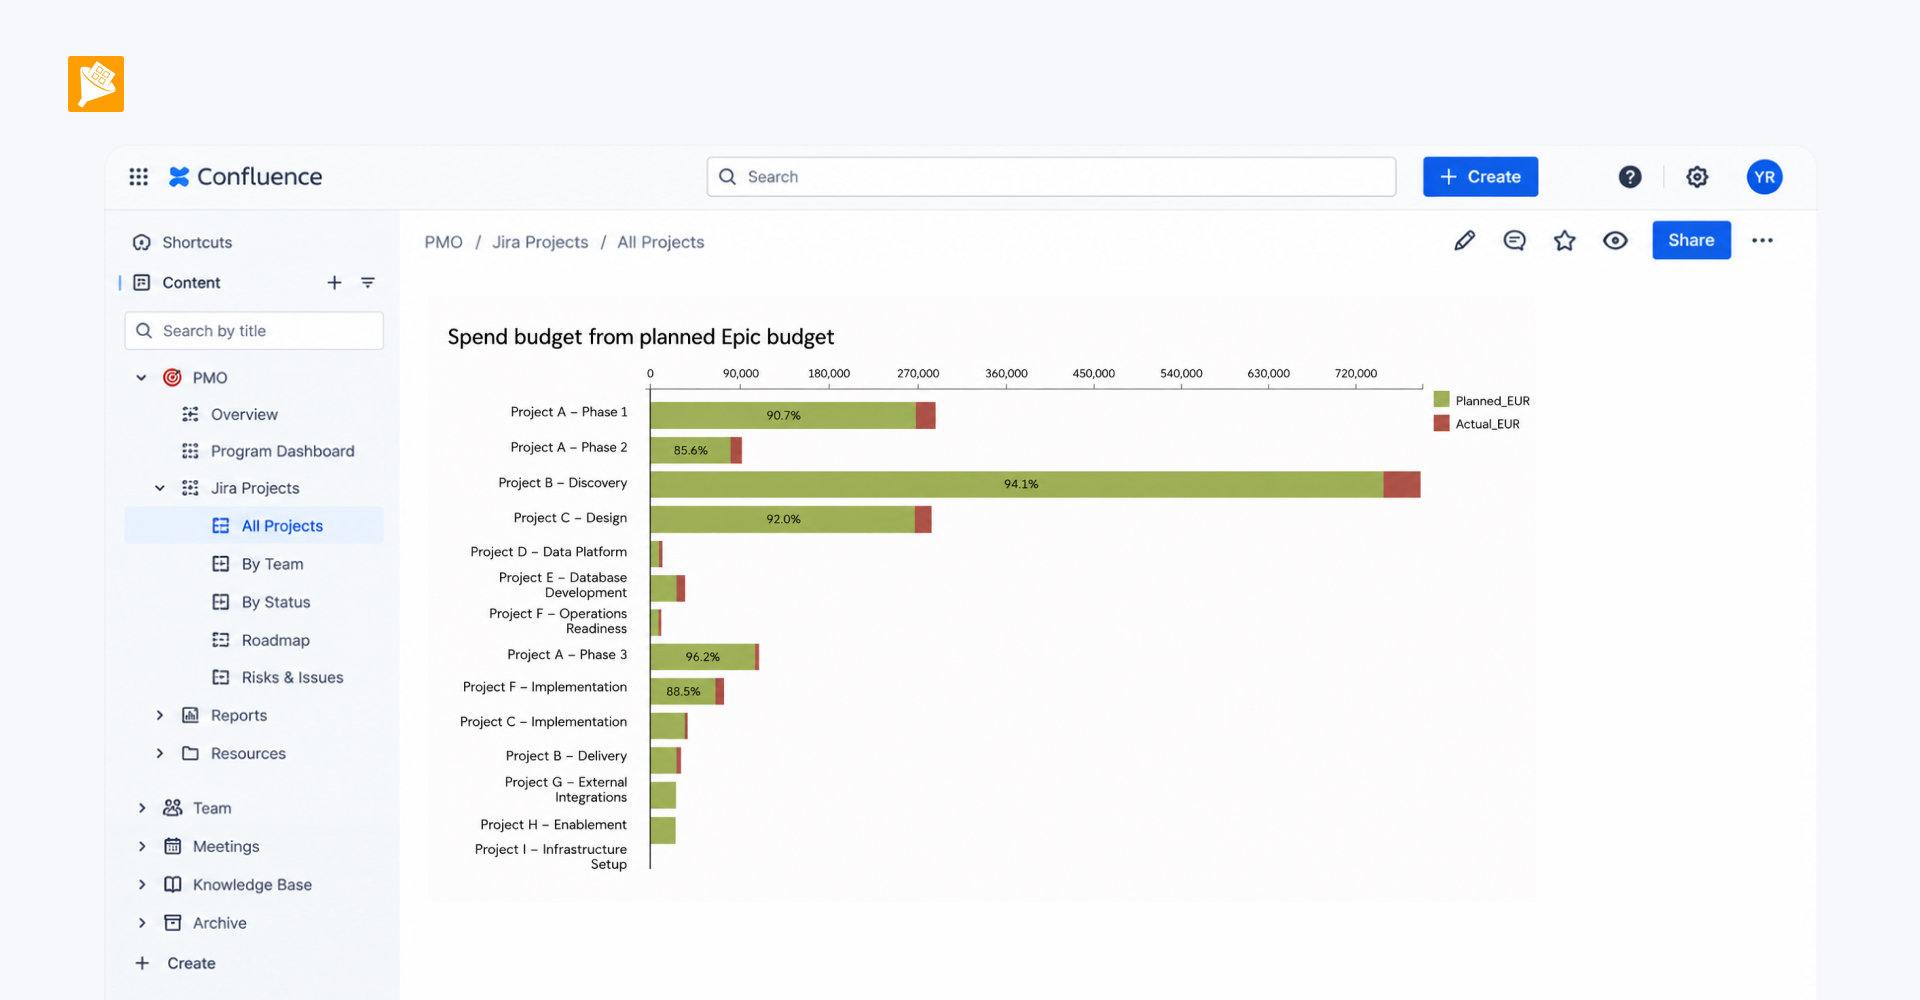
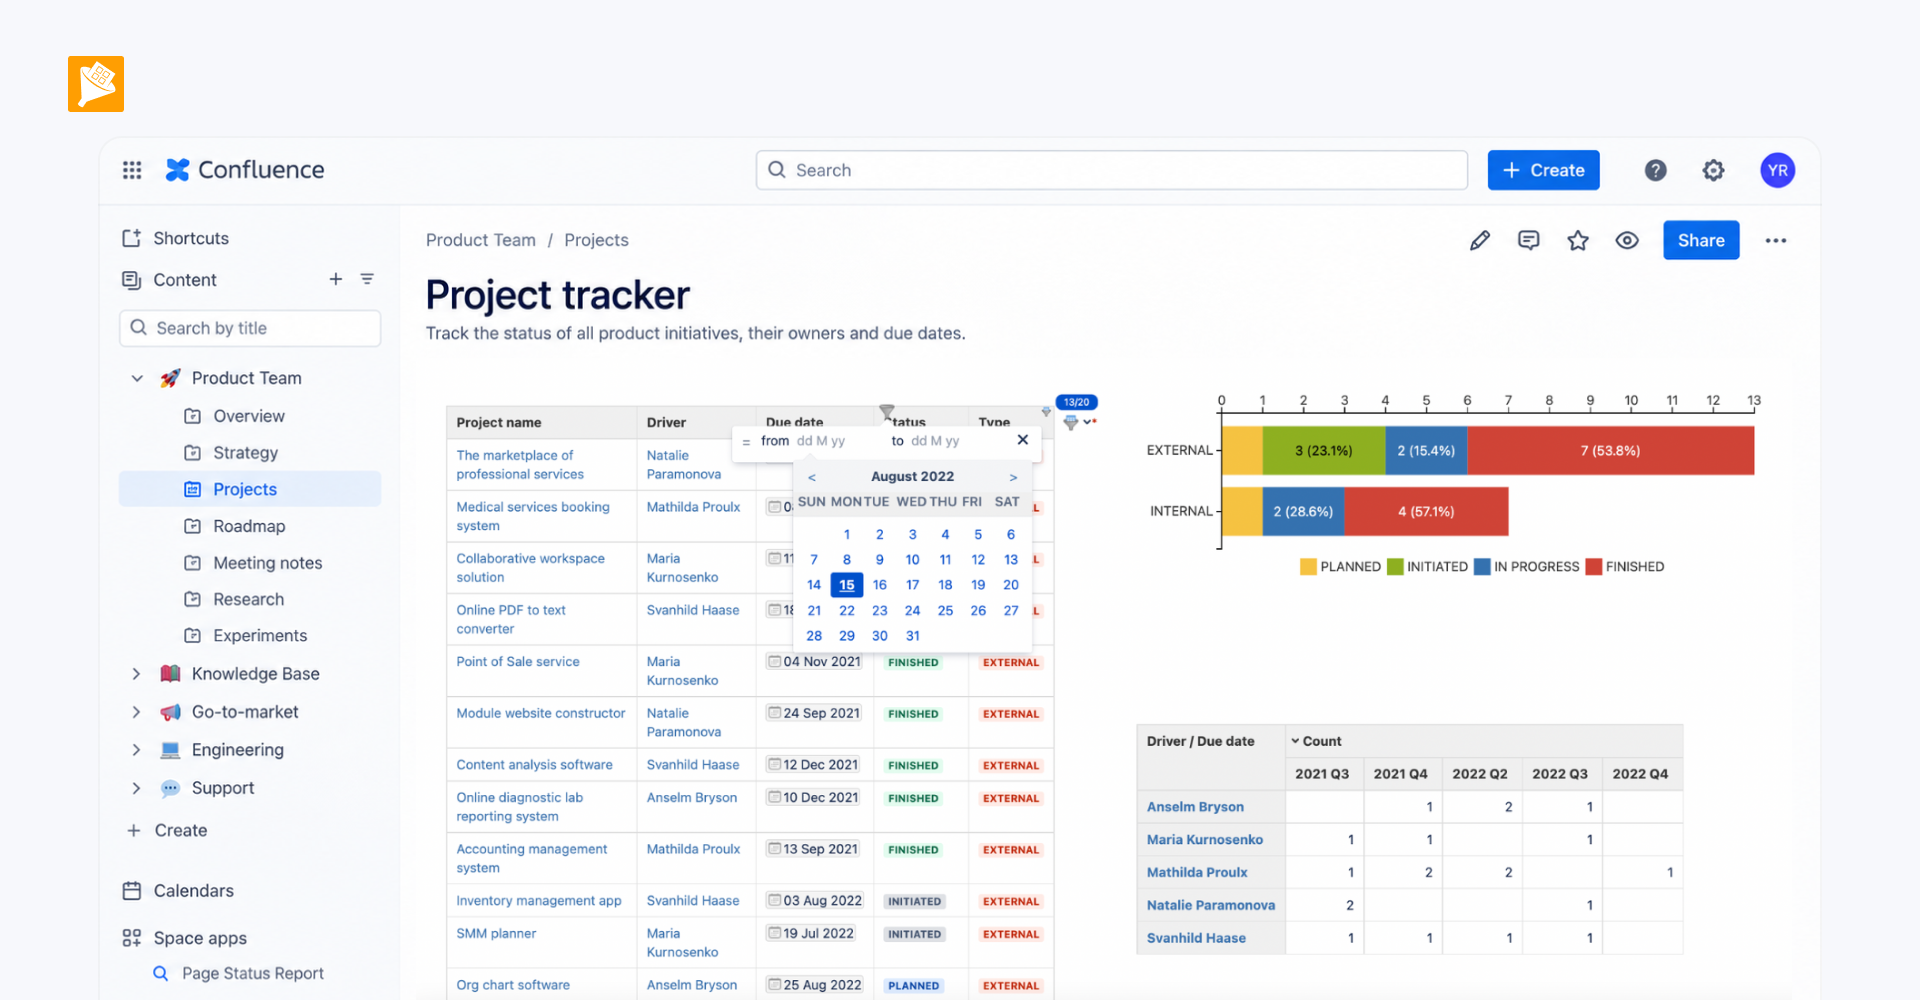
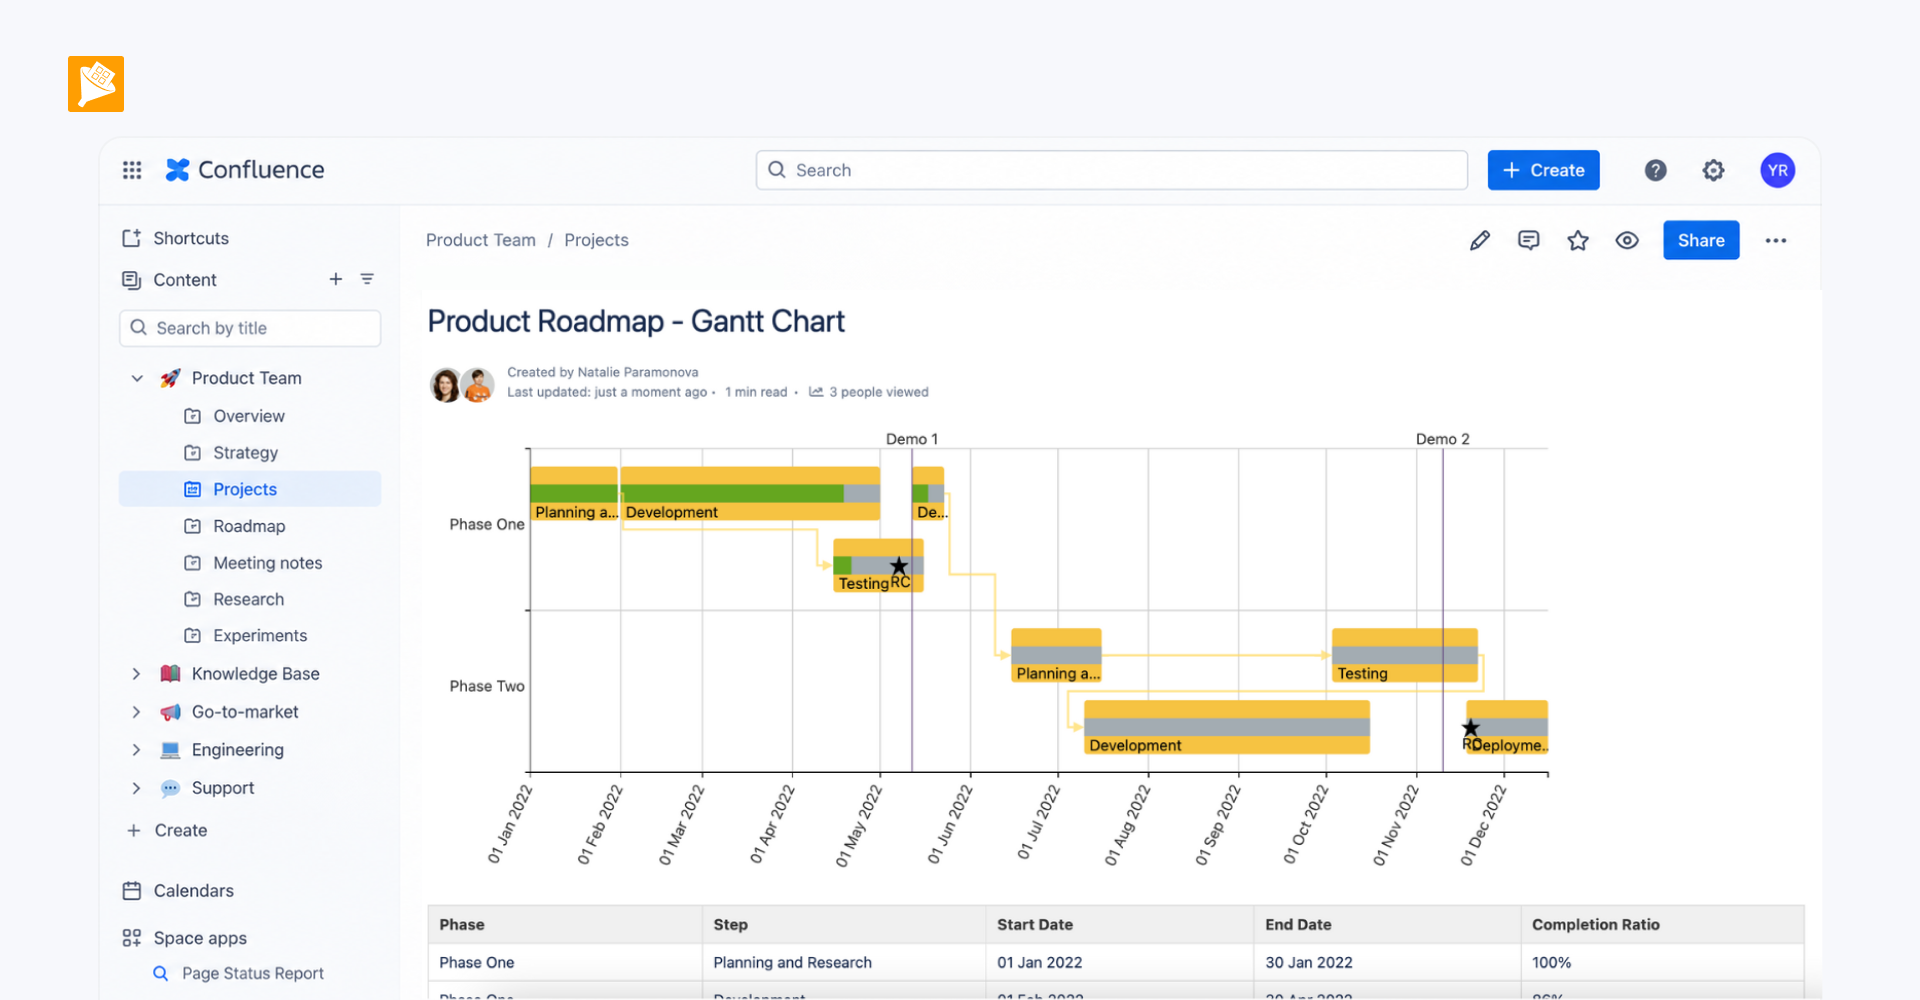
The project data is presented in Confluence as a visual roadmap that teams can use directly during meetings. Stakeholders can review timelines and dependencies and, when a question comes up, immediately narrow the view to a specific team or time period.
The customer described the experience as working almost like a PowerPoint slide — but with the ability to explore the underlying data live instead of preparing another view in advance.
How it is built
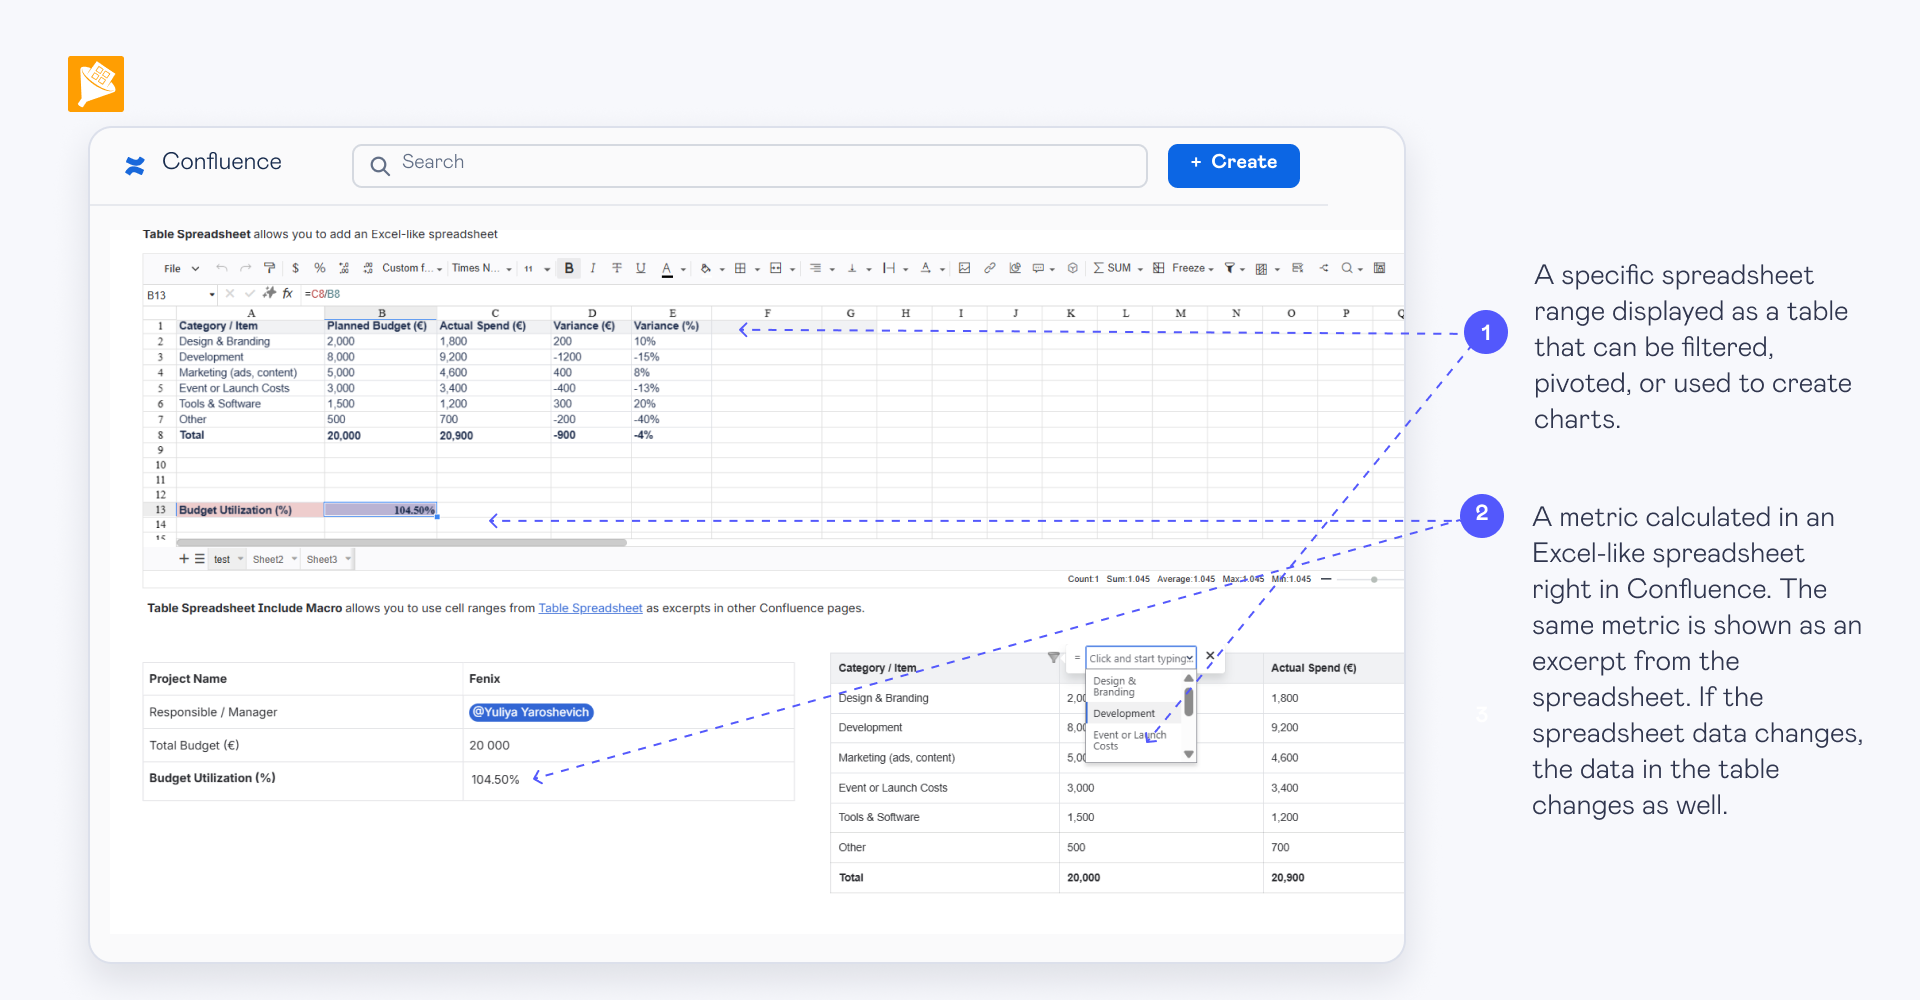
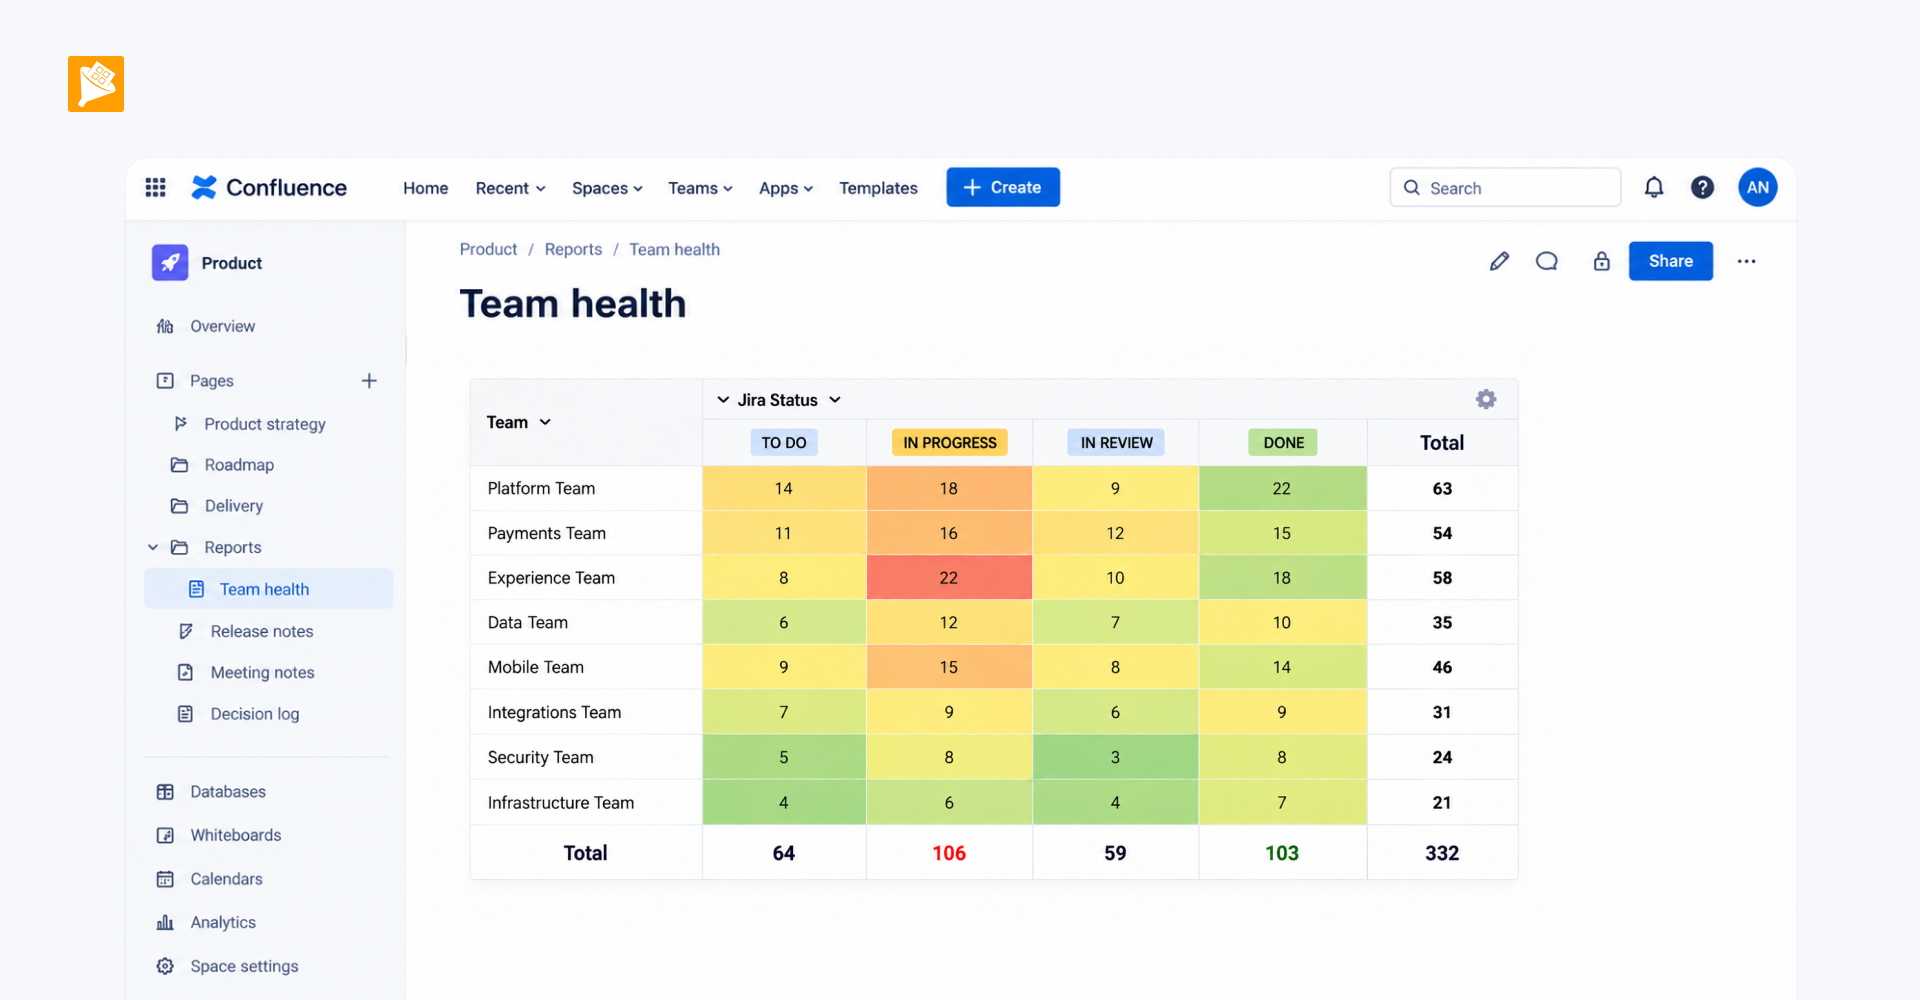
The roadmap combines Chart from Table for the Gantt view with Table Filter for interactive filtering during meetings.