15K+
 4.9/5
 3M
Track 40+ Jira projects across multiple business units in one custom report
Context and Challenge
An Engineering and Architecture lead oversees 40+ teams across multiple business units, with each team working in its own Jira project. The teams receive operational work from the central organization — from software updates and infrastructure changes to compliance tasks — organized as Sagas that can span many Jira projects at once.
To understand how a Saga was progressing across the organization, he had to open project after project, check each team’s status, and manually piece the results together. As the number of Sagas grew, this became impossible to manage on a regular basis.
He needed one cross-project view that would show the status of the same work across all teams and business units at once.
Result
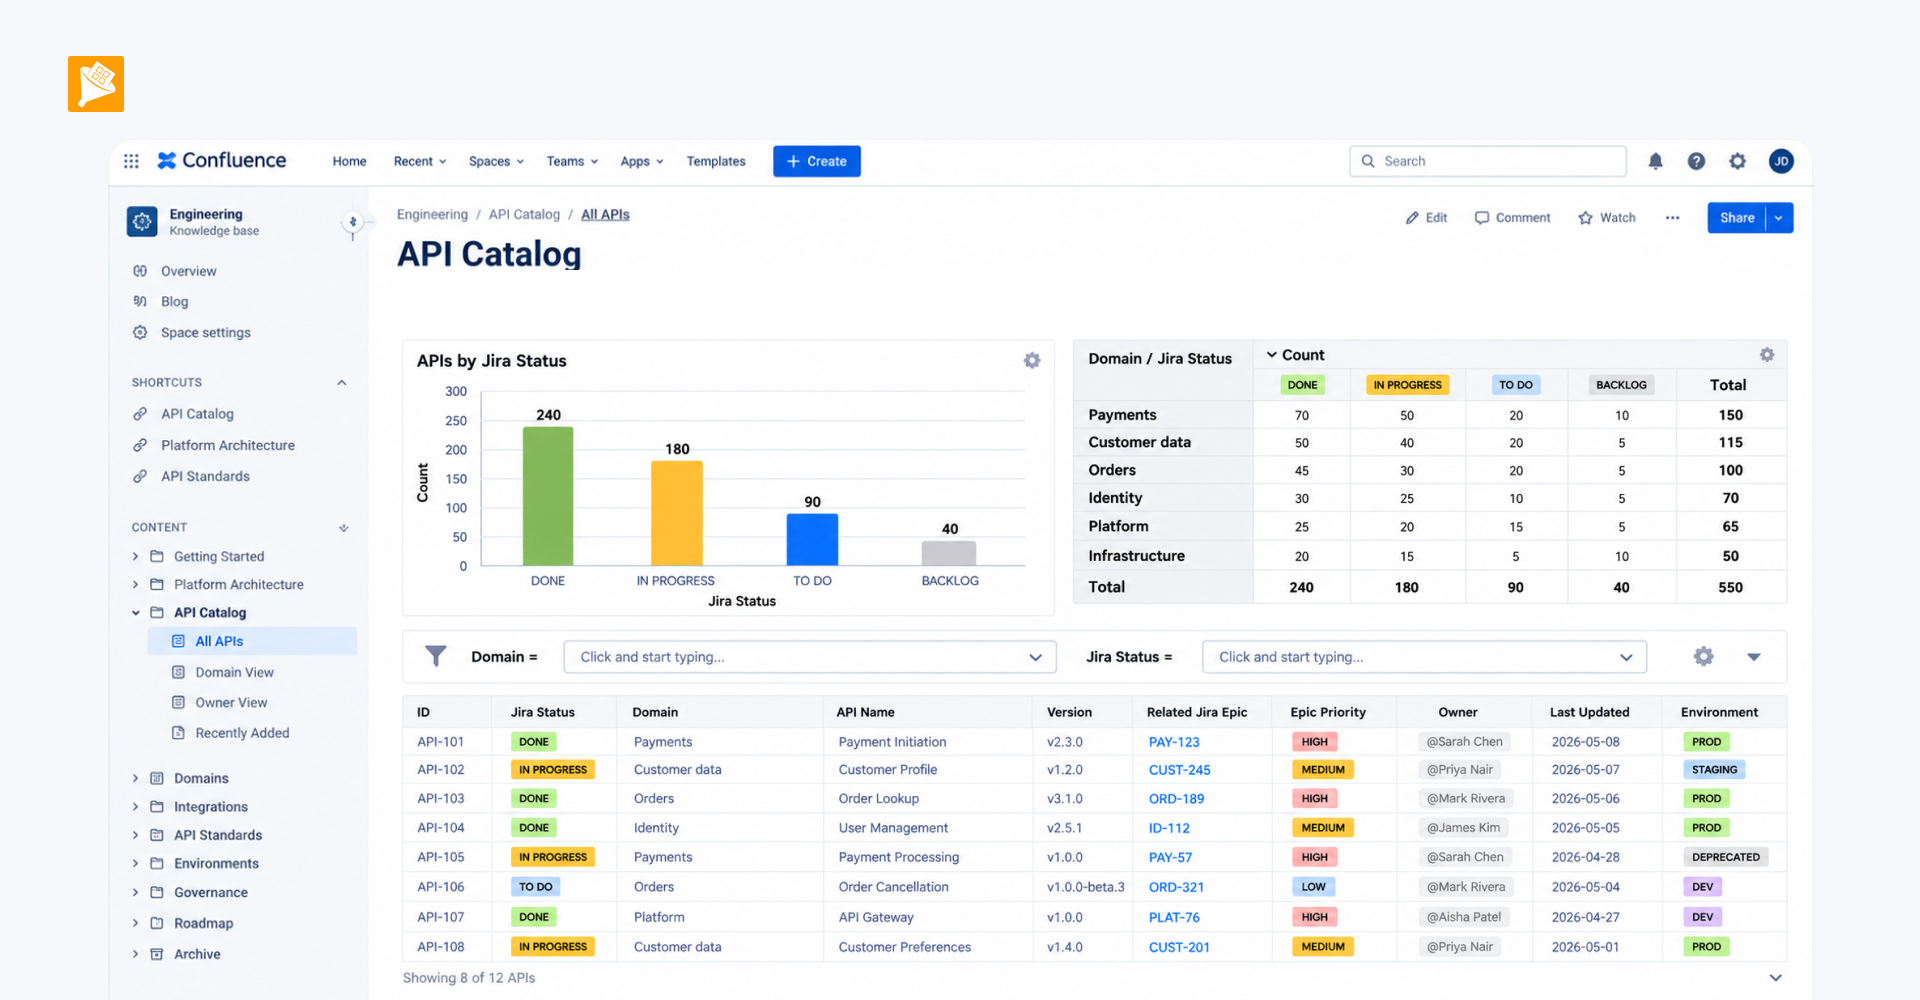
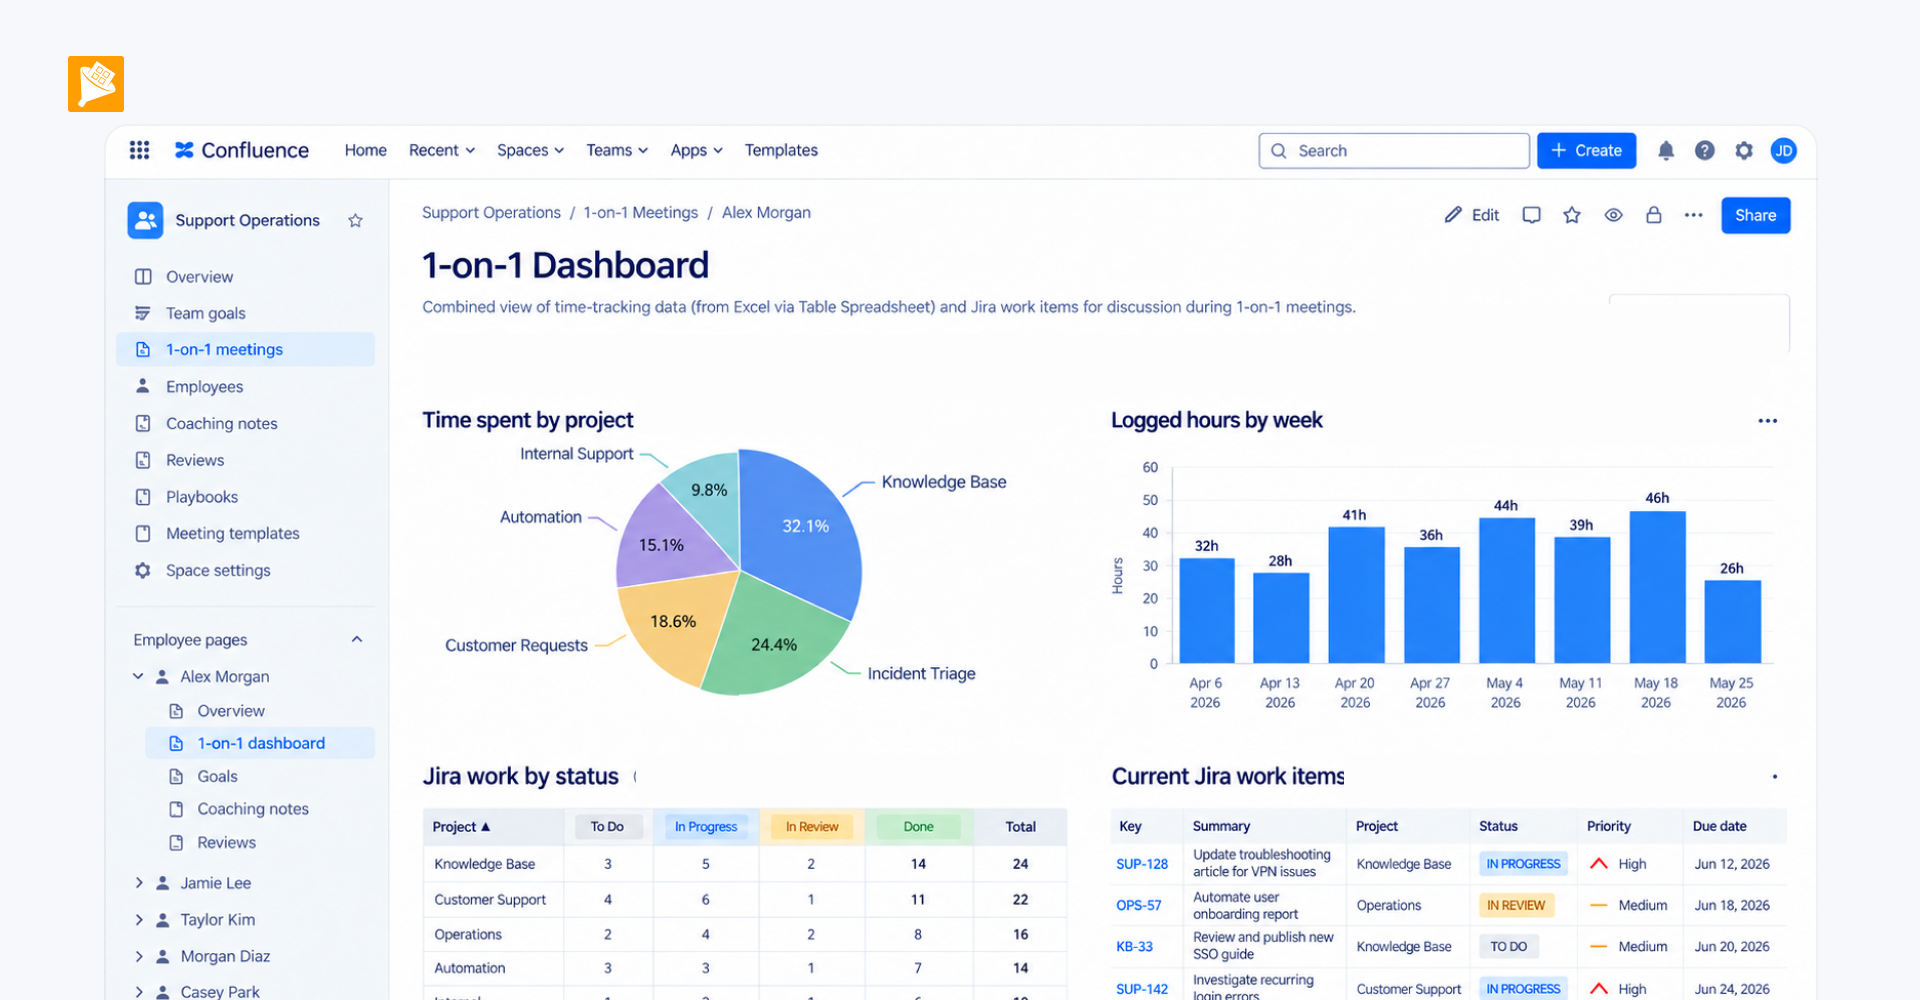
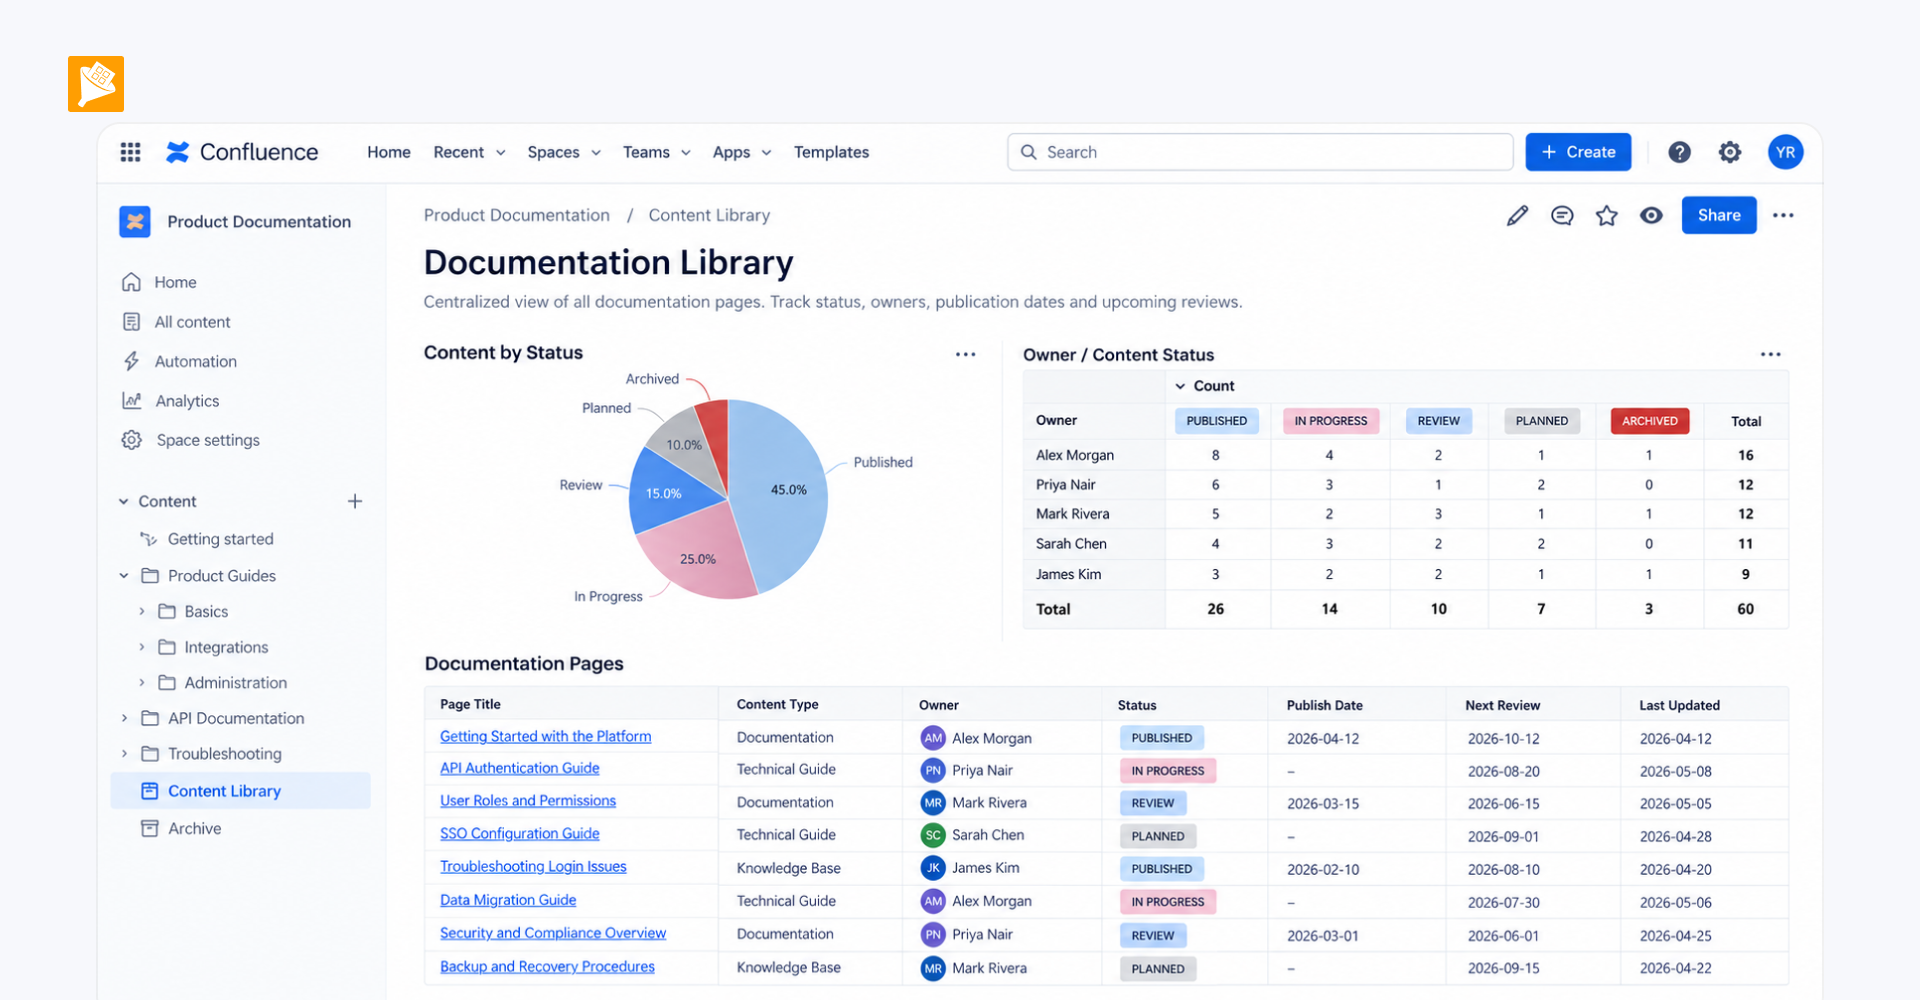
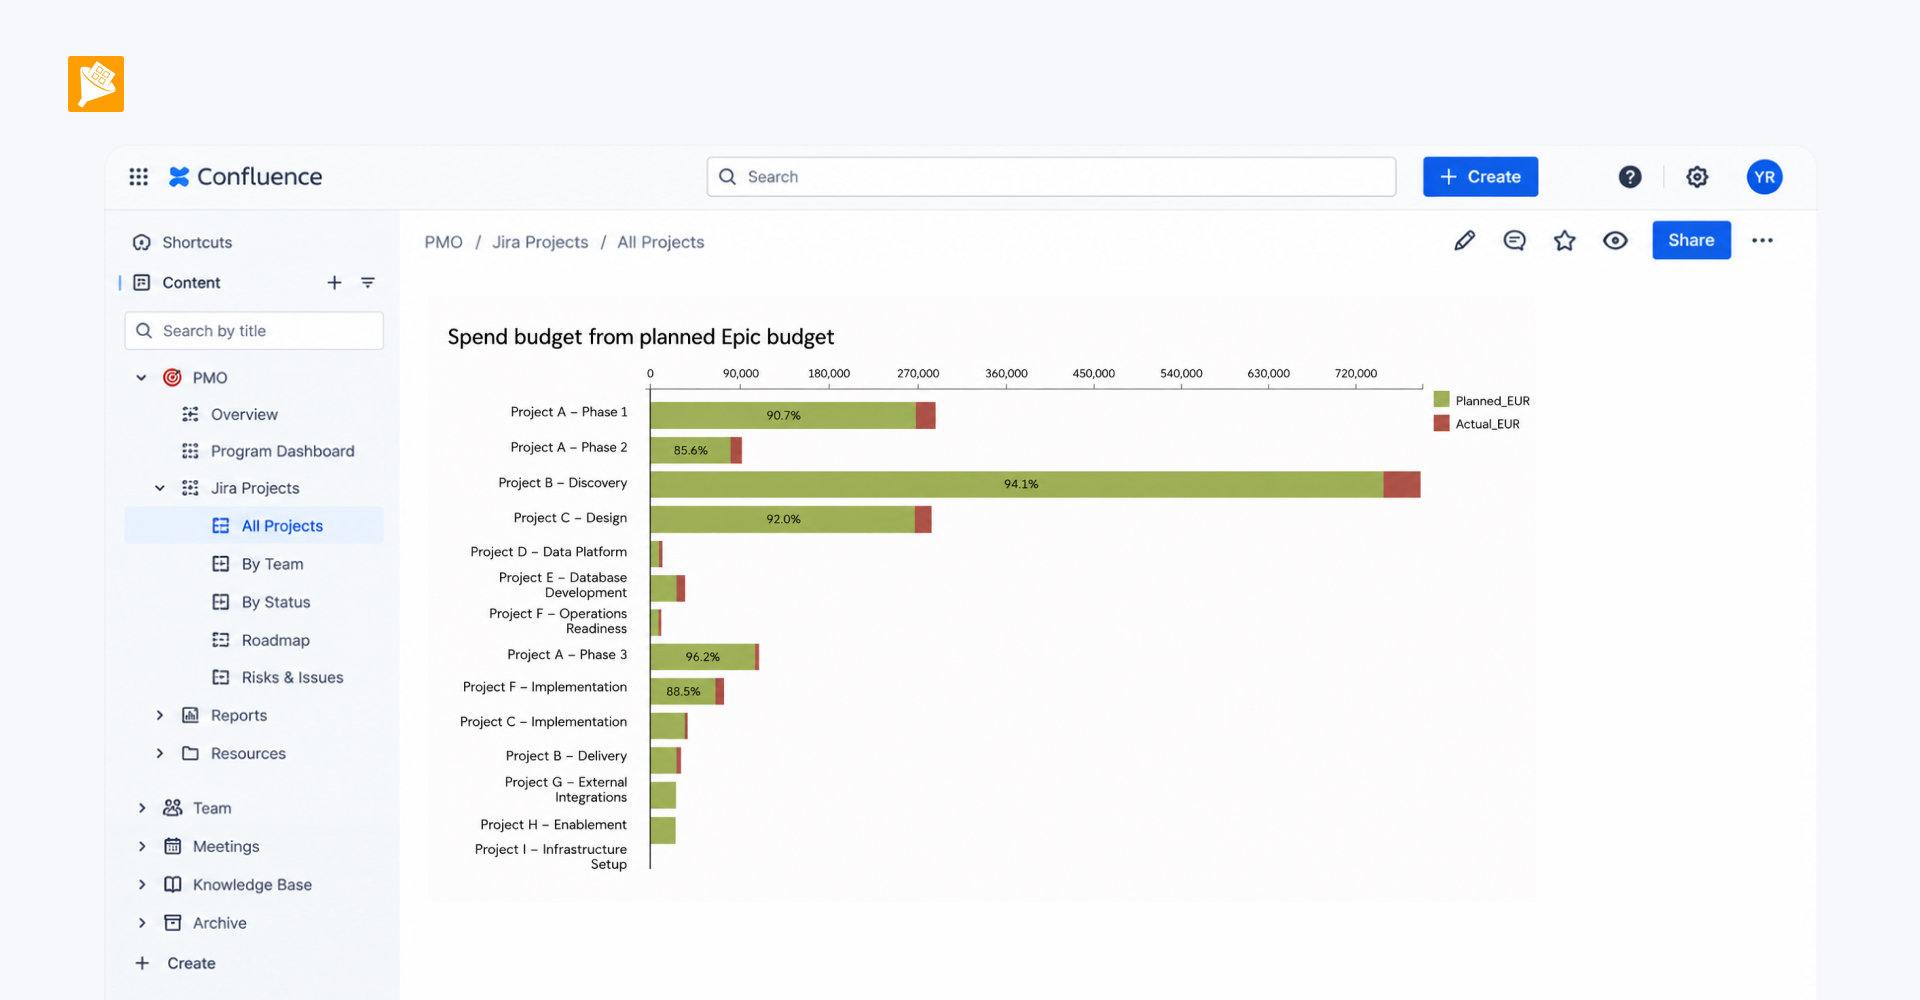
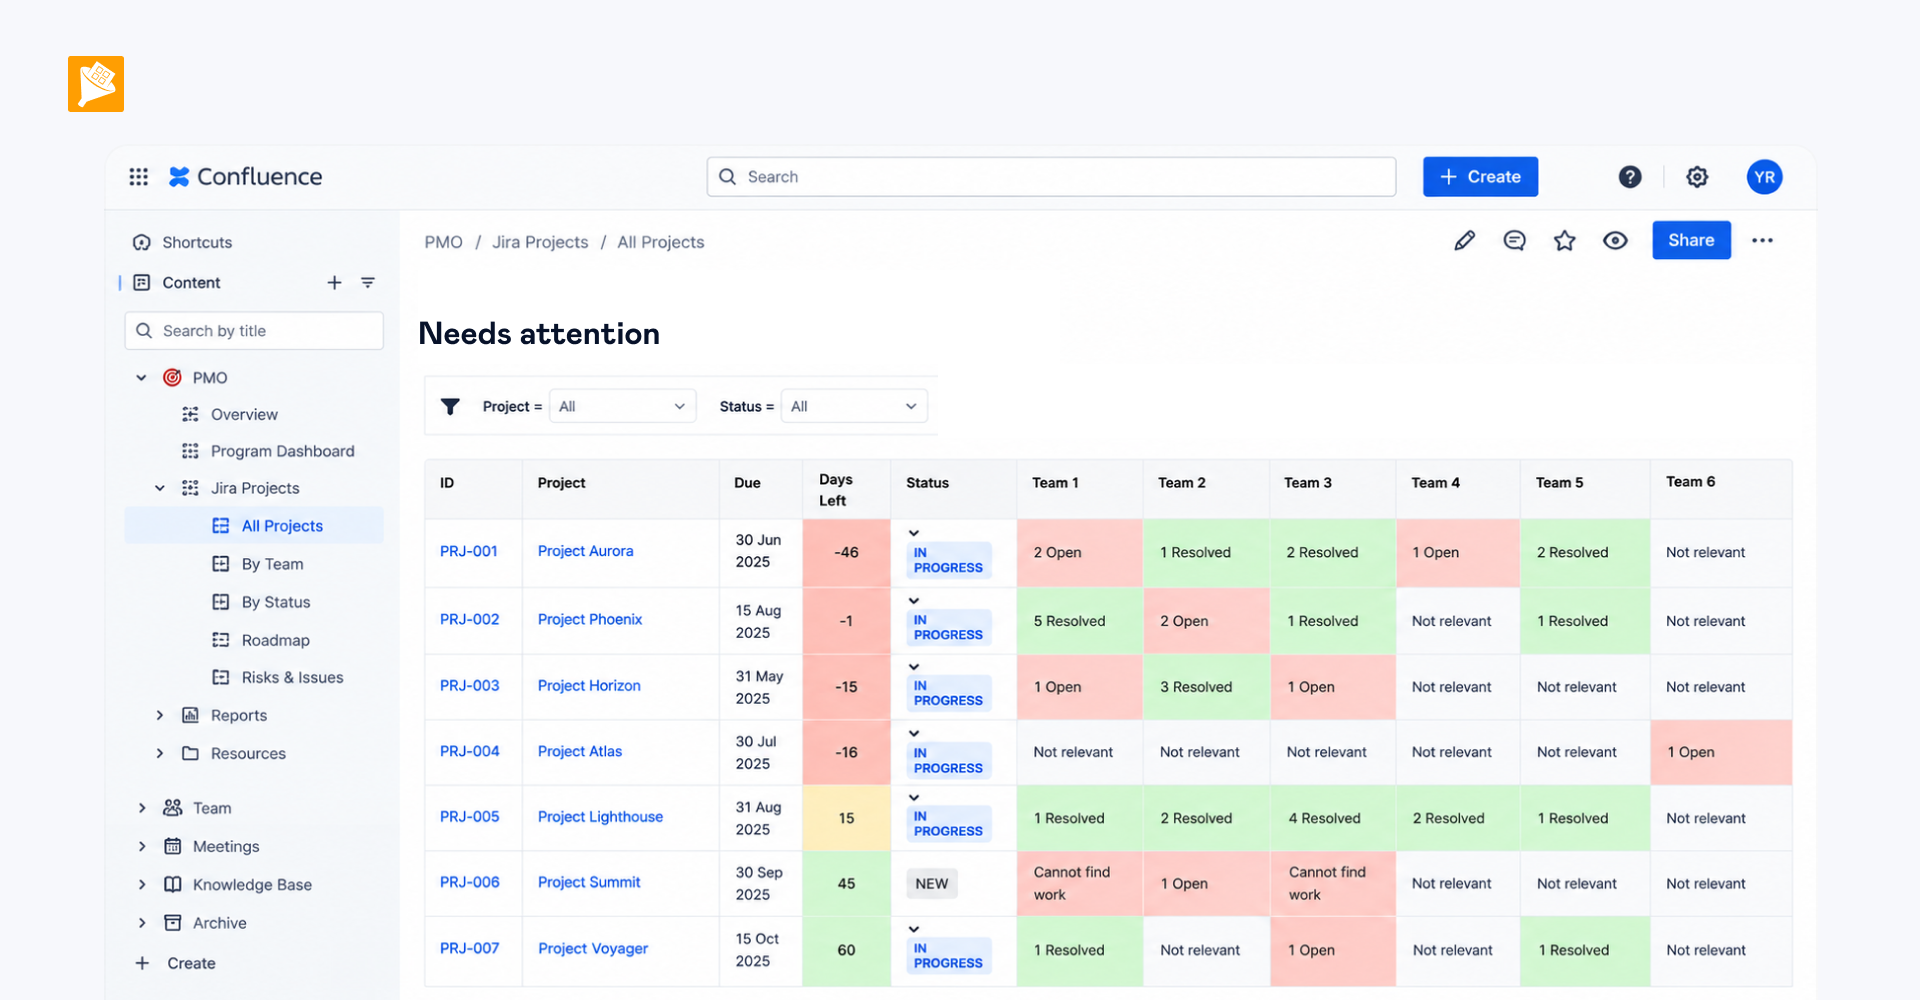
A single Confluence page now brings live data from 40+ Jira projects into one custom cross-project report.
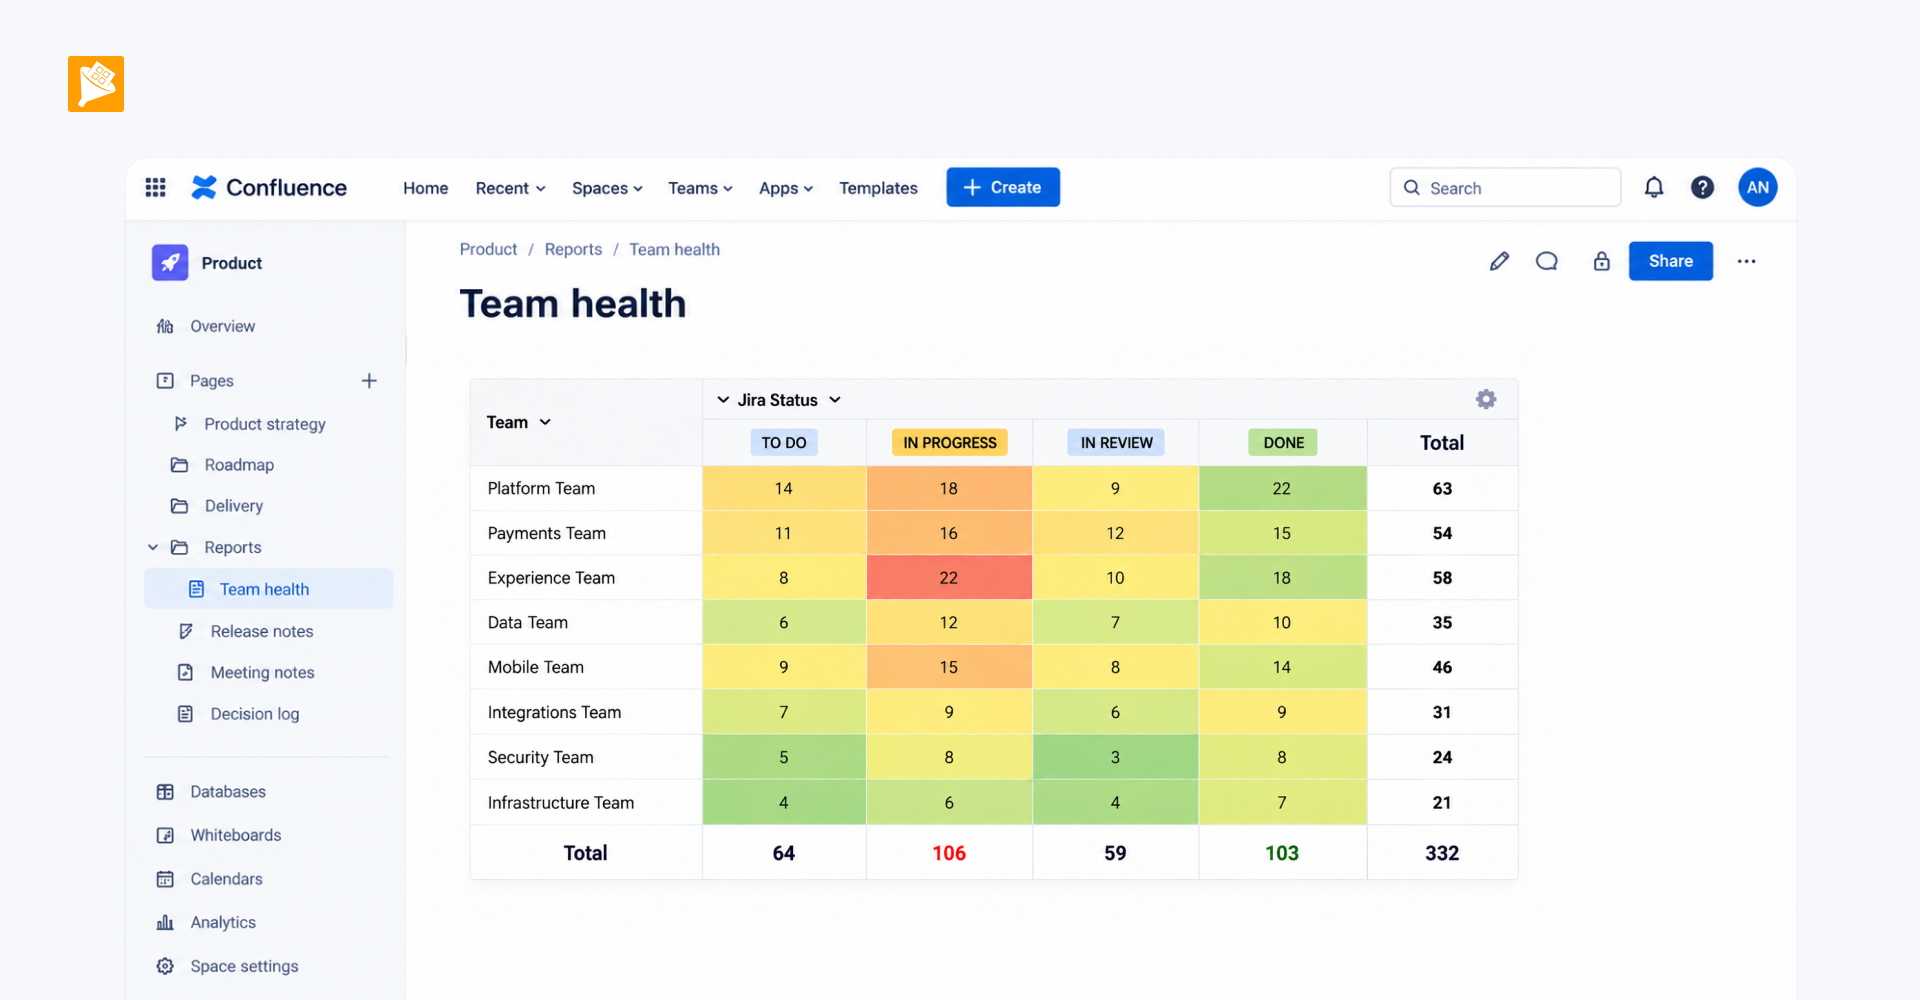
Data from 40+ Jira projects consolidated into a single table. Tasks grouped by team for a clear cross-project overview. Conditional formatting that instantly highlights overdue work, completed tasks, and areas requiring attention.
How it is built
The solution combines several macros working together:
- Jira Work Items macros pull live data from each project.
- Table Transformer joins tables, applies logic, and structures the output.
- Pivot Table reshapes the data into a matrix that maps Sagas against business units (teams).
- Table Excerpt feeds processed tables into other pages or sections.