15K+
 4.9/5
 3M
Standardize project and service information across the company in Confluence
Context and Challenge
Confluence is the primary tool for IT project and service management in an organization with around 5,000 Confluence users and 3,500 Jira users. Information is spread across a large hierarchy of team, sub-team, service, and project spaces.
At this scale, if every team structures project and service information differently, it becomes difficult to reuse that information or get a consistent view beyond an individual page.
The organization needed a company-wide standard for how project, service, and team information is structured in Confluence — one that teams could follow without creating their own reporting setup from scratch.
Result
Teams across the organization use a consistent approach to maintaining project and service information in Confluence.
The same information can be reused at different organizational levels without maintaining separate master tables or manually rebuilding reports. Teams can keep detailed information where it belongs while still getting consolidated views whenever they need them.
How it is built
- The organization uses a standard structure and common templates for project, service, sub-team, and team information.
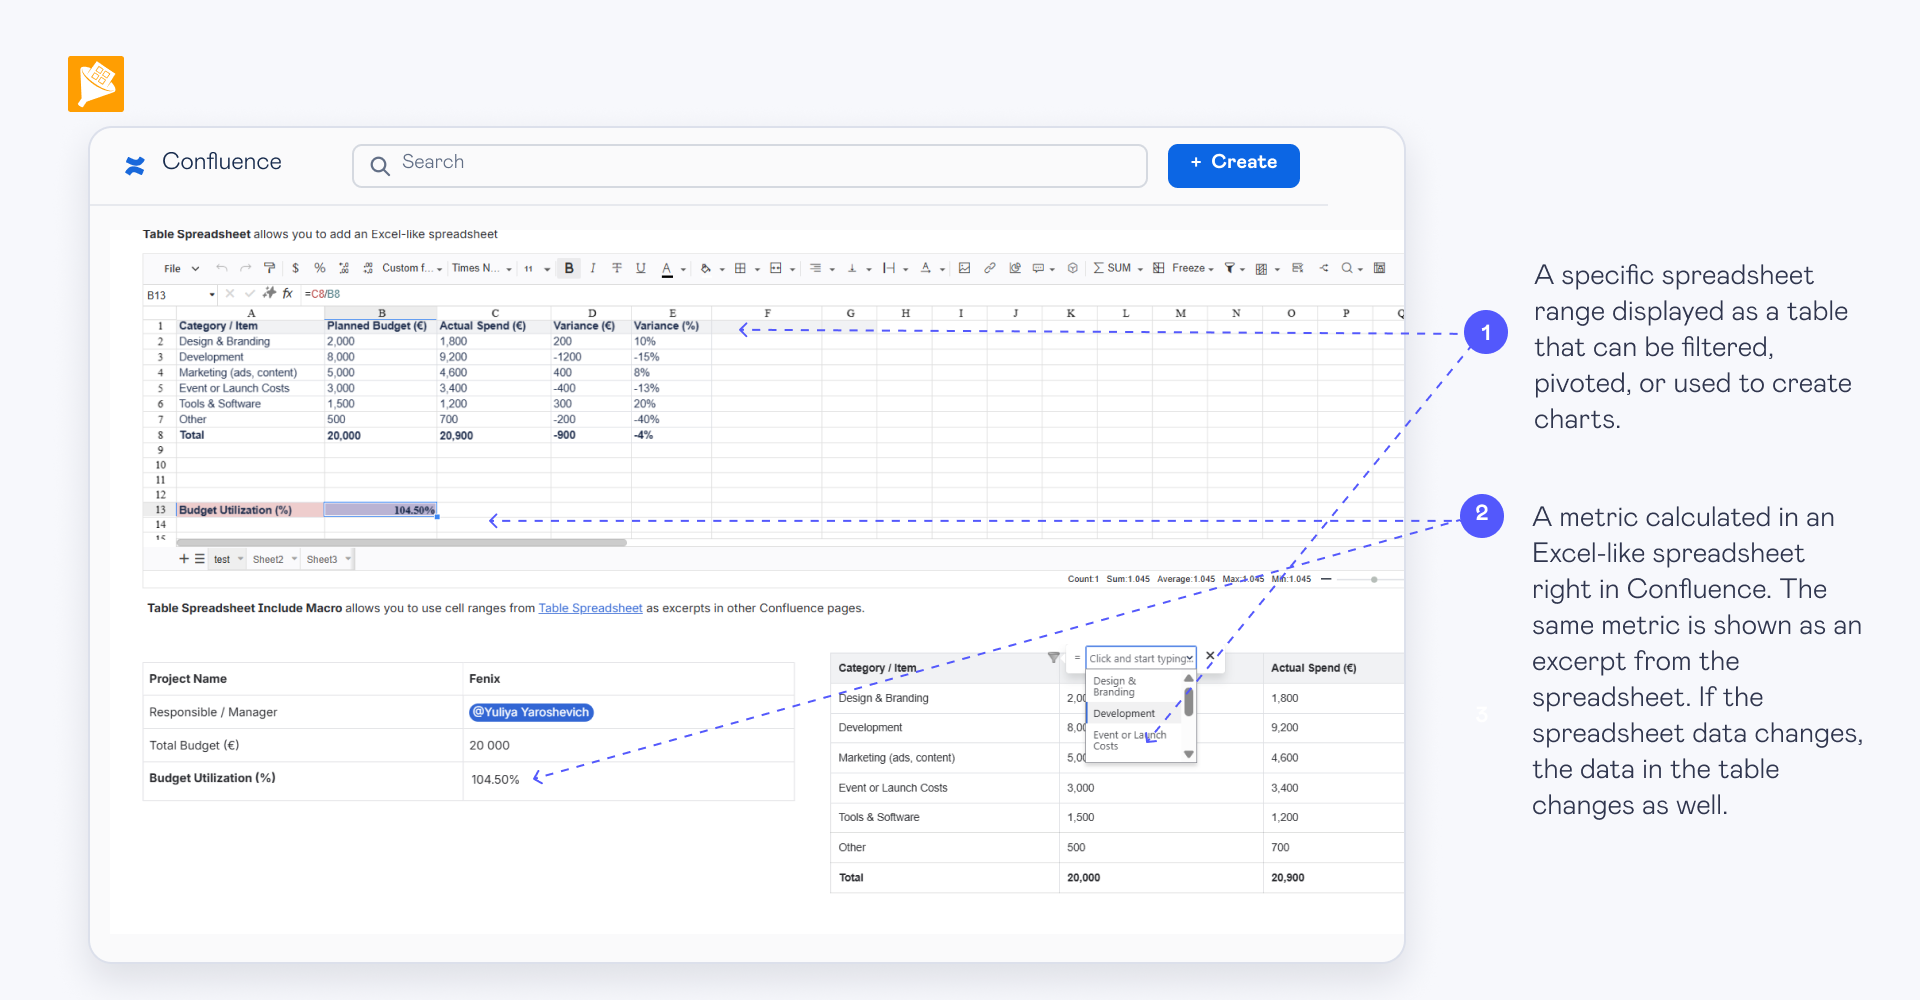
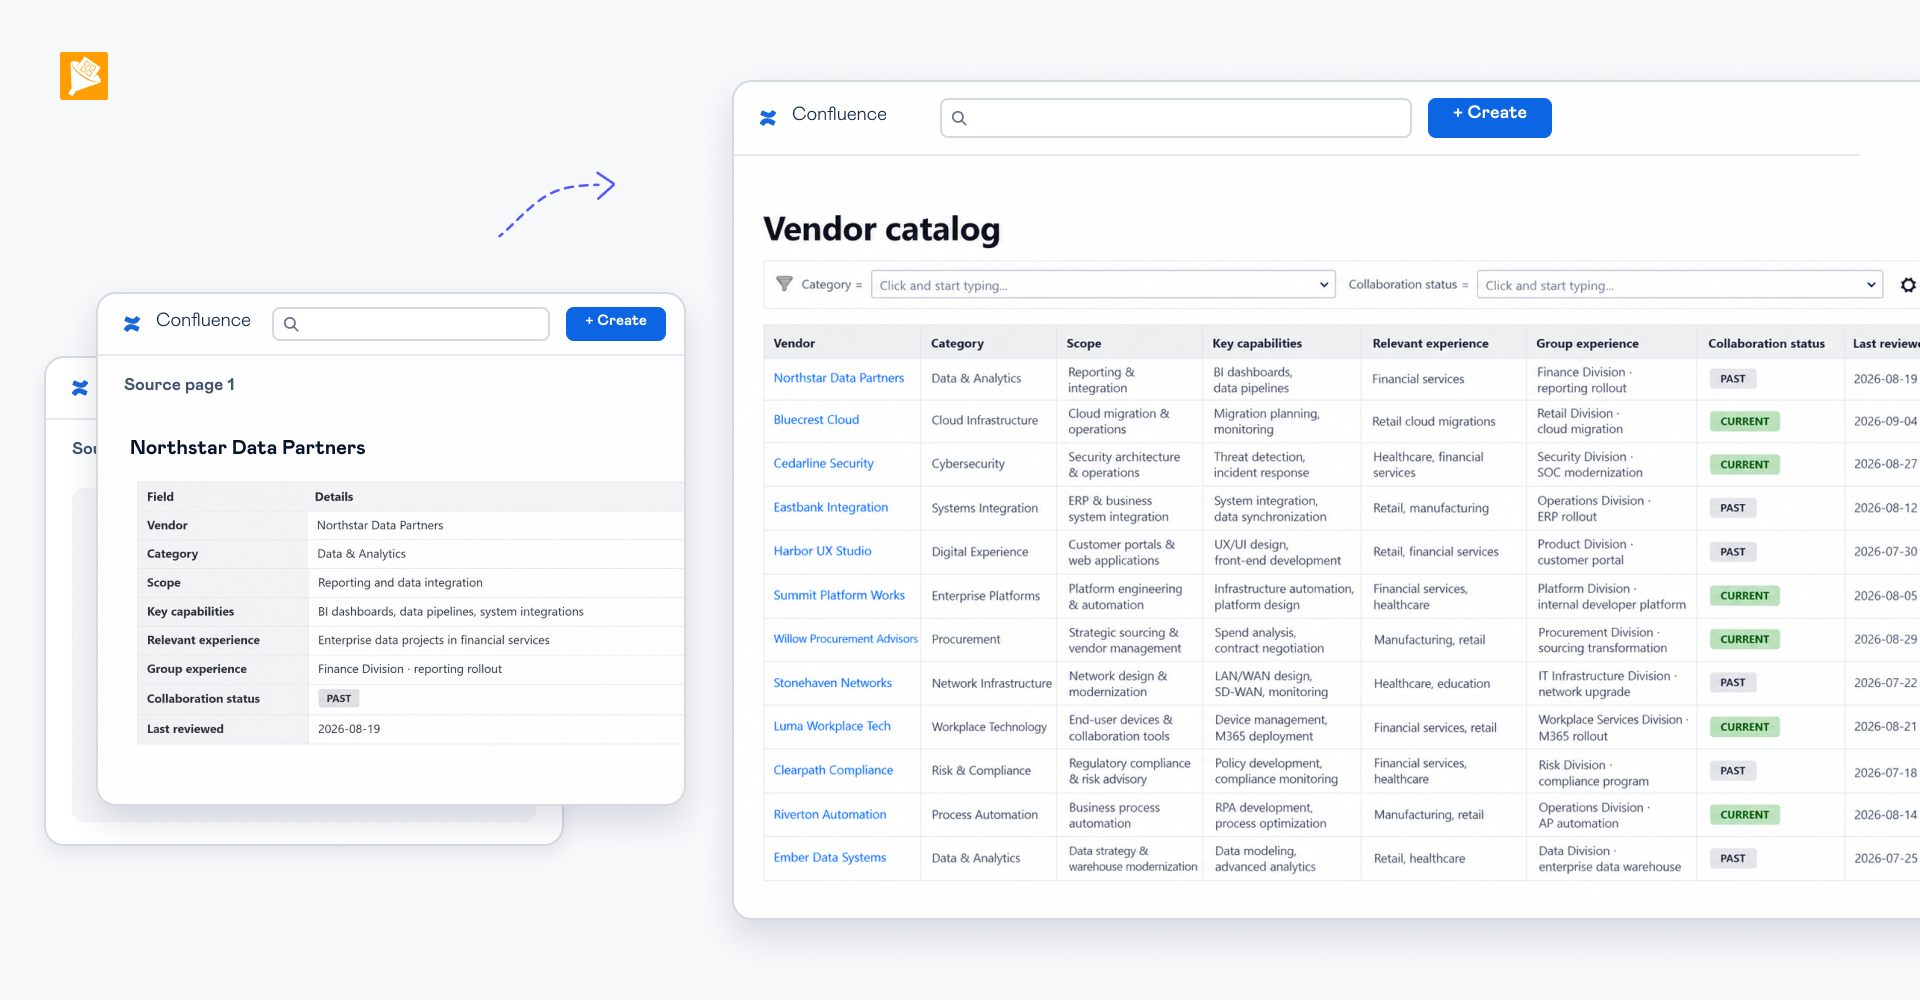
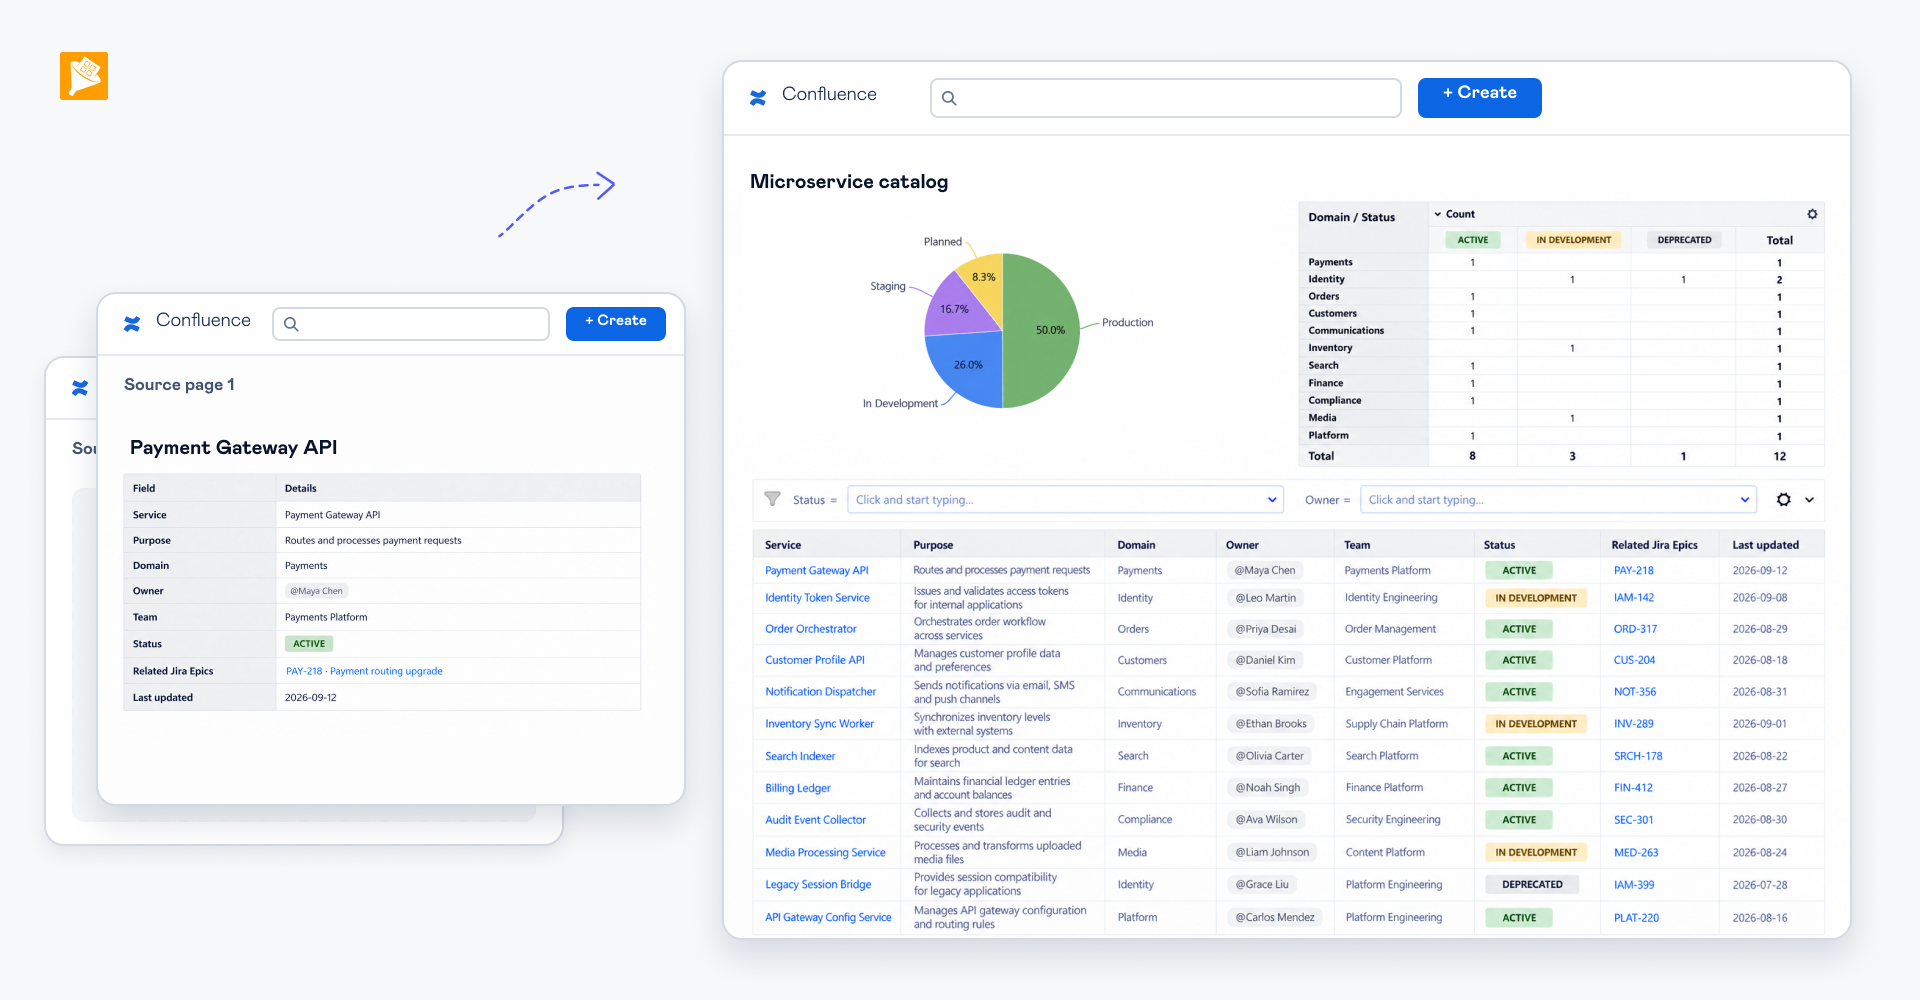
- Information about each project within a service is maintained on a separate Confluence page. Core information is stored in a structured table and wrapped in Page Properties / Content Properties or Table Excerpt.
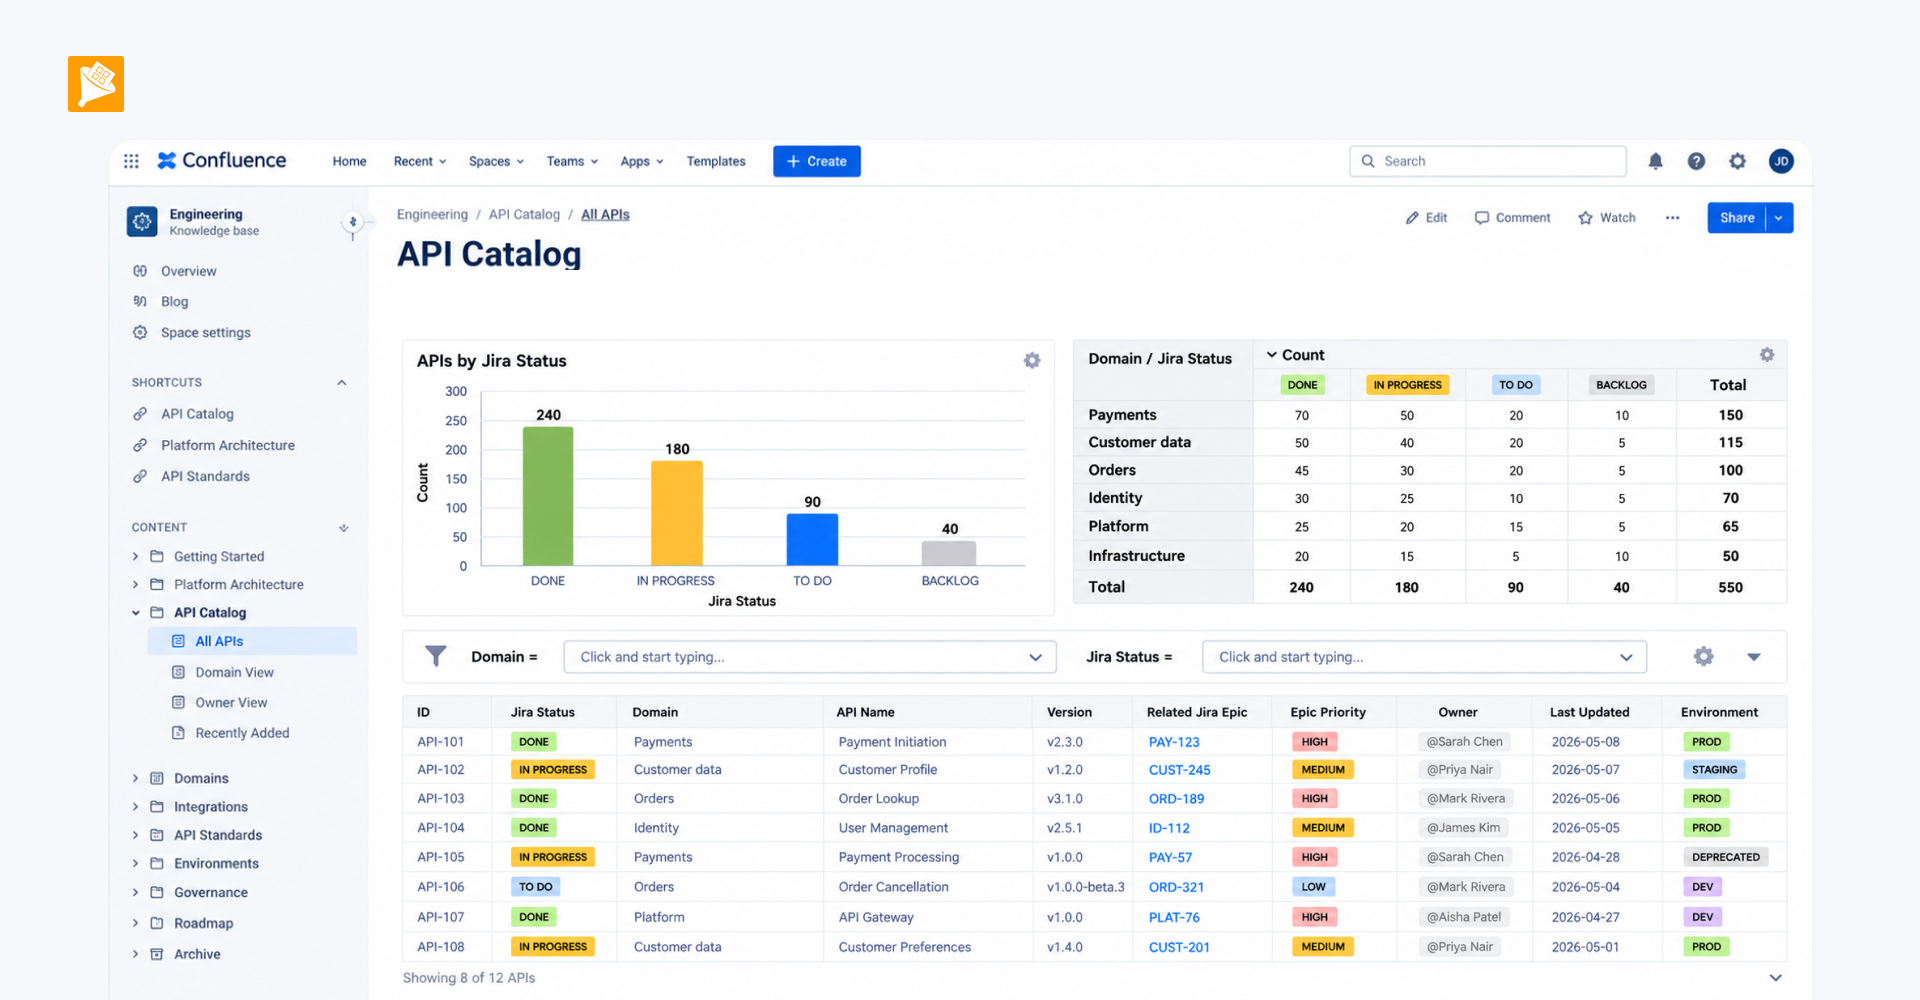
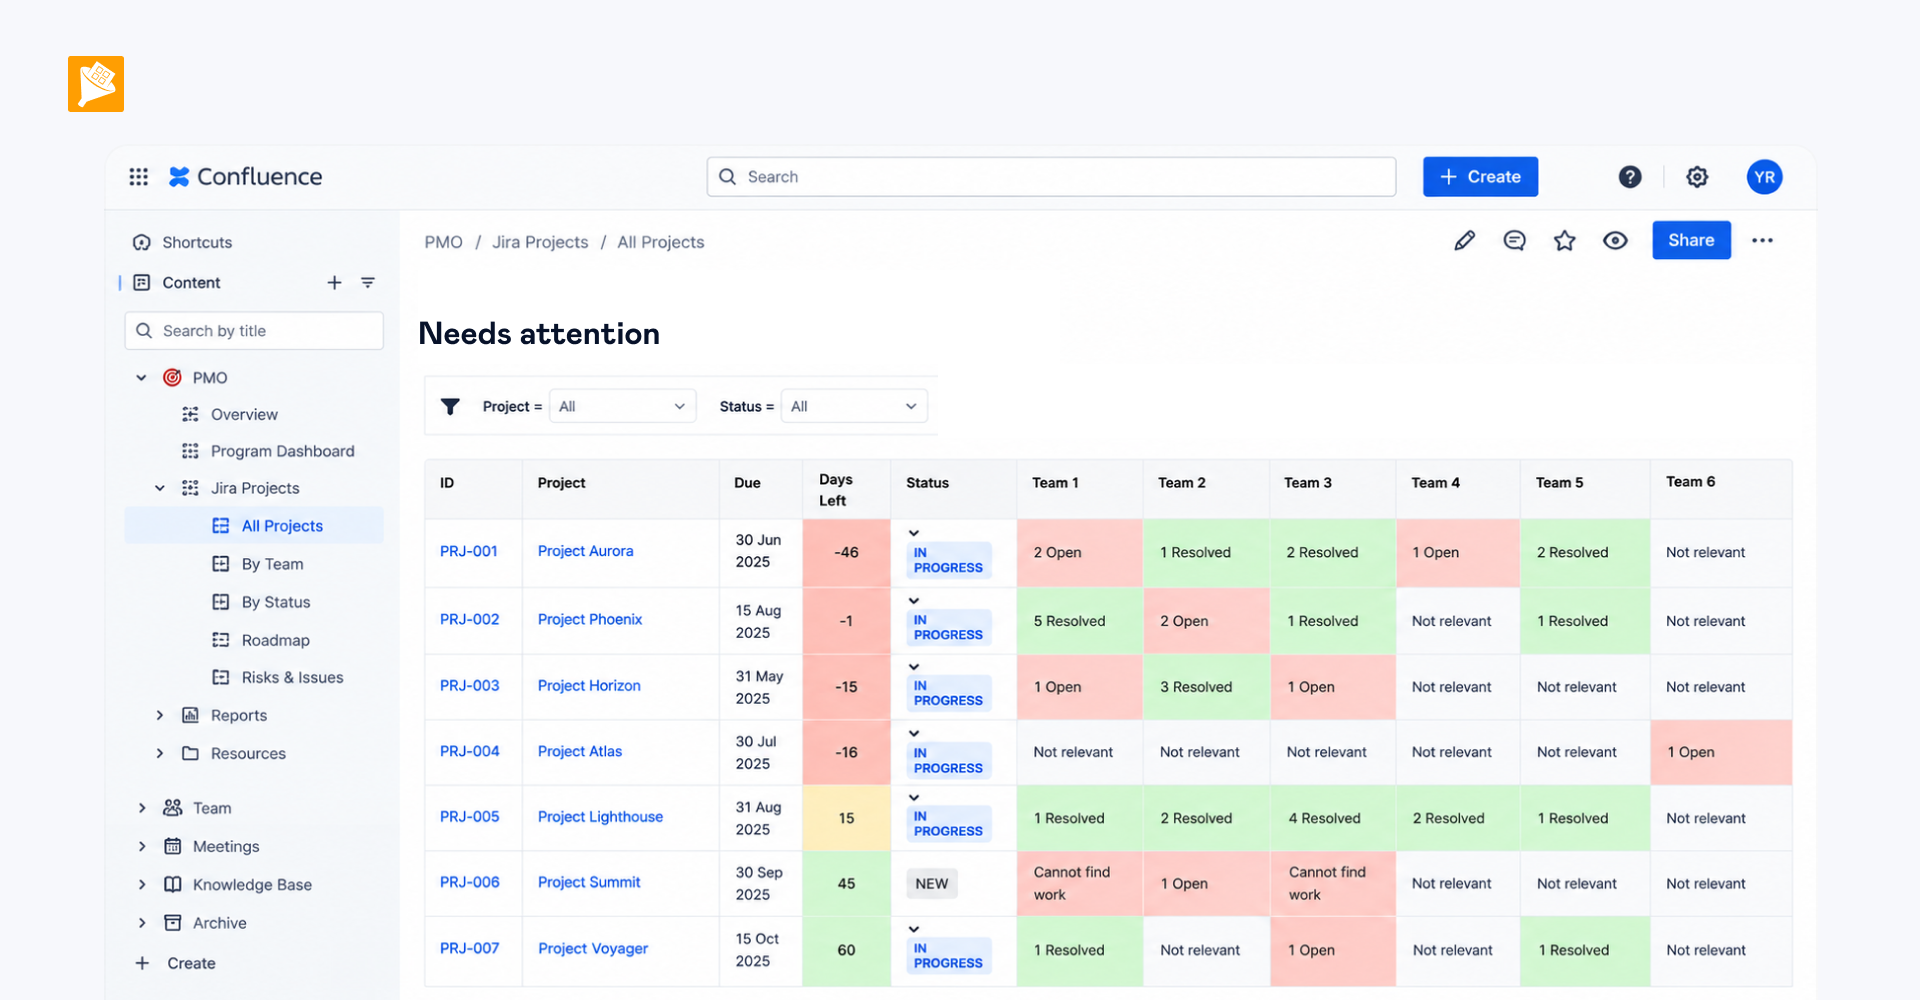
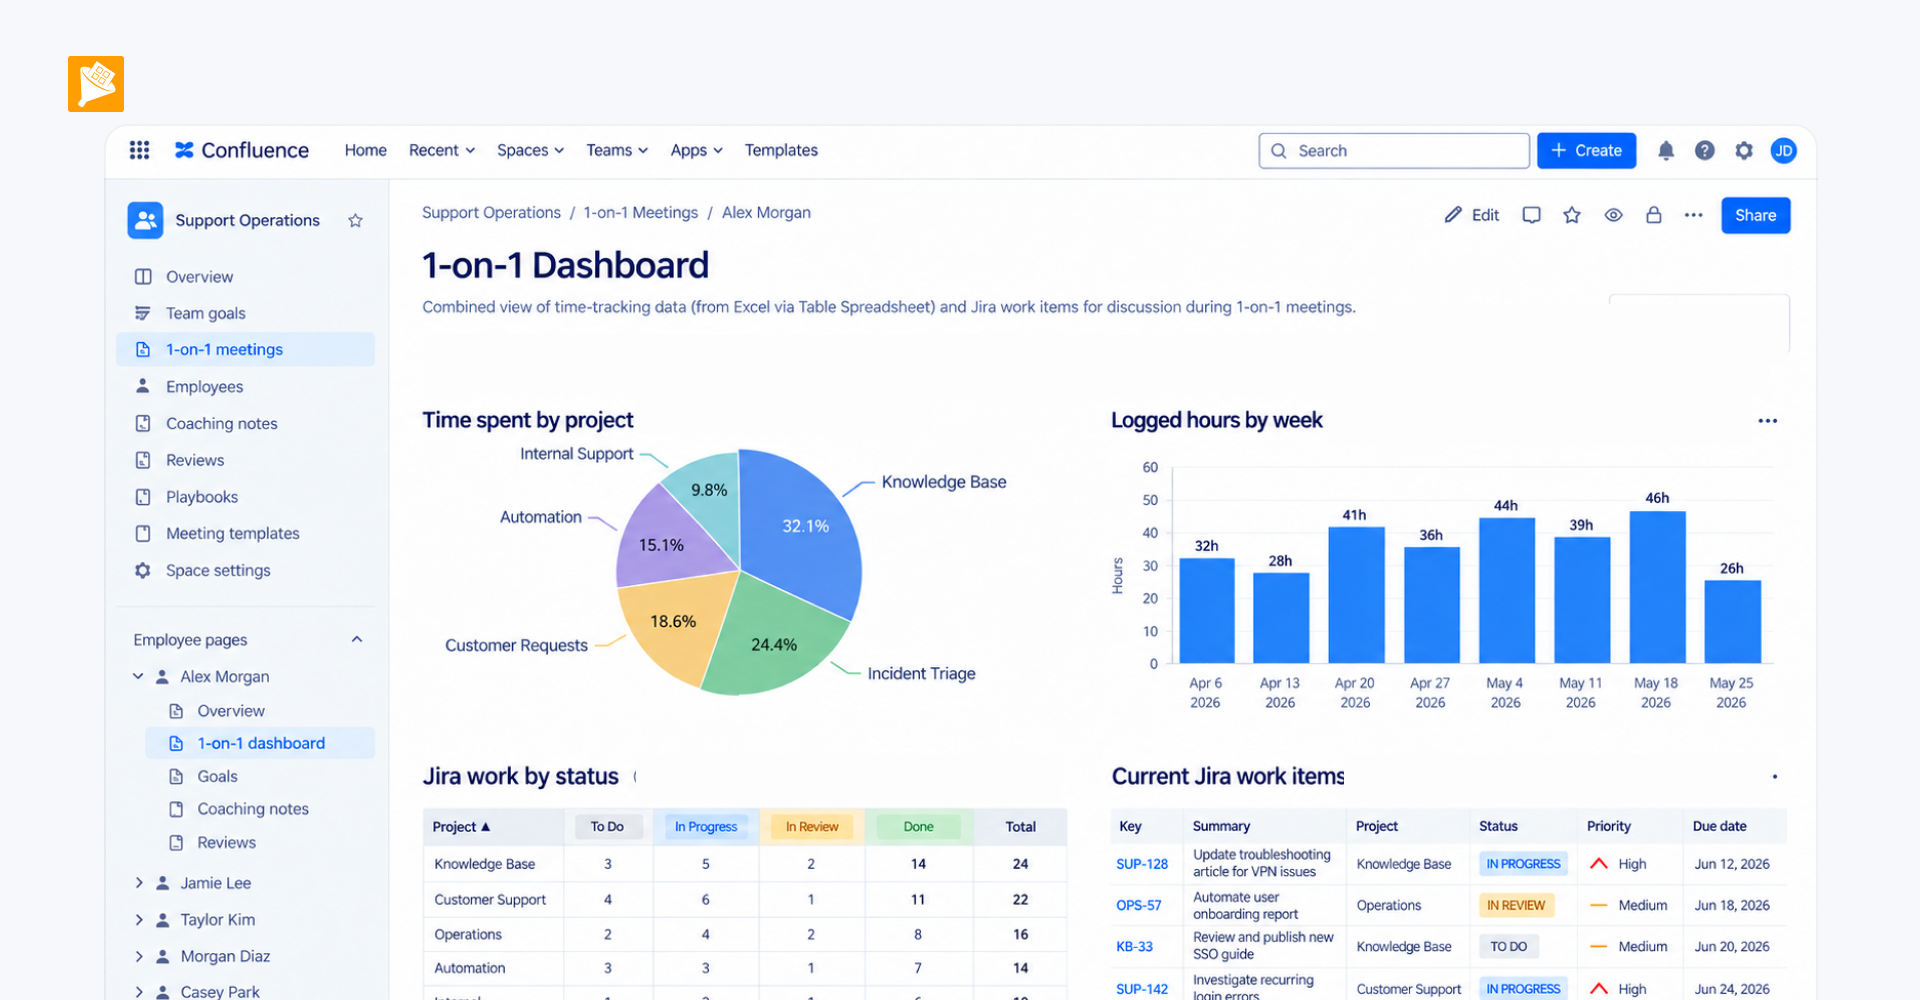
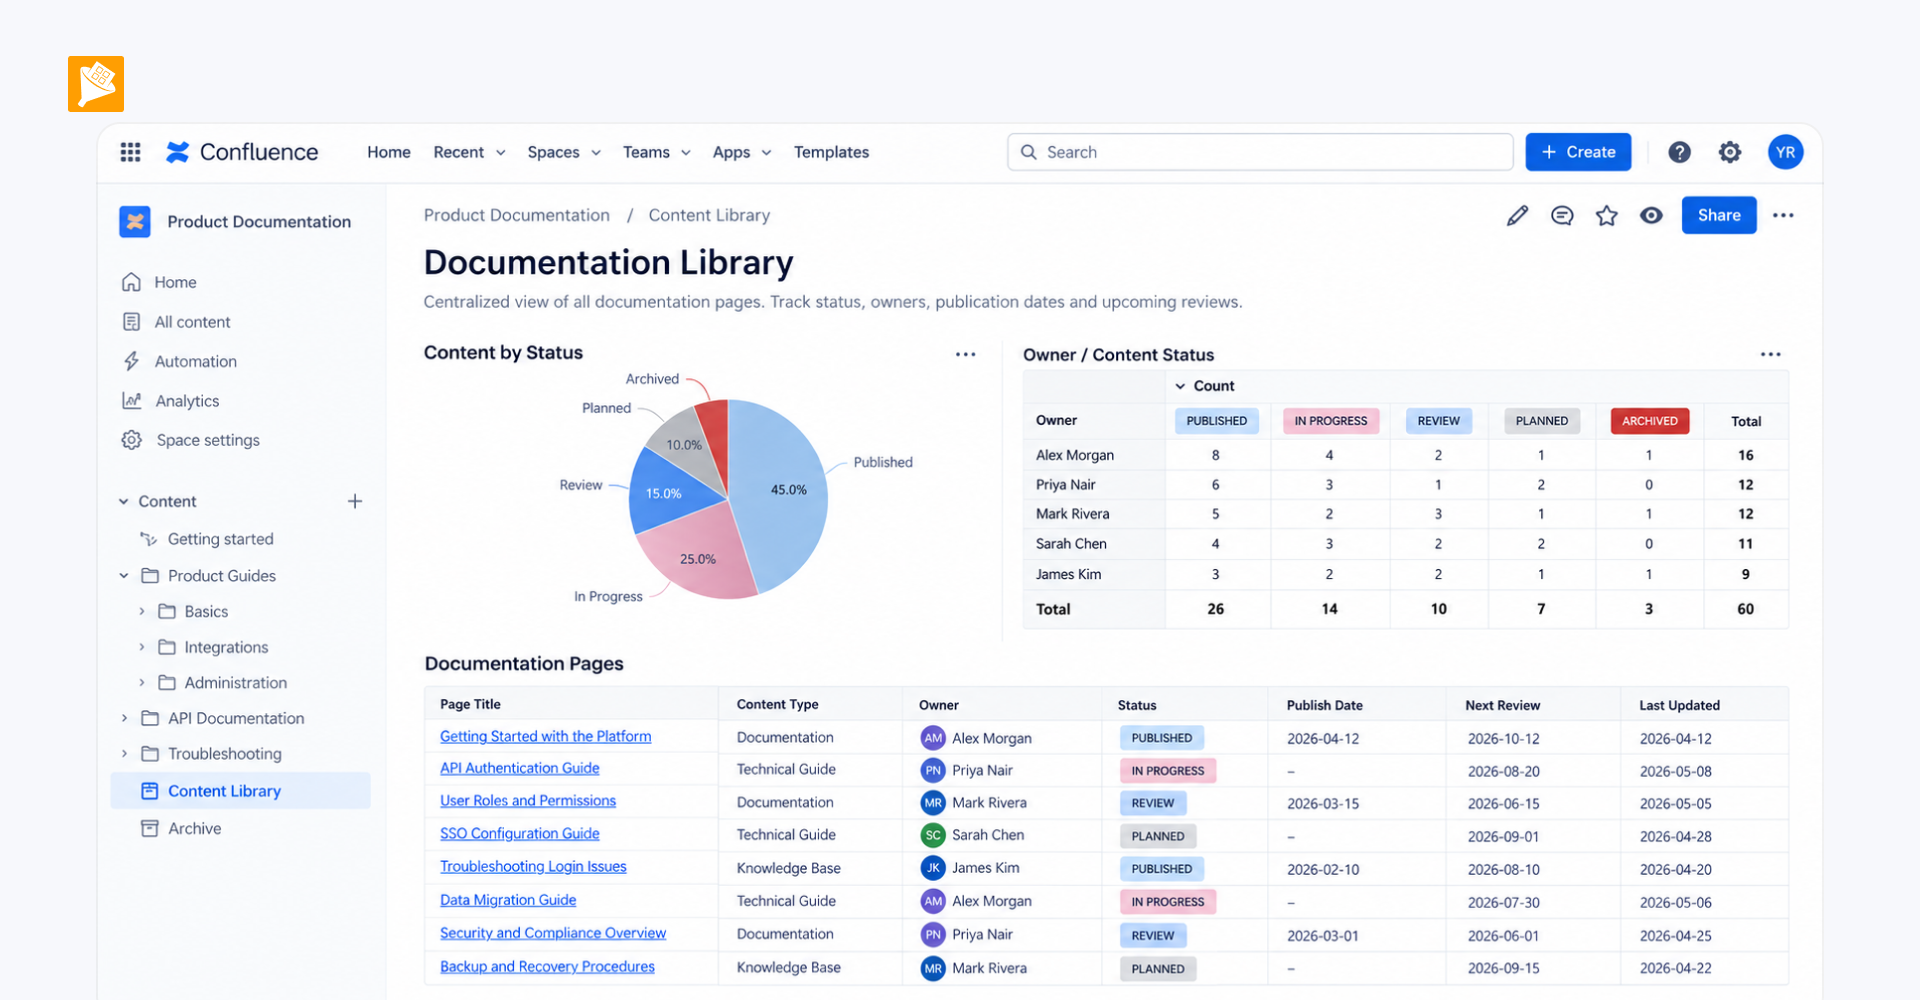
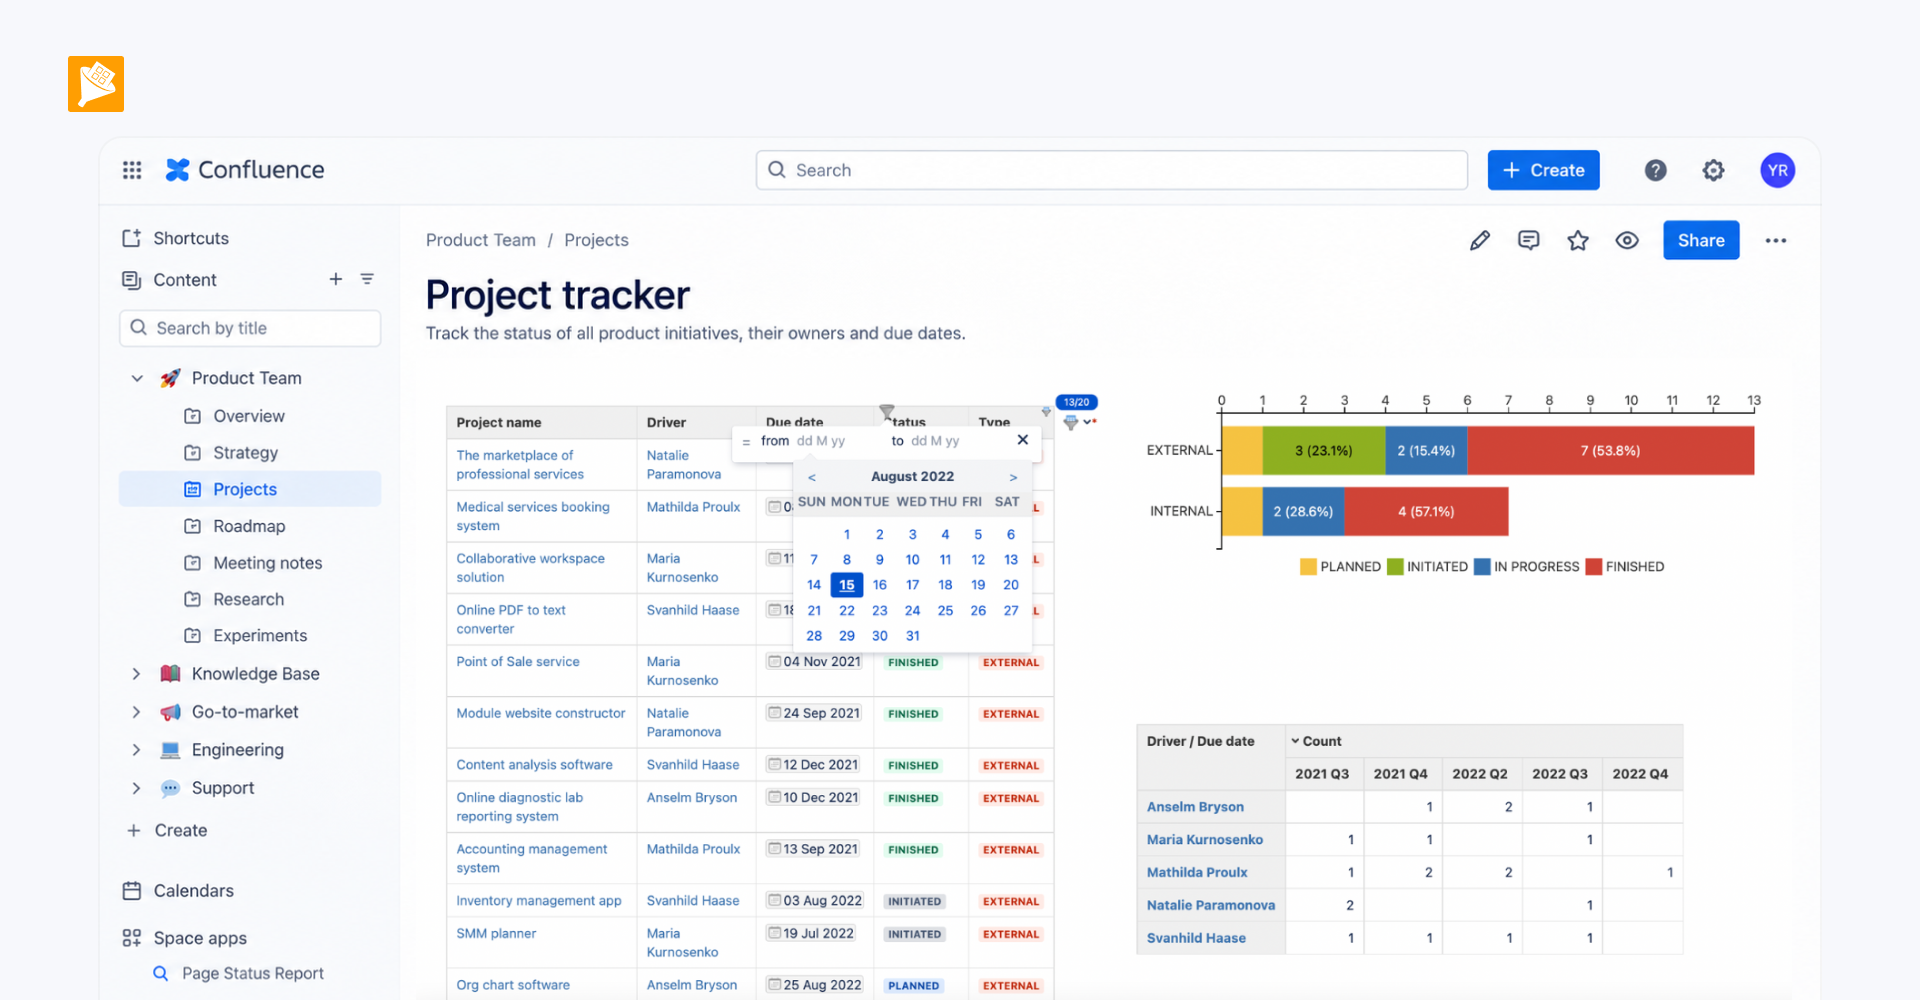
- Data from all project pages within a service is collected into one table using Page Properties Report / Content Properties Report or Table Excerpt Include. Teams work with this consolidated table ad hoc. Because it is built from the underlying project pages, it stays up to date as the source information changes.
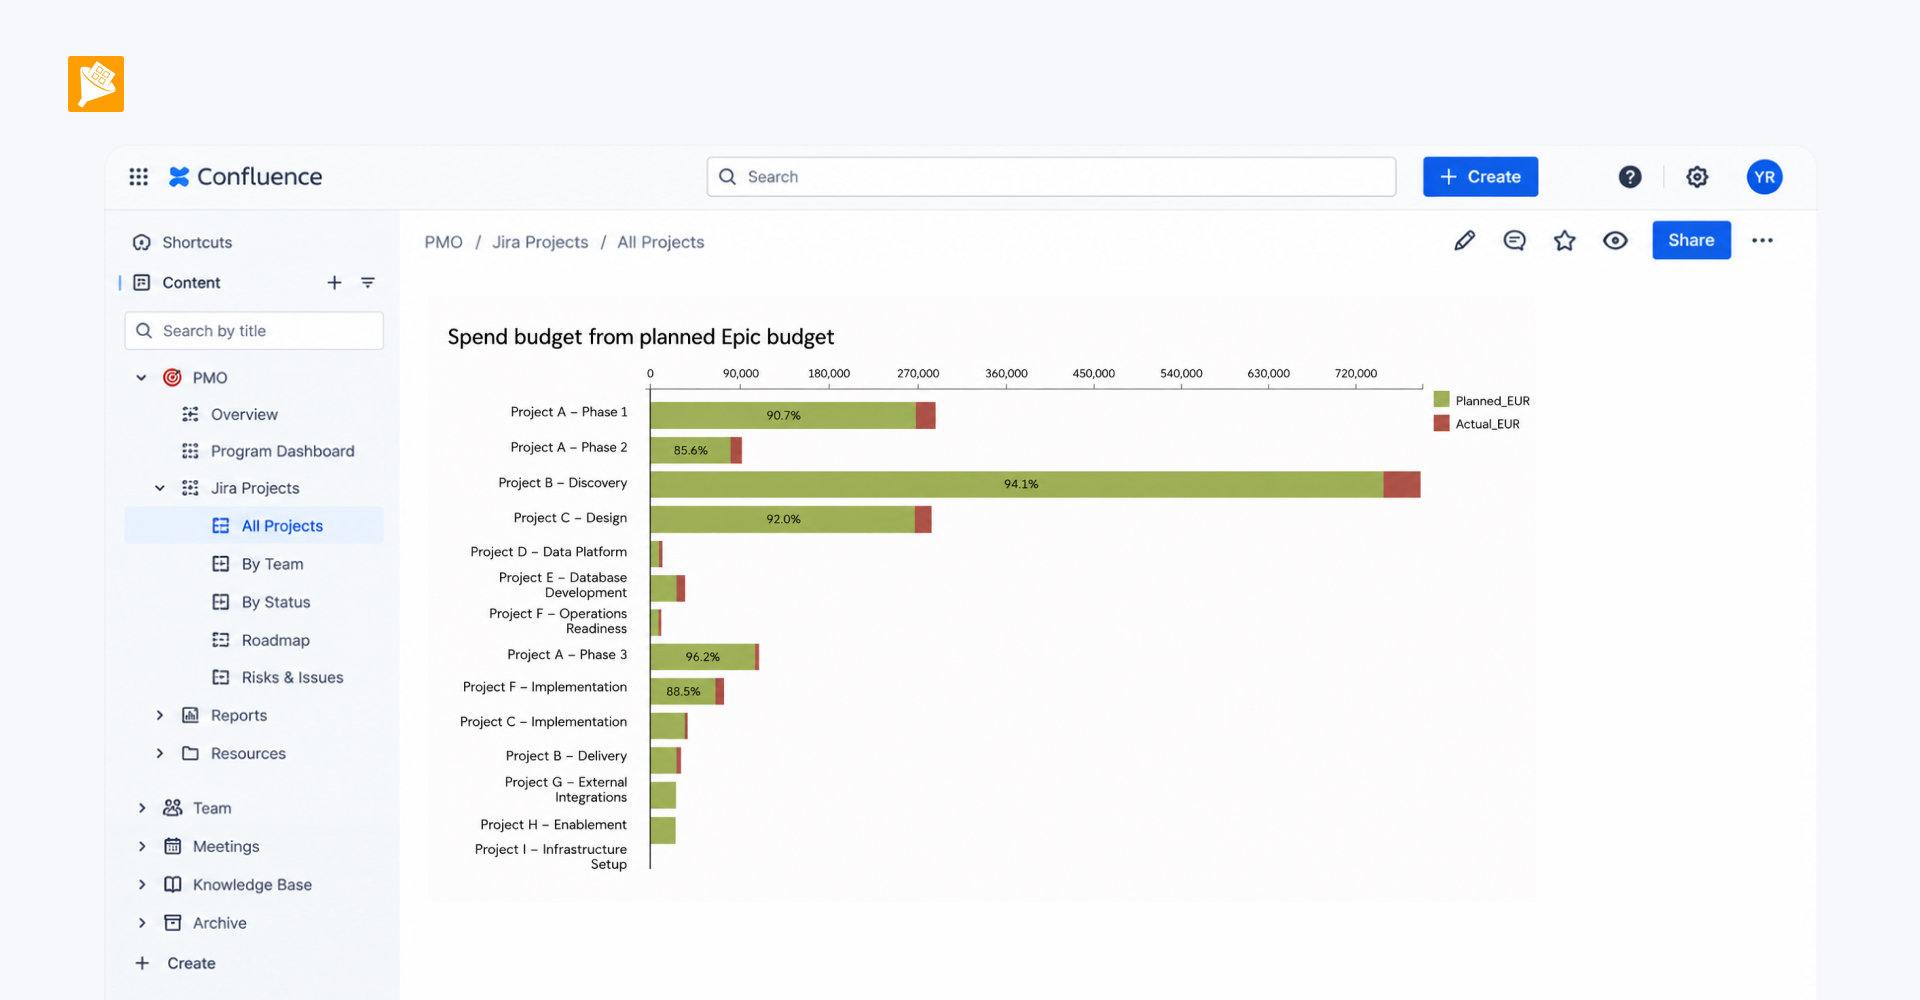
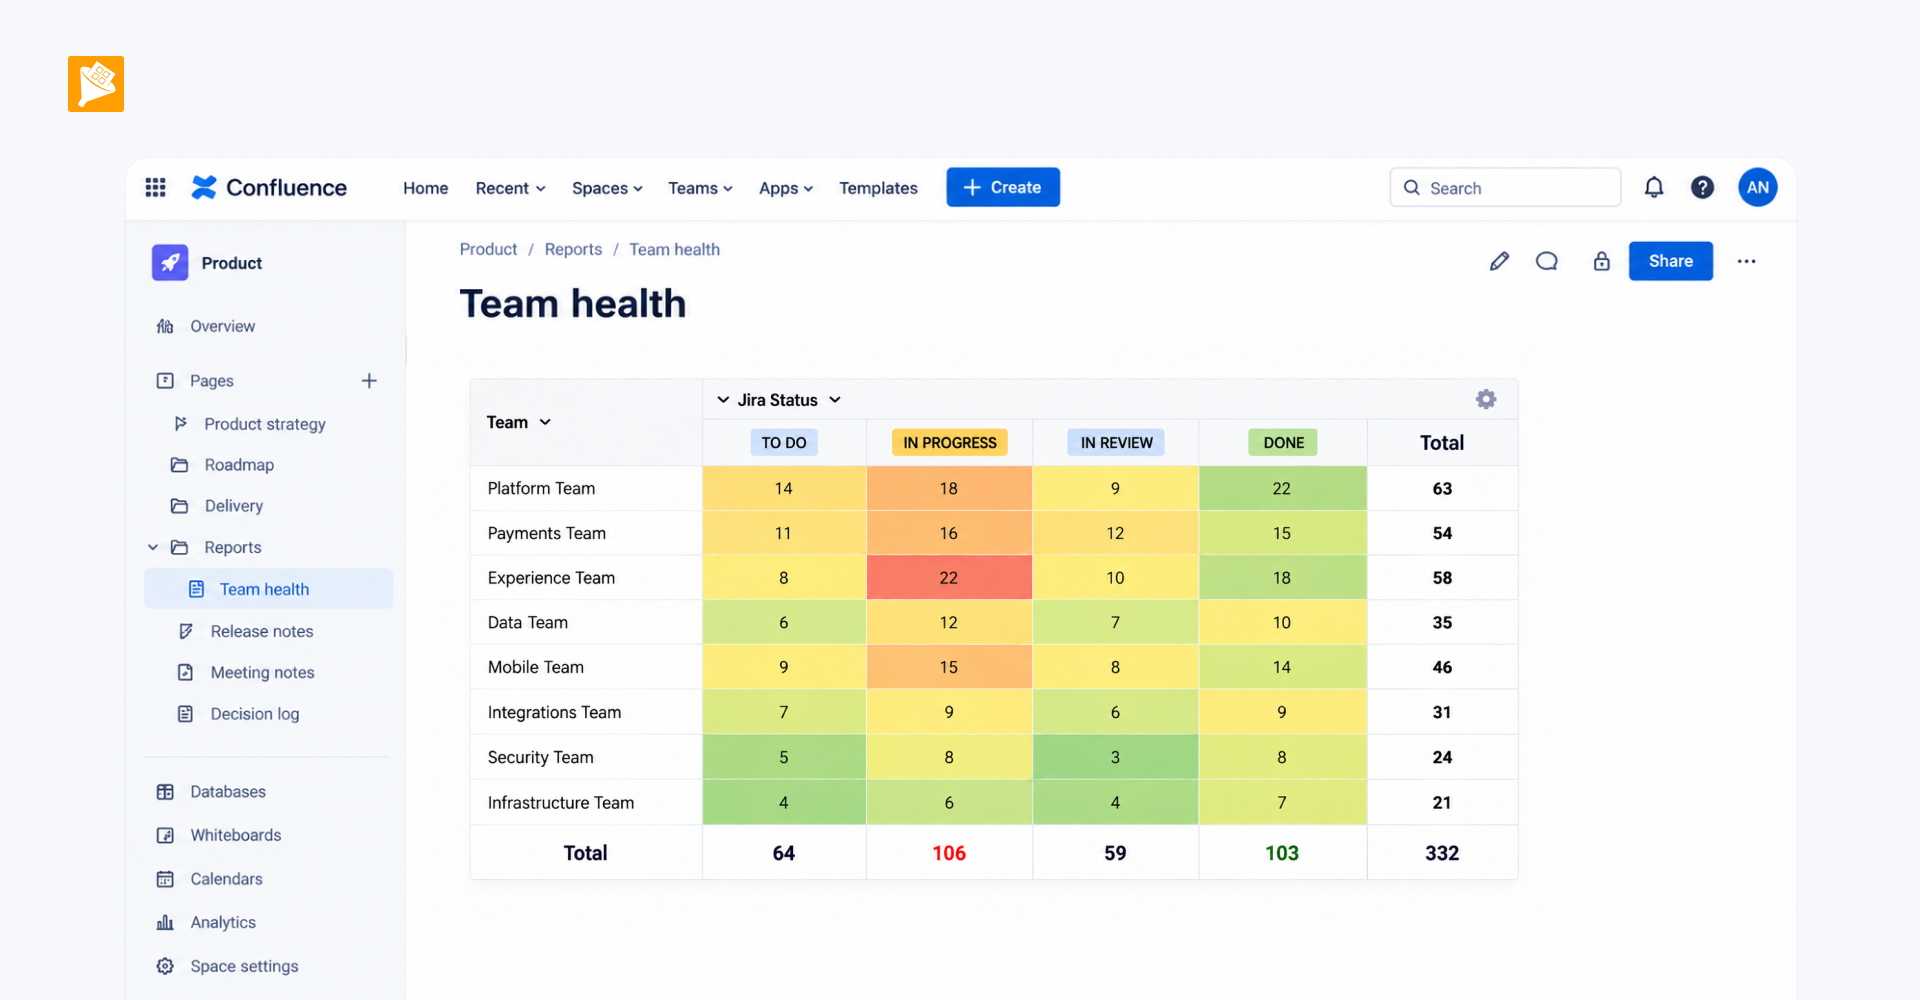
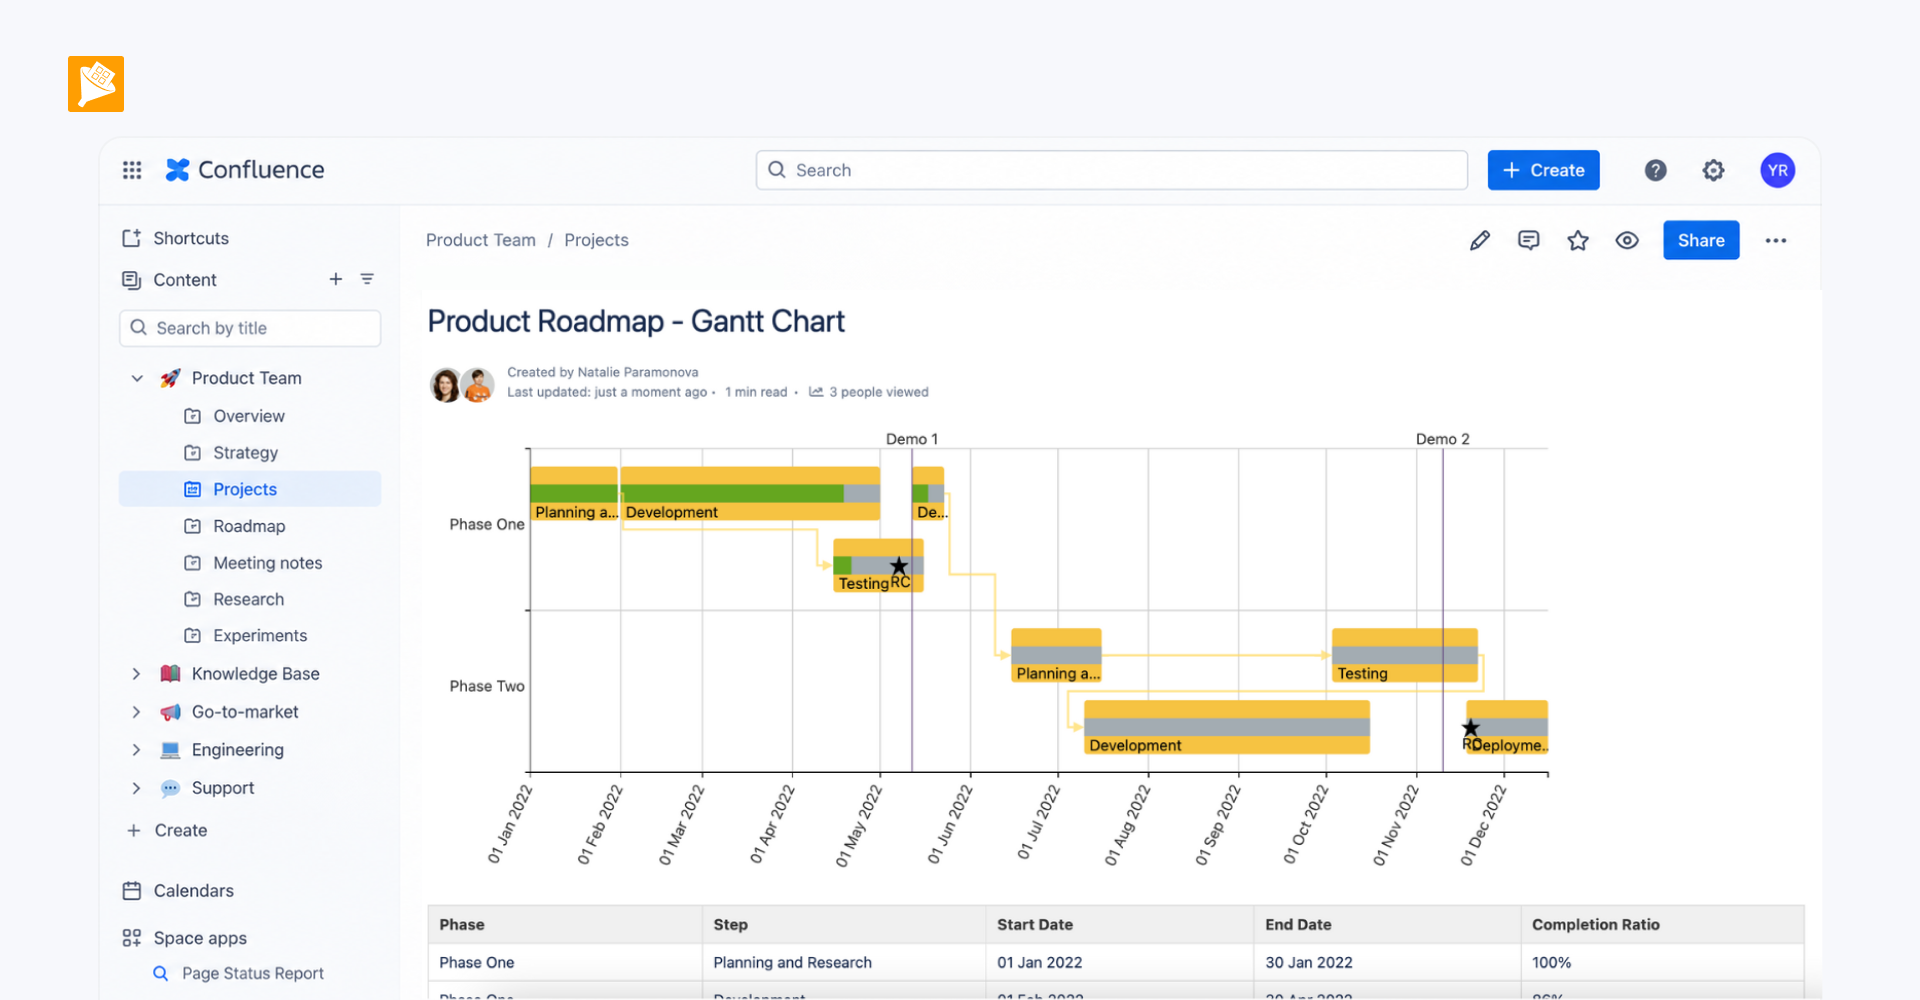
- Teams can filter the data, build summaries and aggregated views, create reports, or visualize it with charts using Table Filter, Pivot Table, Table Transformer, and Chart from Table.
- The same approach is repeated at the next levels: information about projects is collected for a service, services for a sub-team, and sub-teams for a team.