15K+
 4.9/5
 3M
Build a data-backed dashboard for 1-on-1 meetings
Context and Challenge
A manager wanted a consistent way to prepare for individual 1-on-1 meetings.
Relevant information about each employee’s work came from different sources. Time-tracking data was maintained in an external system, while project and task information lived in Jira.
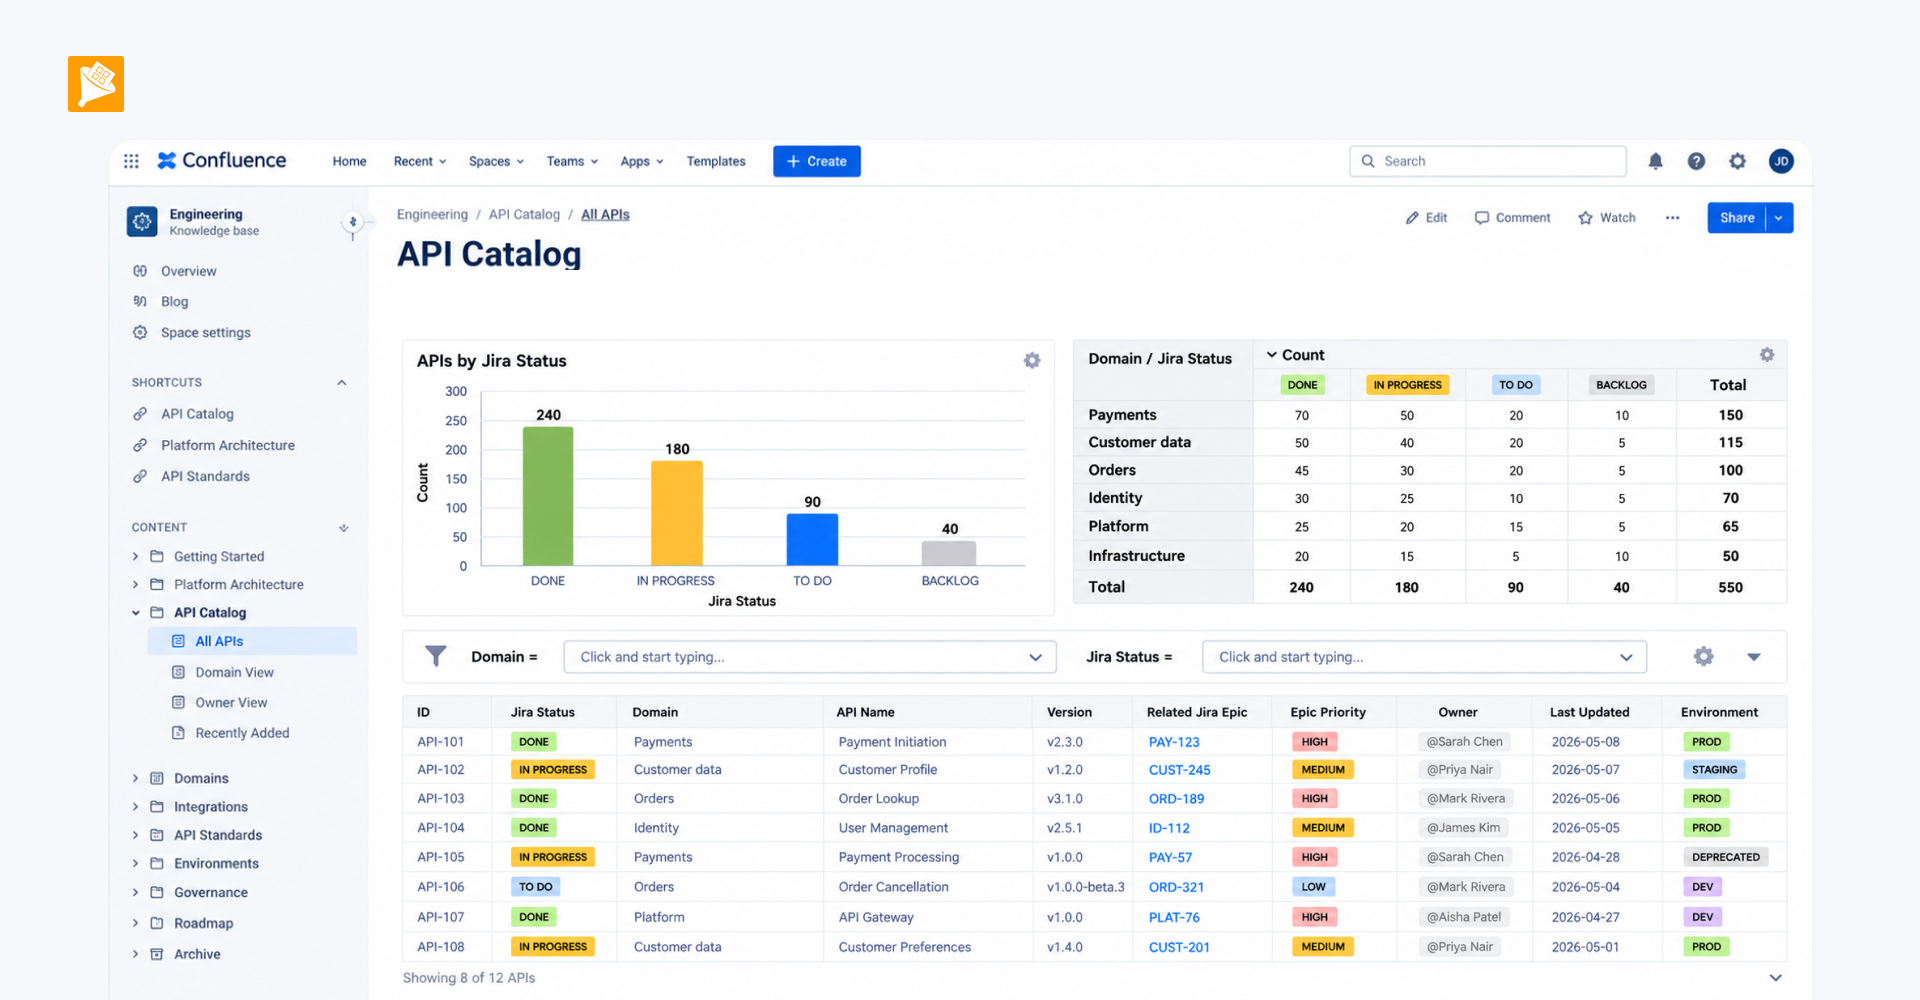
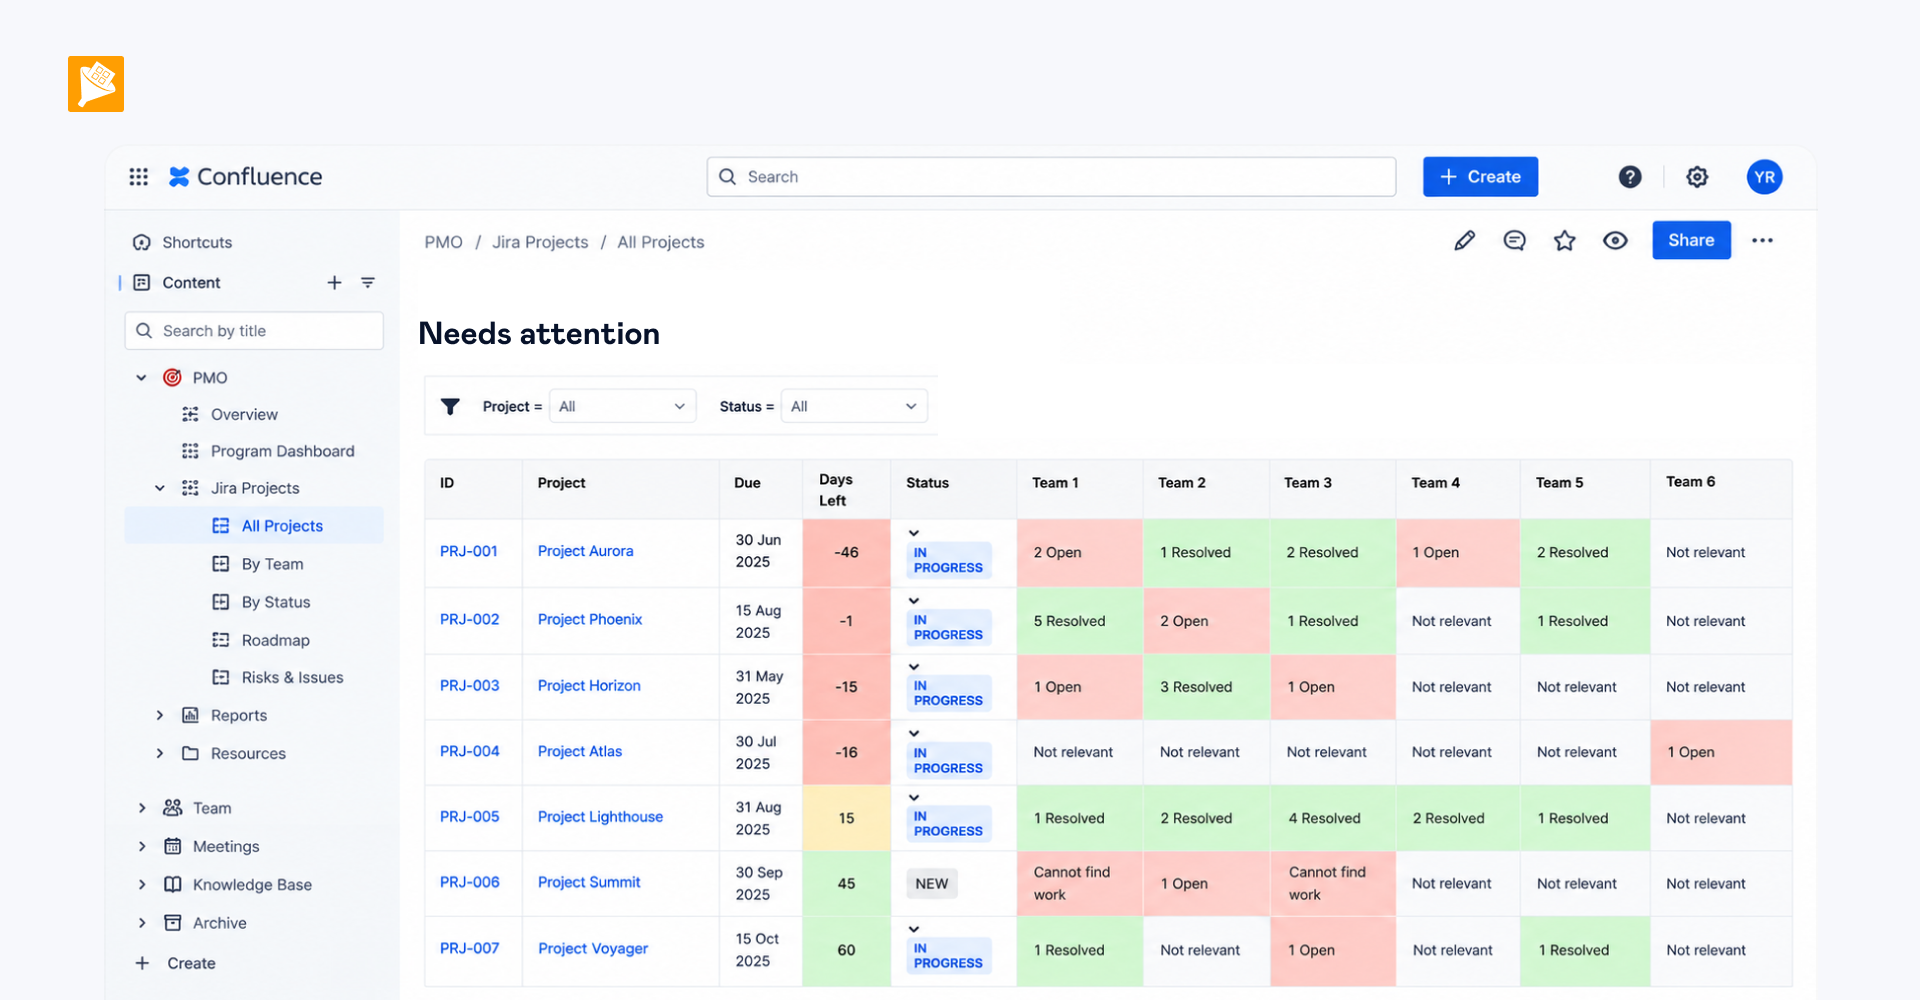
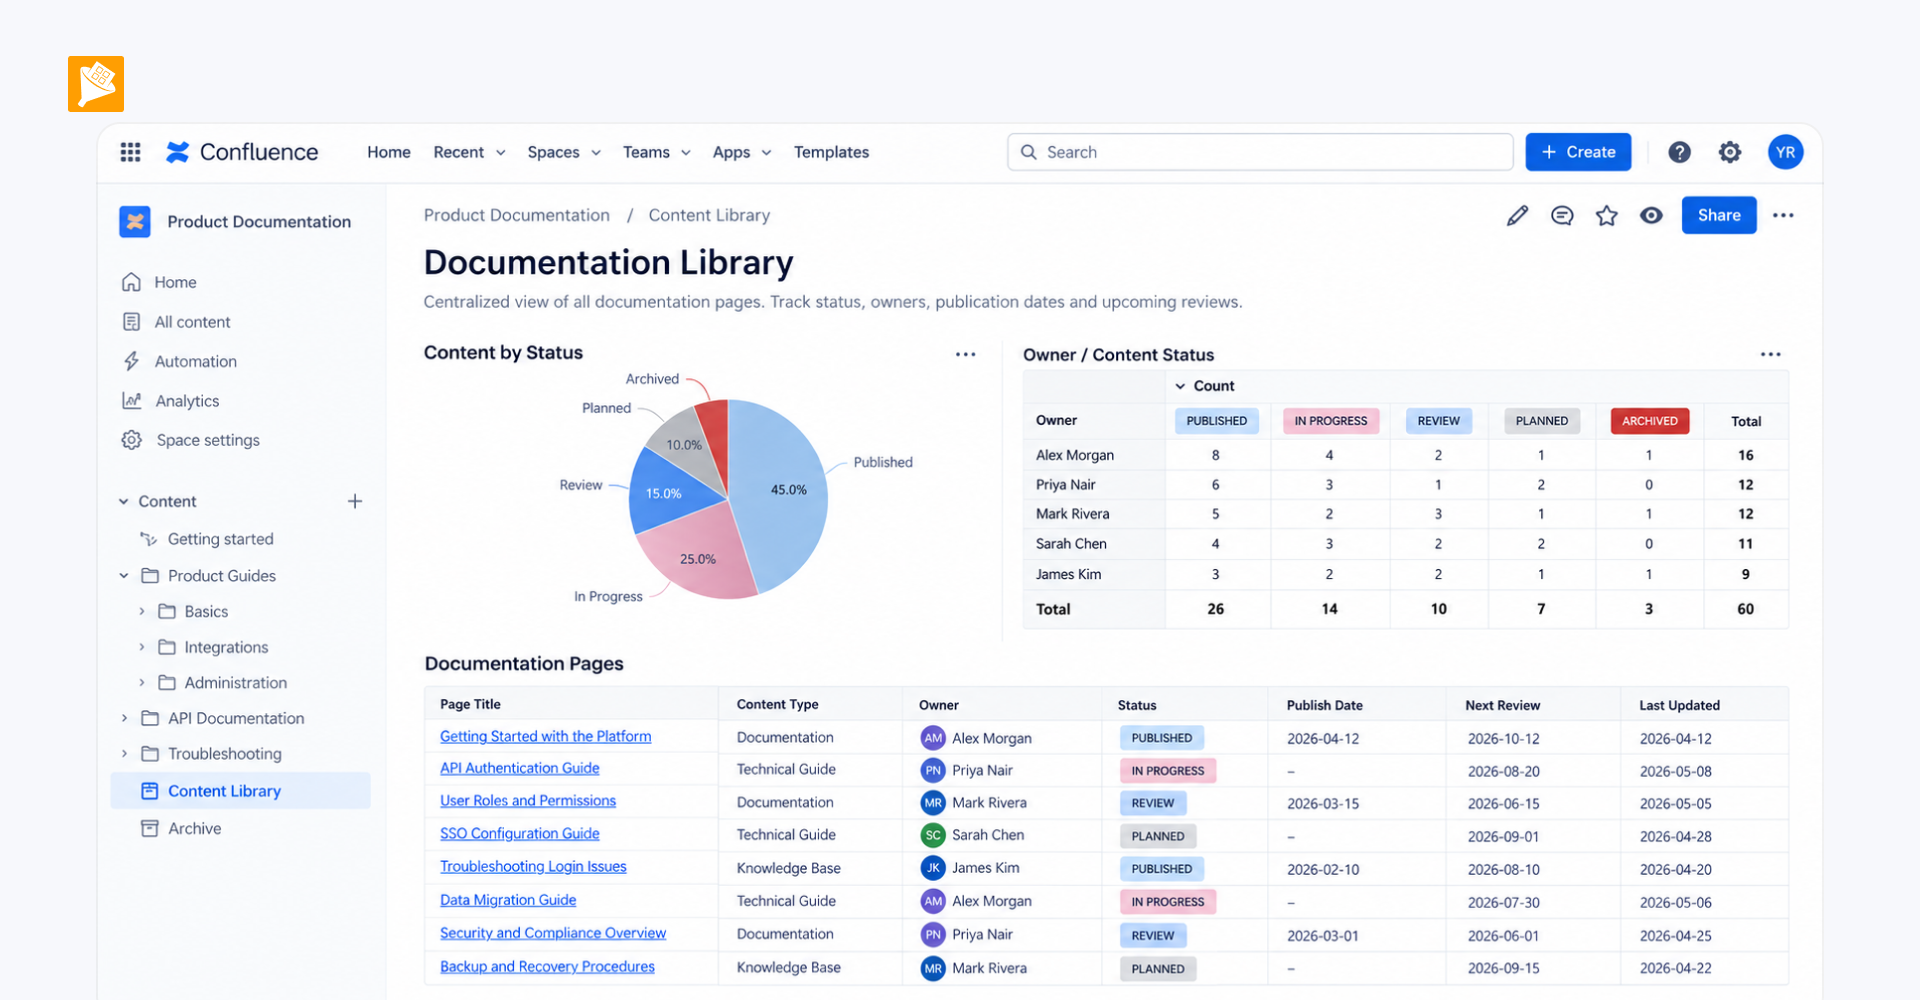
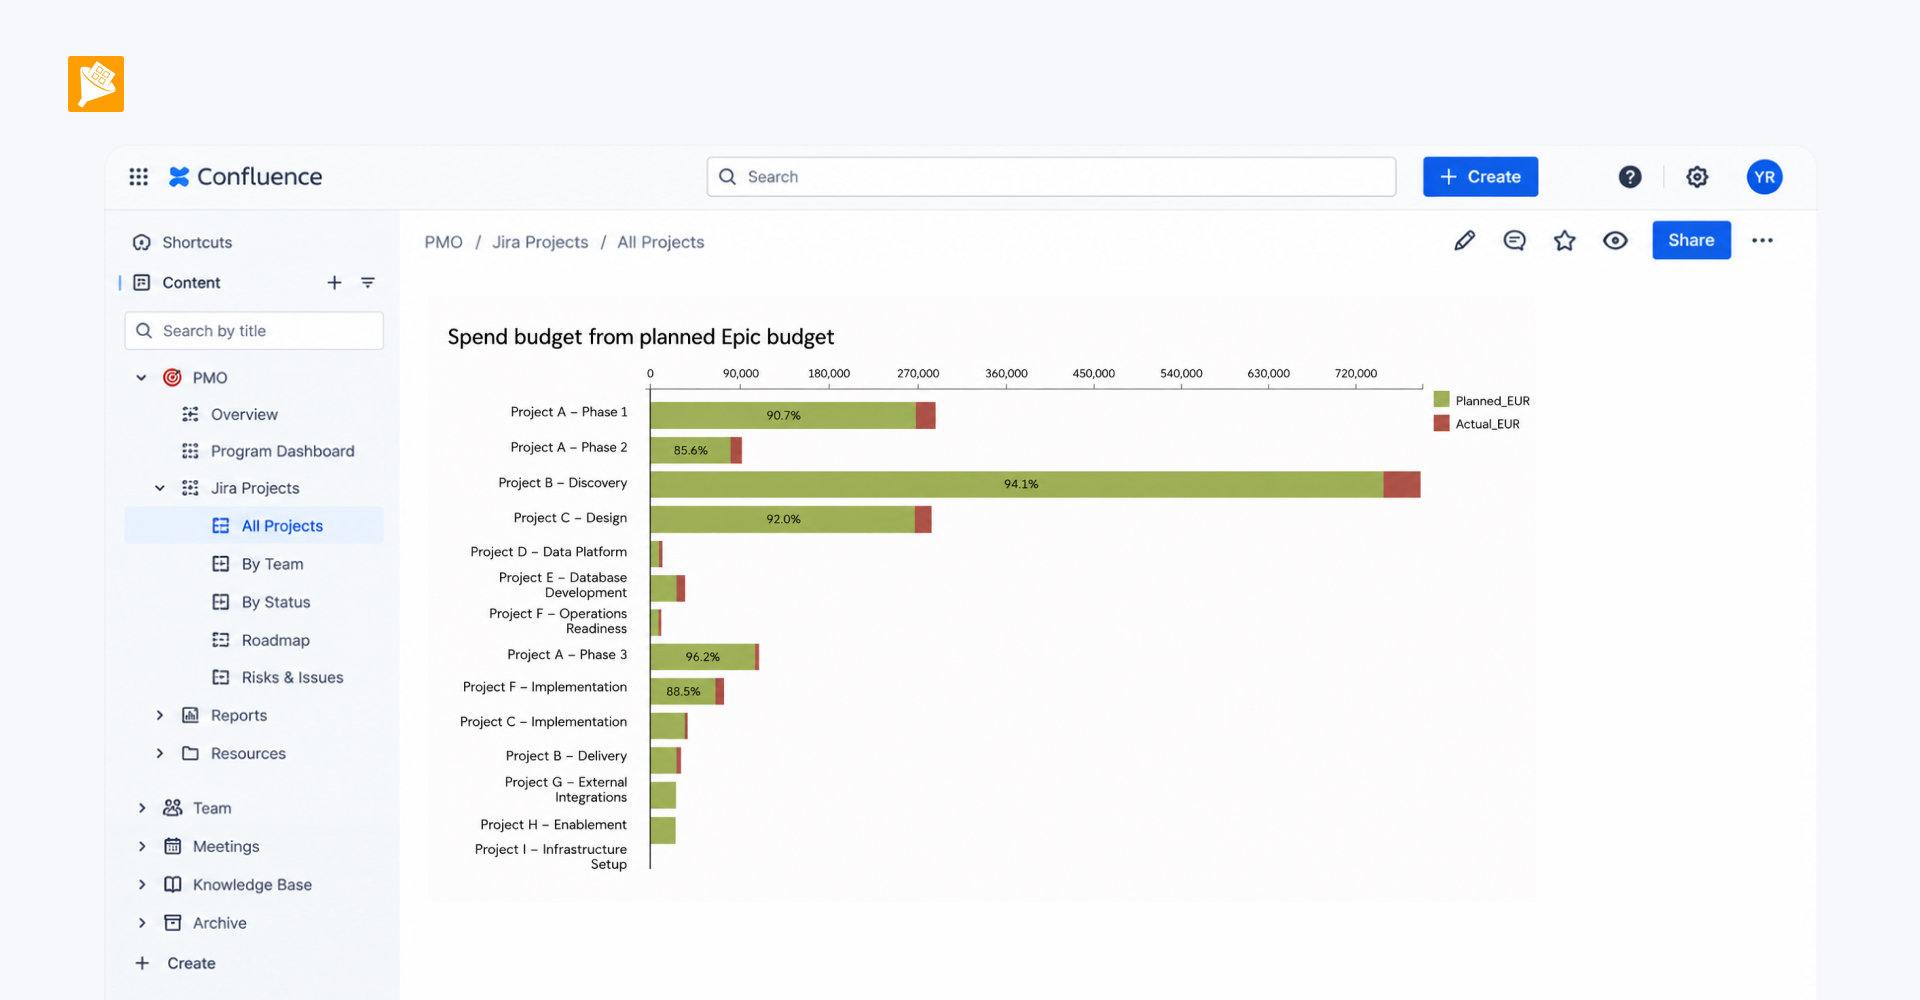
Instead of relying on a verbal recap during the meeting, the manager wanted to bring both data sources into a single Confluence dashboard and use the underlying data as a factual basis for the conversation.
Result
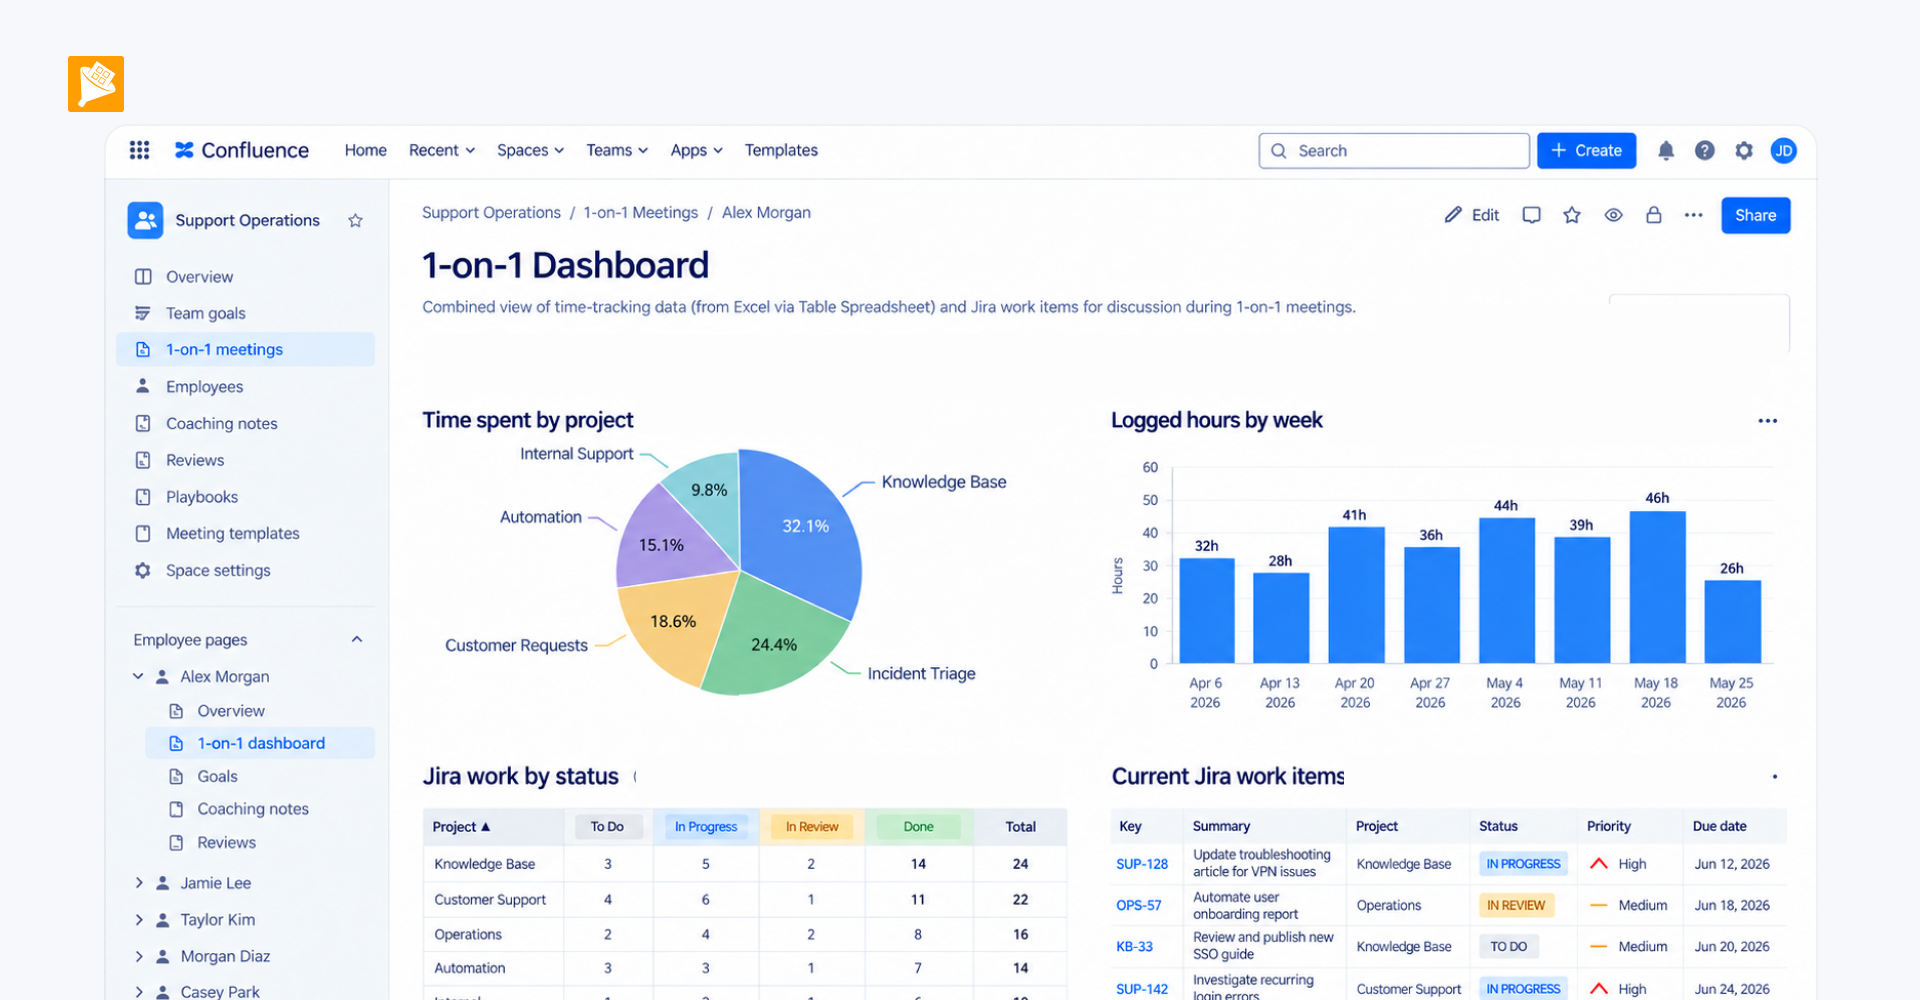
Each employee has a dedicated 1-on-1 page that brings together their time-tracking and Jira data.
The manager keeps the dashboard on screen during the meeting, so when a project or current work comes up, both people can refer to the same underlying information instead of relying only on recollection or switching between different systems.
How it is built
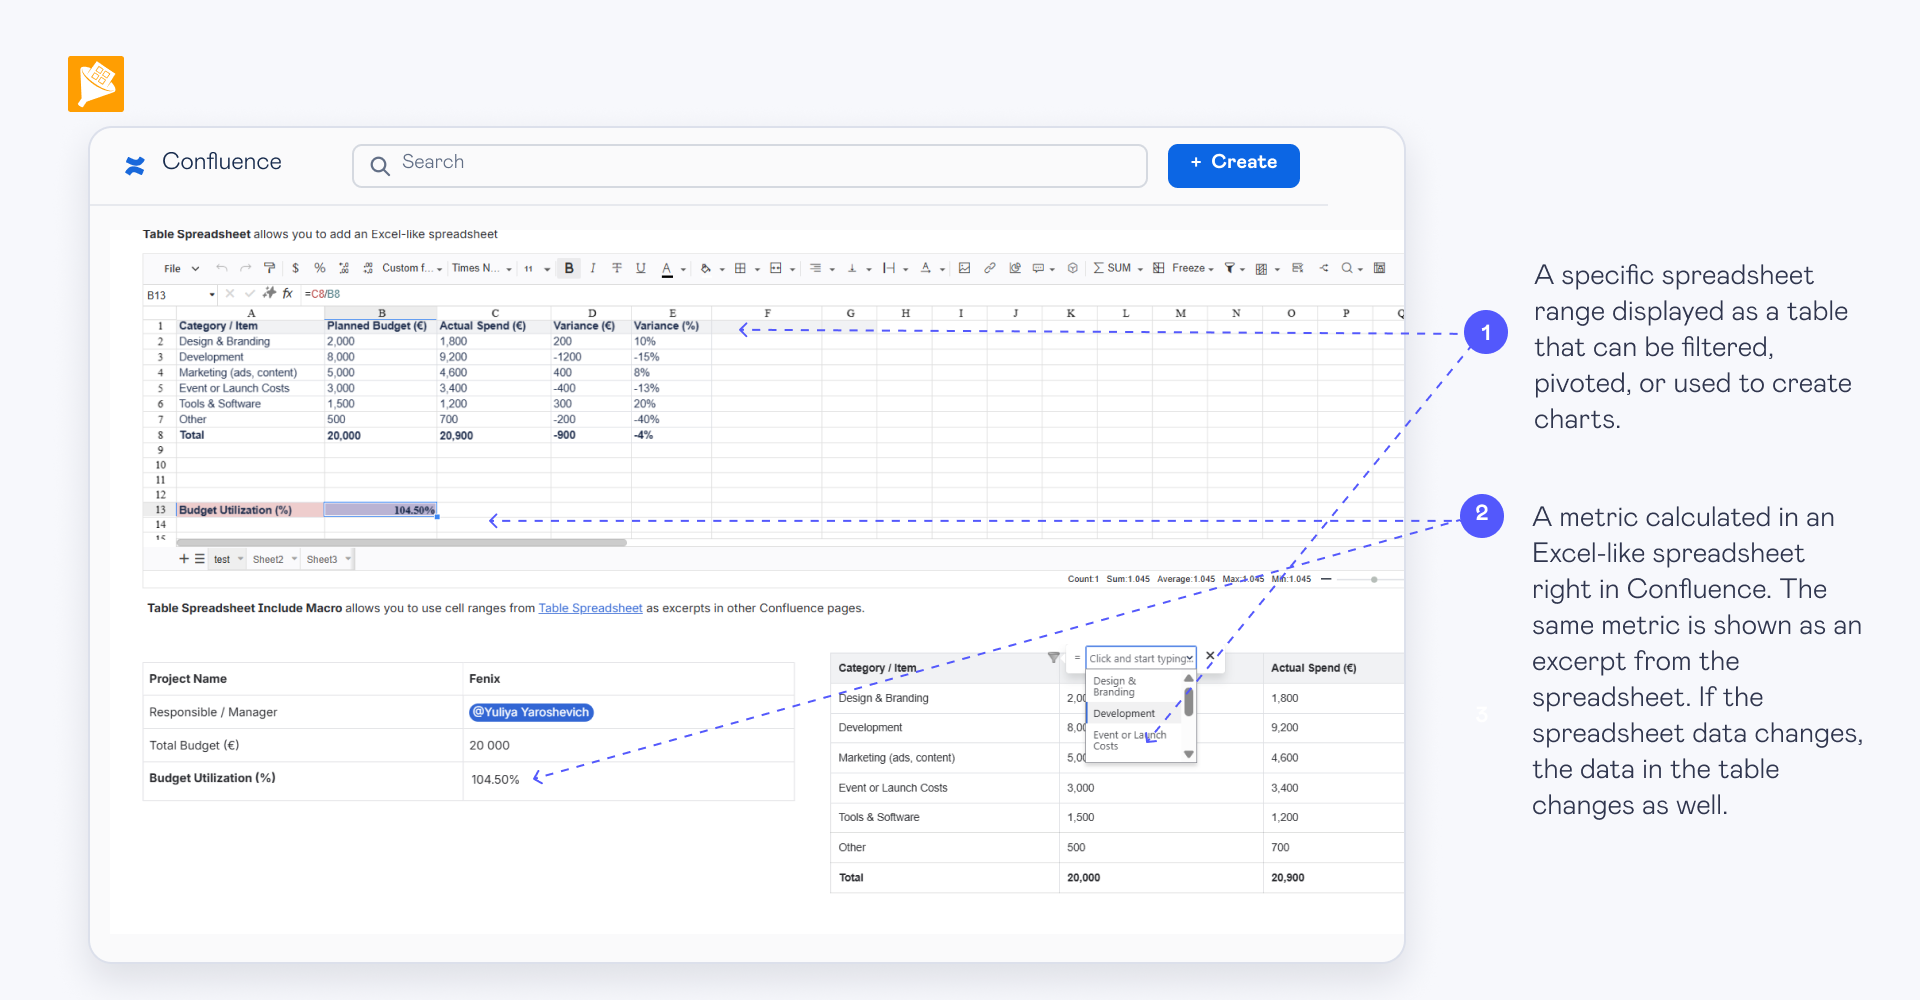
- Time-tracking data is exported from the external system as an Excel file and imported into Table Spreadsheet in Confluence.
- Table Spreadsheet Include reuses the relevant spreadsheet data on the employee’s 1-on-1 page without copying it into a separate table.
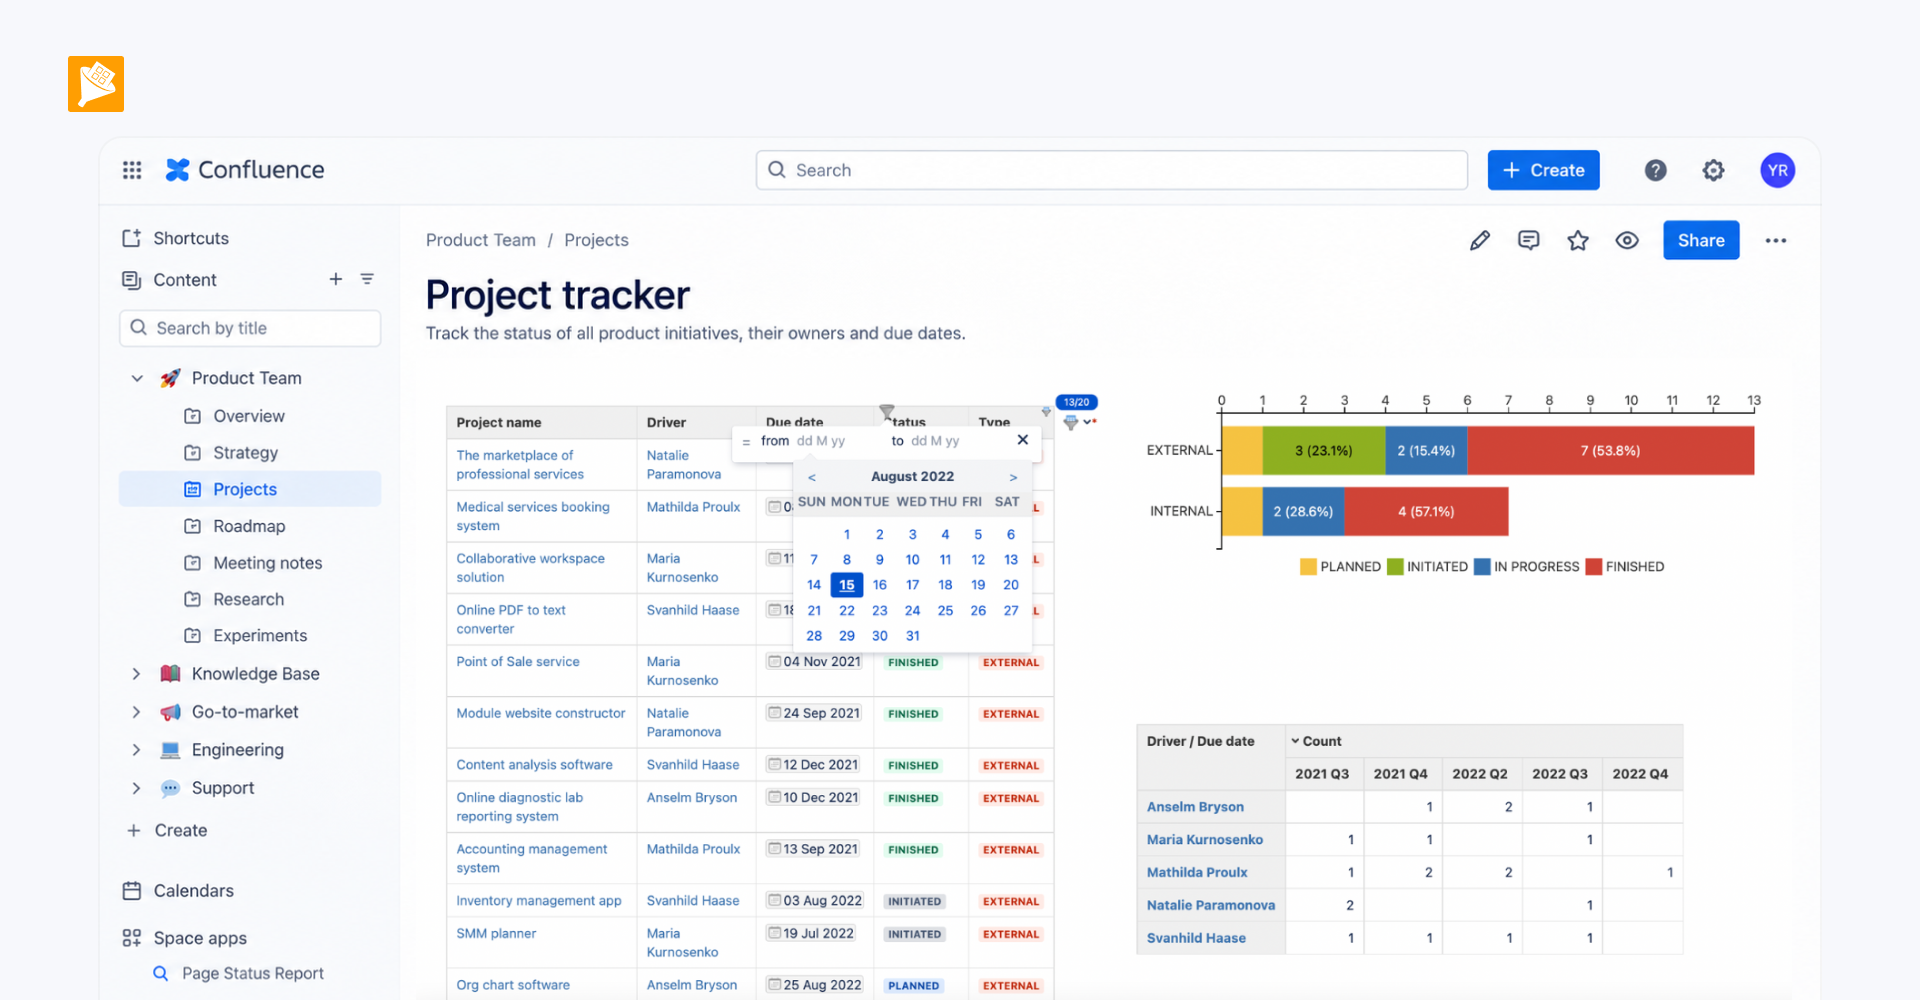
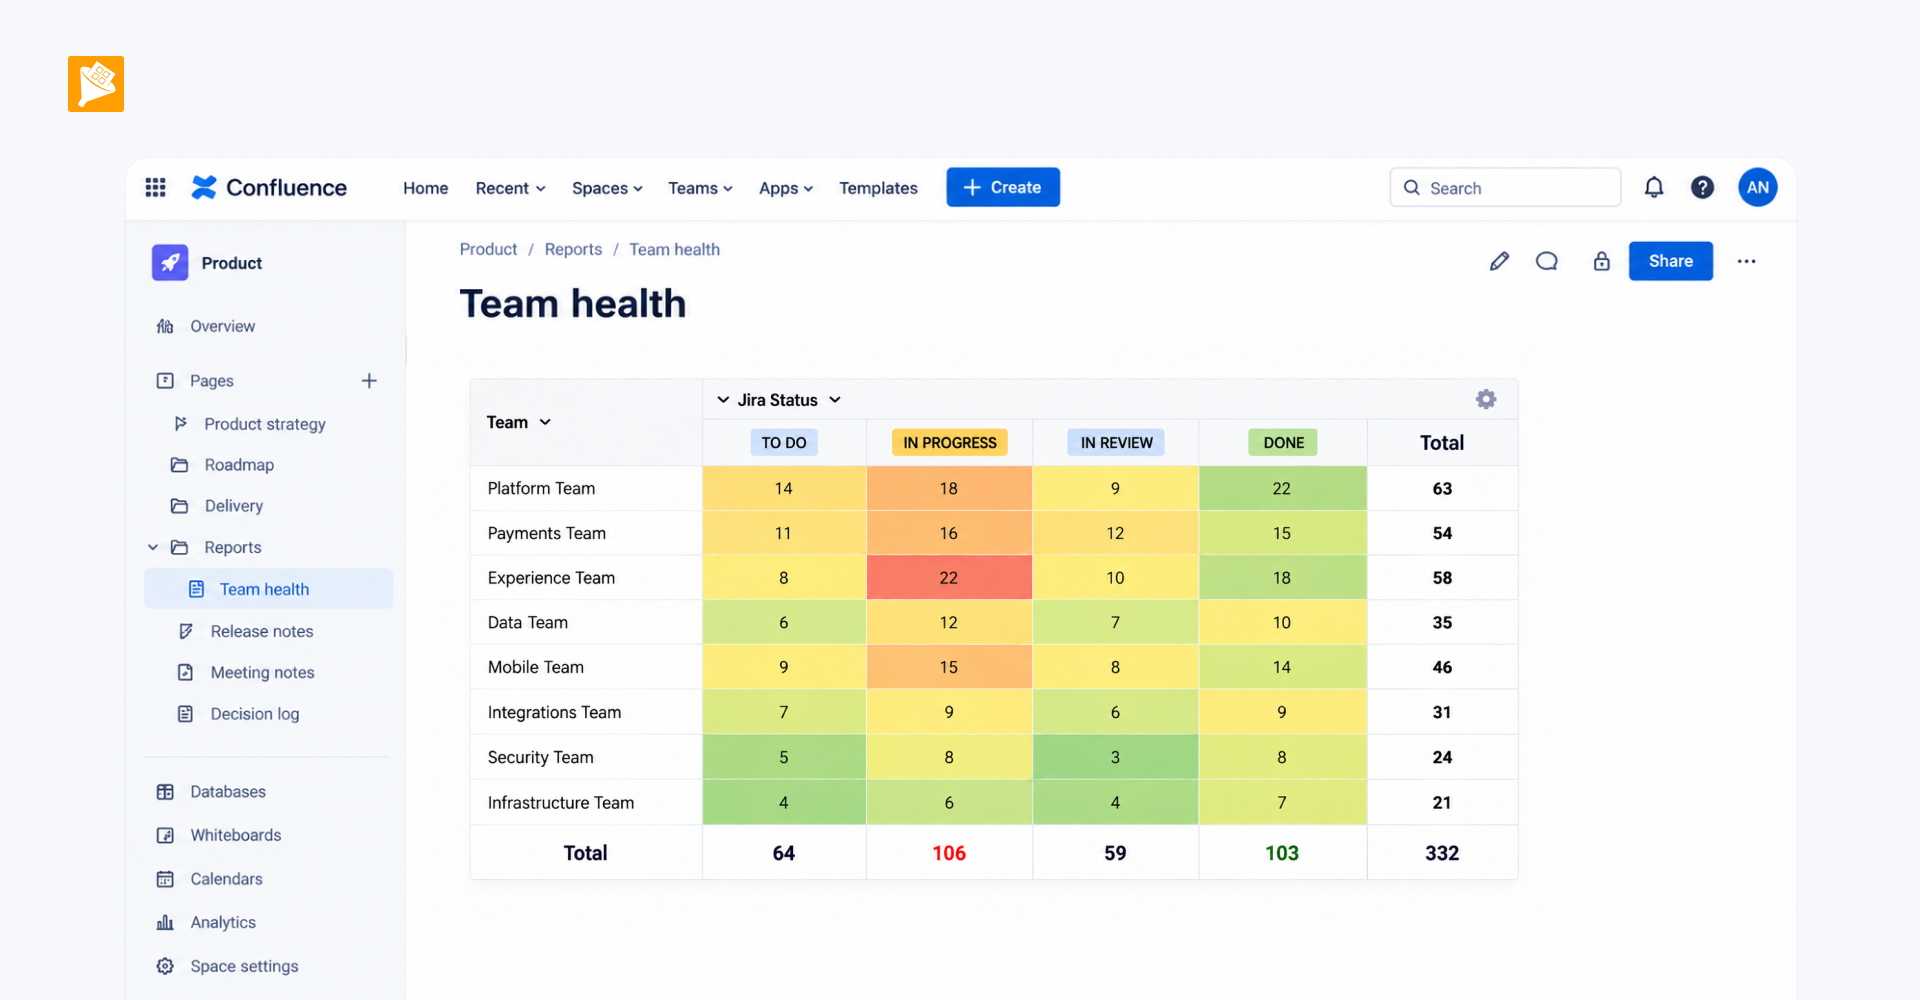
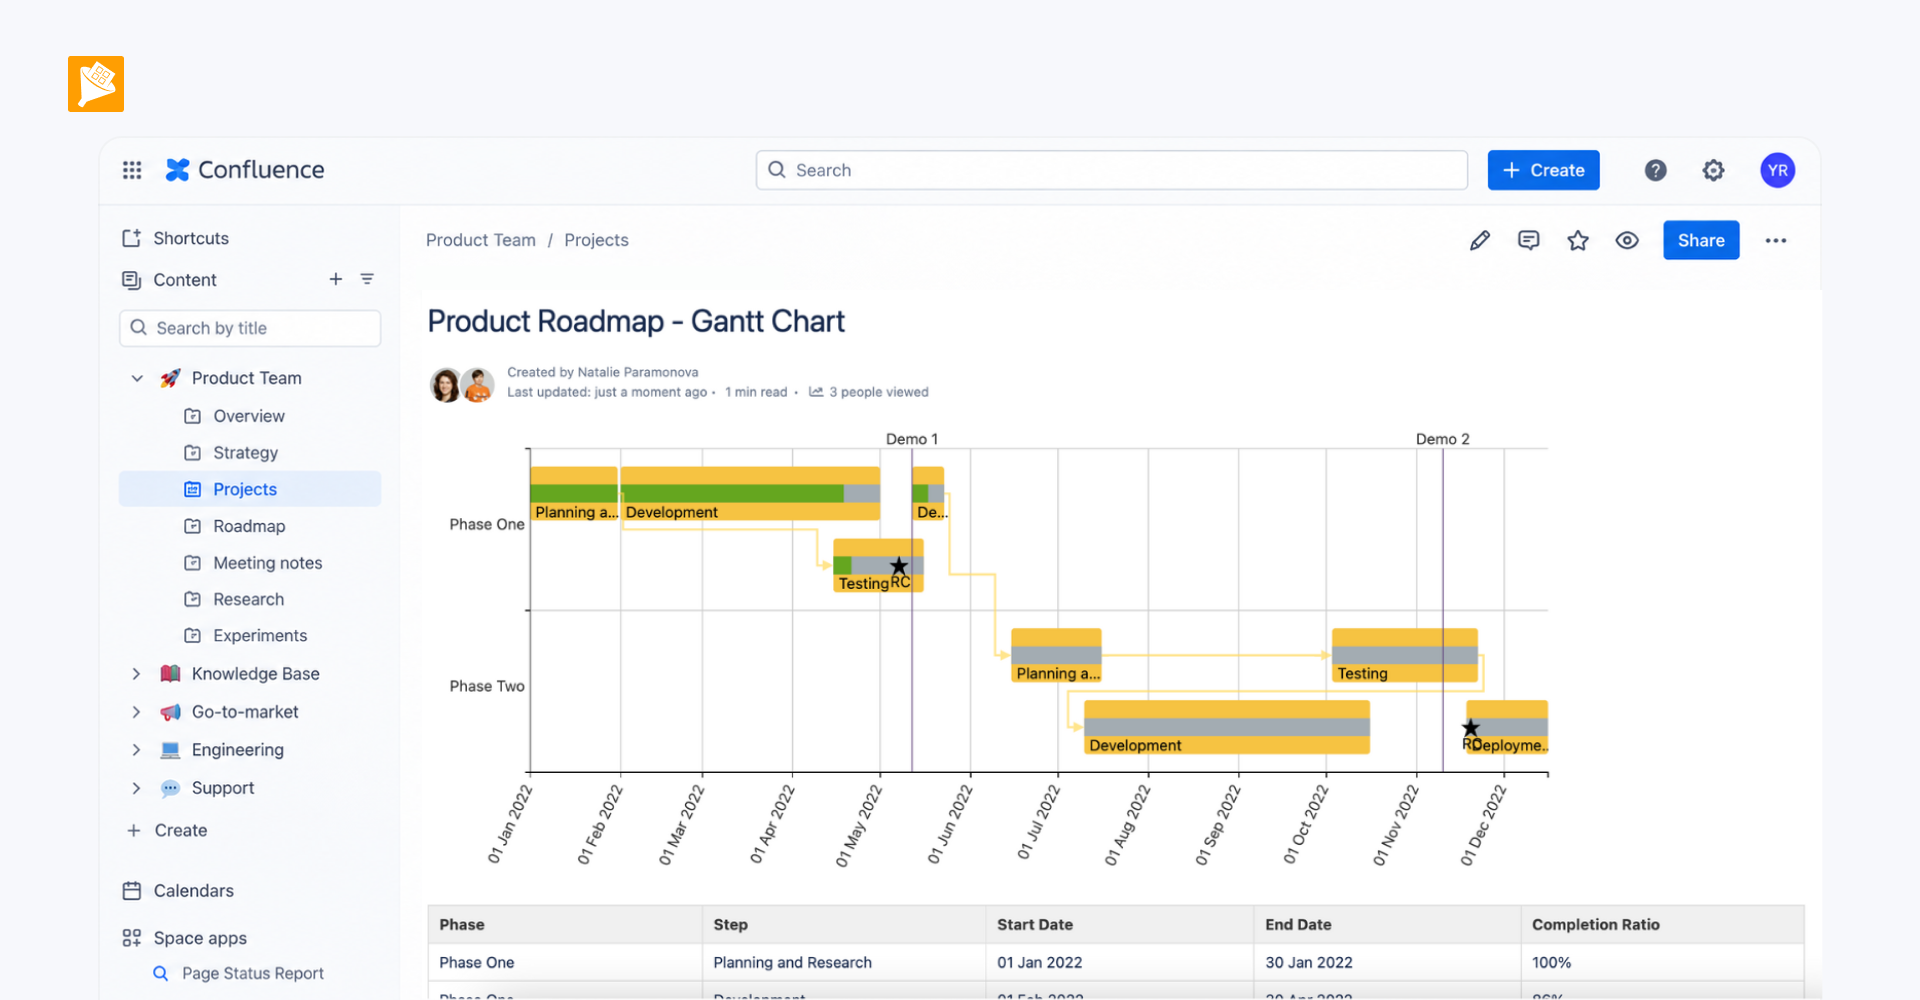
- Jira Work Items brings the relevant Jira data onto the same page. Table Filter, Pivot Table, and Chart from Table can be used to turn the combined data into a custom view for the meeting.