15K+
 4.9/5
 3M
Dashboards & ReportingCustom Jira Reporting
Turn a Jira ticket list into a team × status heat map
Context and Challenge
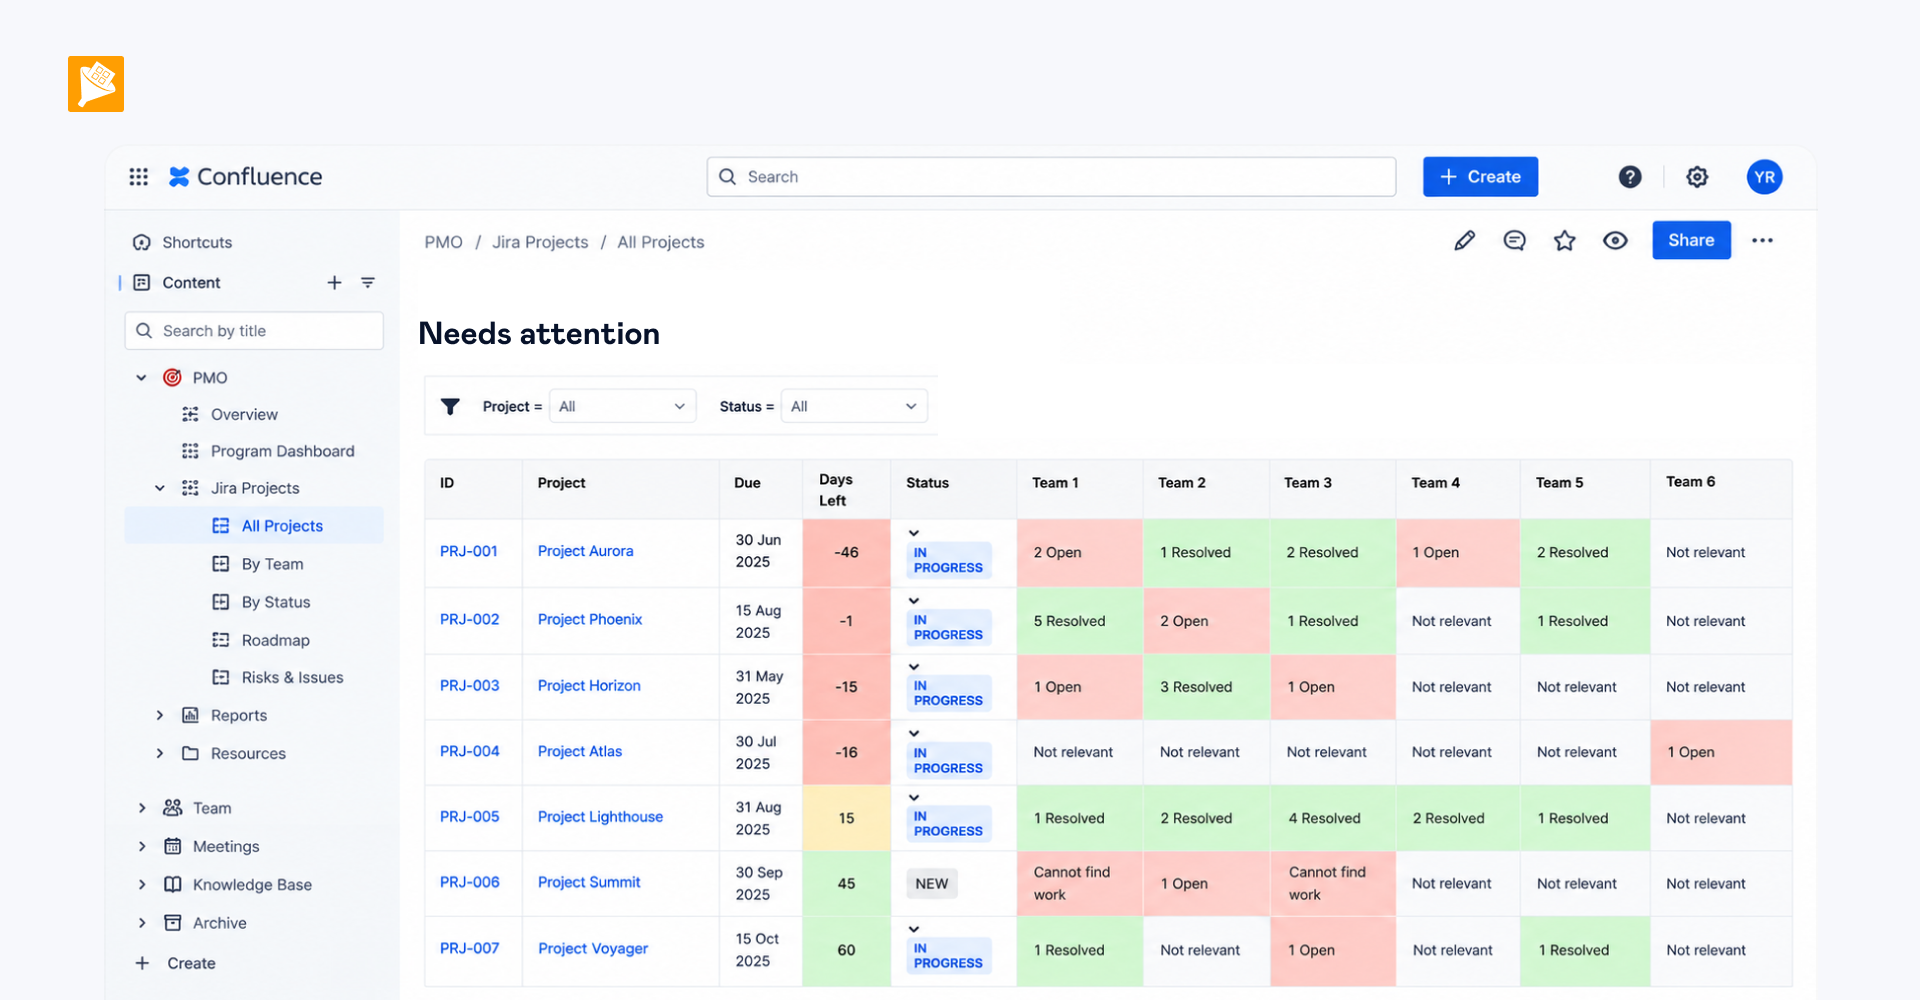
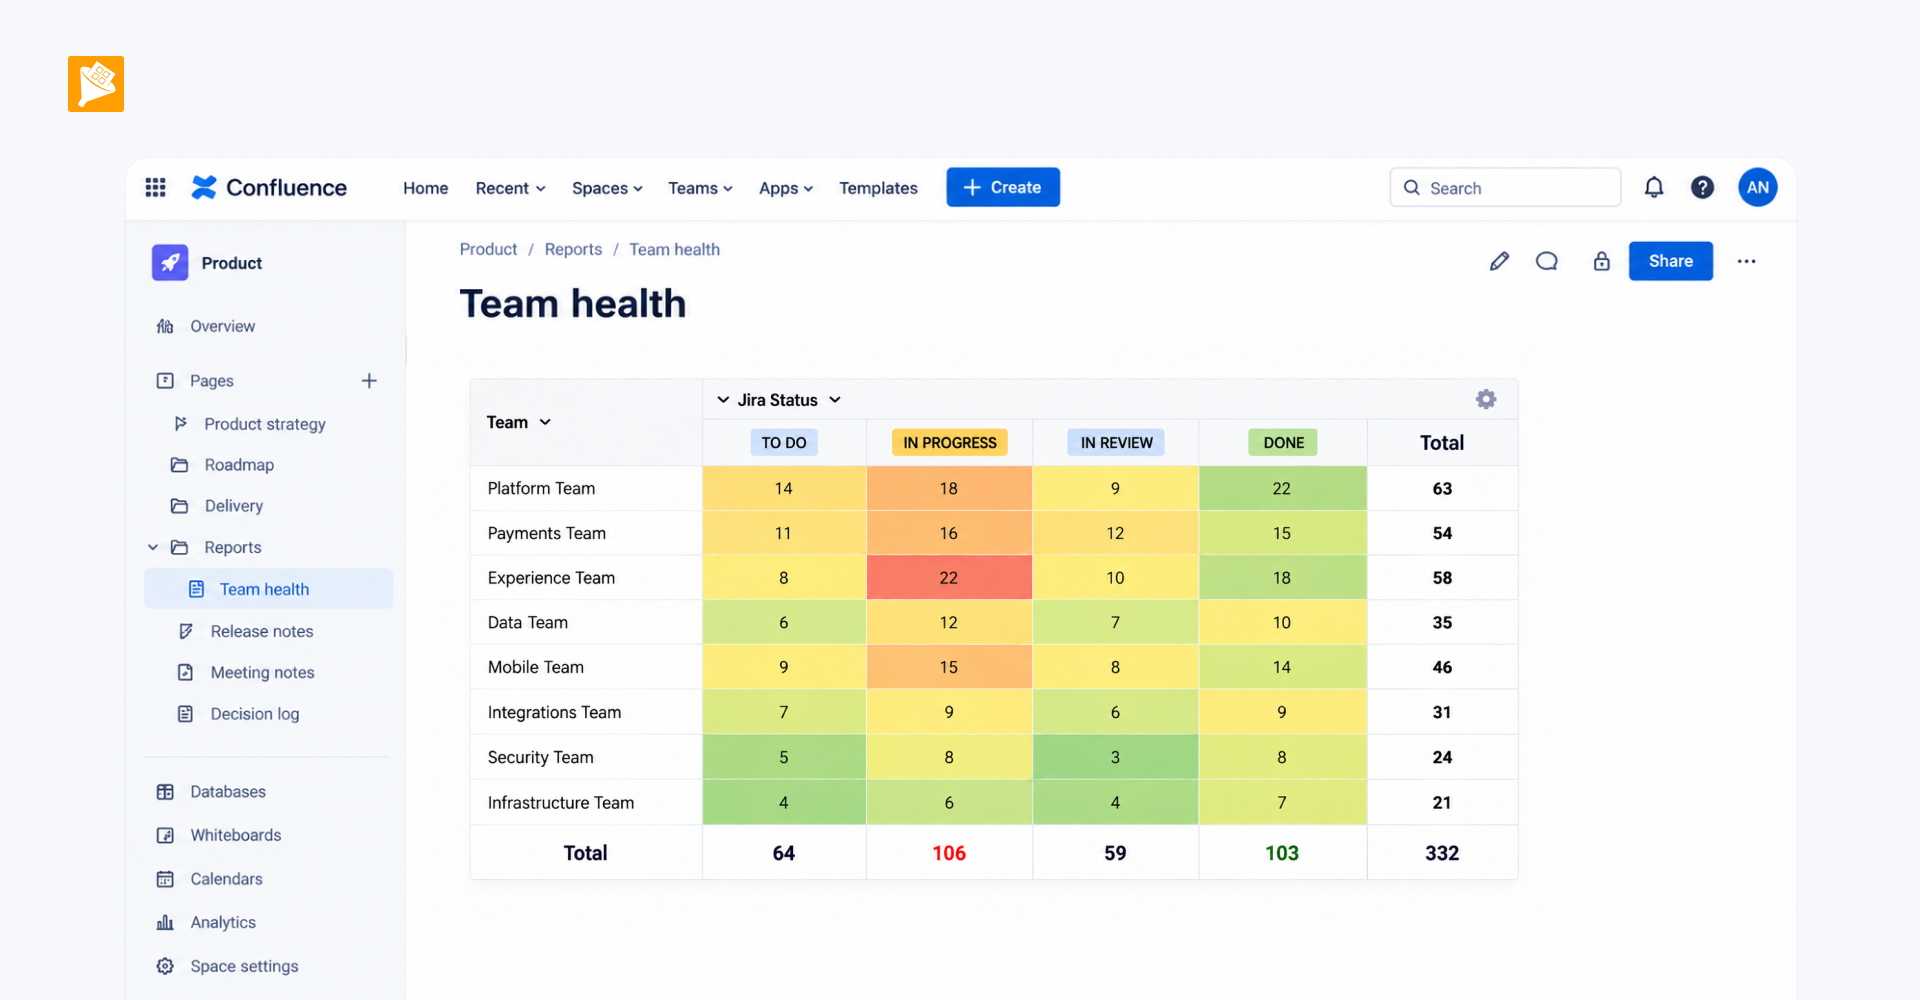
A technical leader needed to track tickets across different teams and statuses. The goal was to turn the ticket list into a two-dimensional team × status view so stakeholders could quickly see where work was getting stuck and which teams were handling most of the tickets.
To make these patterns visible at a glance, the summary also needed conditional cell formatting that would turn the table into a heat map.
Result
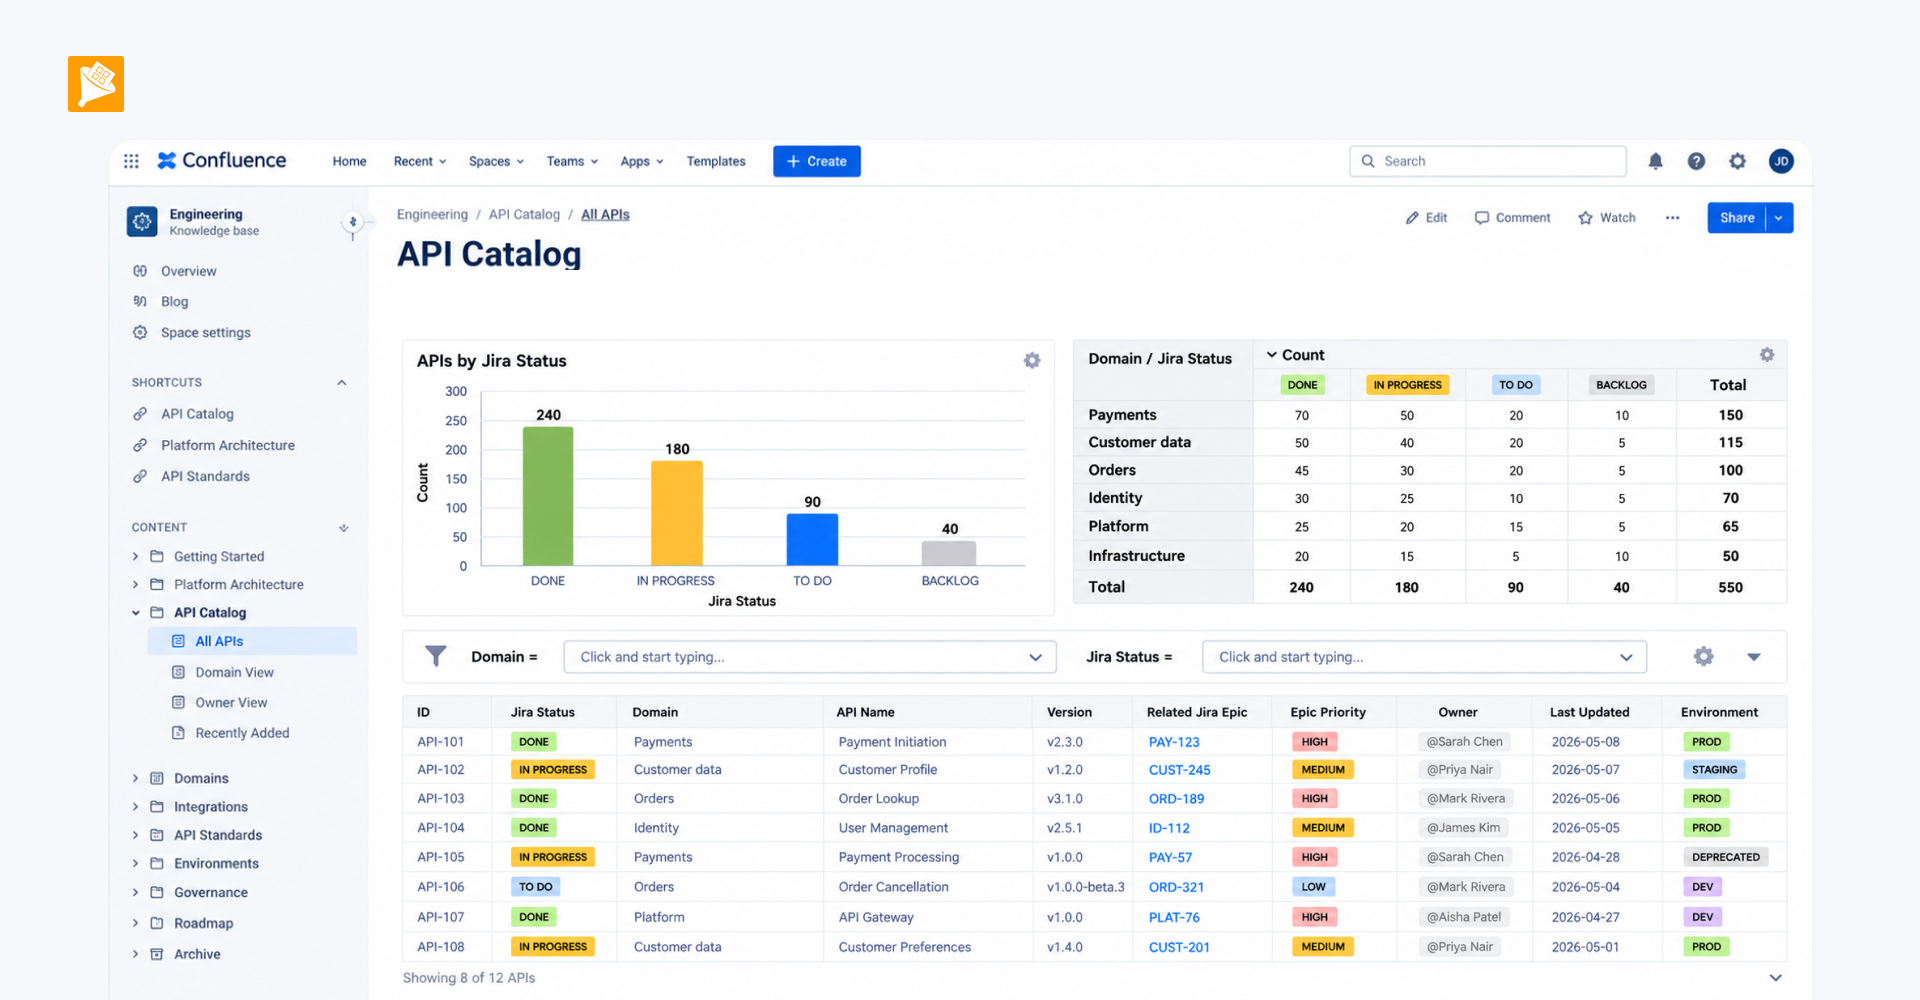
The Jira ticket data is presented as a two-dimensional heat map, with teams on one axis and statuses on the other. Instead of reviewing individual tickets, stakeholders can immediately see which stages contain the most tickets and how the workload is distributed across teams.
How it is built
- The Jira Issue table is wrapped in Table Filter, which can be used to narrow the data shown in the report.
- On top of it, Pivot Table groups the ticket data by responsible team and status.
- Table Transformer processes the resulting summary table and applies SQL-based cell formatting to create the heat-map effect.