


How to Merge Tables in Confluence and Reuse Content for Cross-Team Reporting

April 24, 2026
#How To#Confluence Tutorial#Confluence#Reporting
15 min

Reporting in Confluence quickly becomes complicated when the data comes from multiple sources. What starts as a simple update can turn into a patchwork of scattered tables, Jira work items, and spreadsheets that need constant manual cleanup. The bigger the reporting workflow gets, the easier it is for the output to drift out of sync with the sources.

This article shows a more reliable way to merge tables in Confluence and reuse content more systematically across pages, spaces, and teams. Instead of manually merging tables in Confluence every time or using external tools, you can create a repeatable workflow: collect source data from different places, turn it into a report-ready dataset, build report views, and reuse them across pages.

Key takeaways

  • Scattered source data makes reporting in Confluence fragmented and ineffective; manual copy-pasting creates static outputs that quickly drift out of sync.

  • Consolidated reporting turns that process into a repeatable workflow inside Confluence.

  • Table Filter, Charts & Spreadsheets for Confluence supports each step: collecting, transforming, building, and reusing.

  • The result is a single report-ready dataset that can power filtered views, summaries, and charts, all of which can be reused across pages.

Why merging tables in Confluence often feels like a hassle

If you regularly build reports across teams, you probably know the pattern.

One team keeps a project status table. Another one keeps release-related data in a Jira project. A third exports their Jira work items into a separate page before every meeting. Then you have to merge everything manually, fix formatting, and remove duplicates, hoping you are looking at the latest version.

Instead of putting together a report, you are chasing data all over the place. But the fact that it sits in different places is only part of the problem. The other is that when you copy and paste it, the data quickly goes stale, leaving you with yet another dead document.

This is hardly an edge case. Our customer research points to the same problem: bringing data together from multiple sources and reusing it on other pages often requires more manual work than it should.

Gartner reported in 2023 that the average desk worker uses 11 applications to complete their tasks, up from six in 2019. In 2026, with even more tools in the mix, this feels increasingly unacceptable.

Luckily, there’s a better approach. Instead of manually chasing scattered data and rebuilding reports every time something changes, you can create a workflow that pulls everything together and keeps the report (and any pages that reuse it) updated automatically.

For this kind of workflow, the Table Filter, Charts & Spreadsheets for Confluence app adds capabilities that Confluence lacks out of the box. Its macros are designed to support the entire reporting process, helping you bring data together, turn it into a usable dataset, and reuse the results where they matter.

How to combine and reuse data in Confluence for different reporting needs

There is more than one way to build a reporting workflow from multiple data sources. The right setup depends on how your data is structured and what kind of output you need. The use cases below introduce the main setups, following the same core flow:

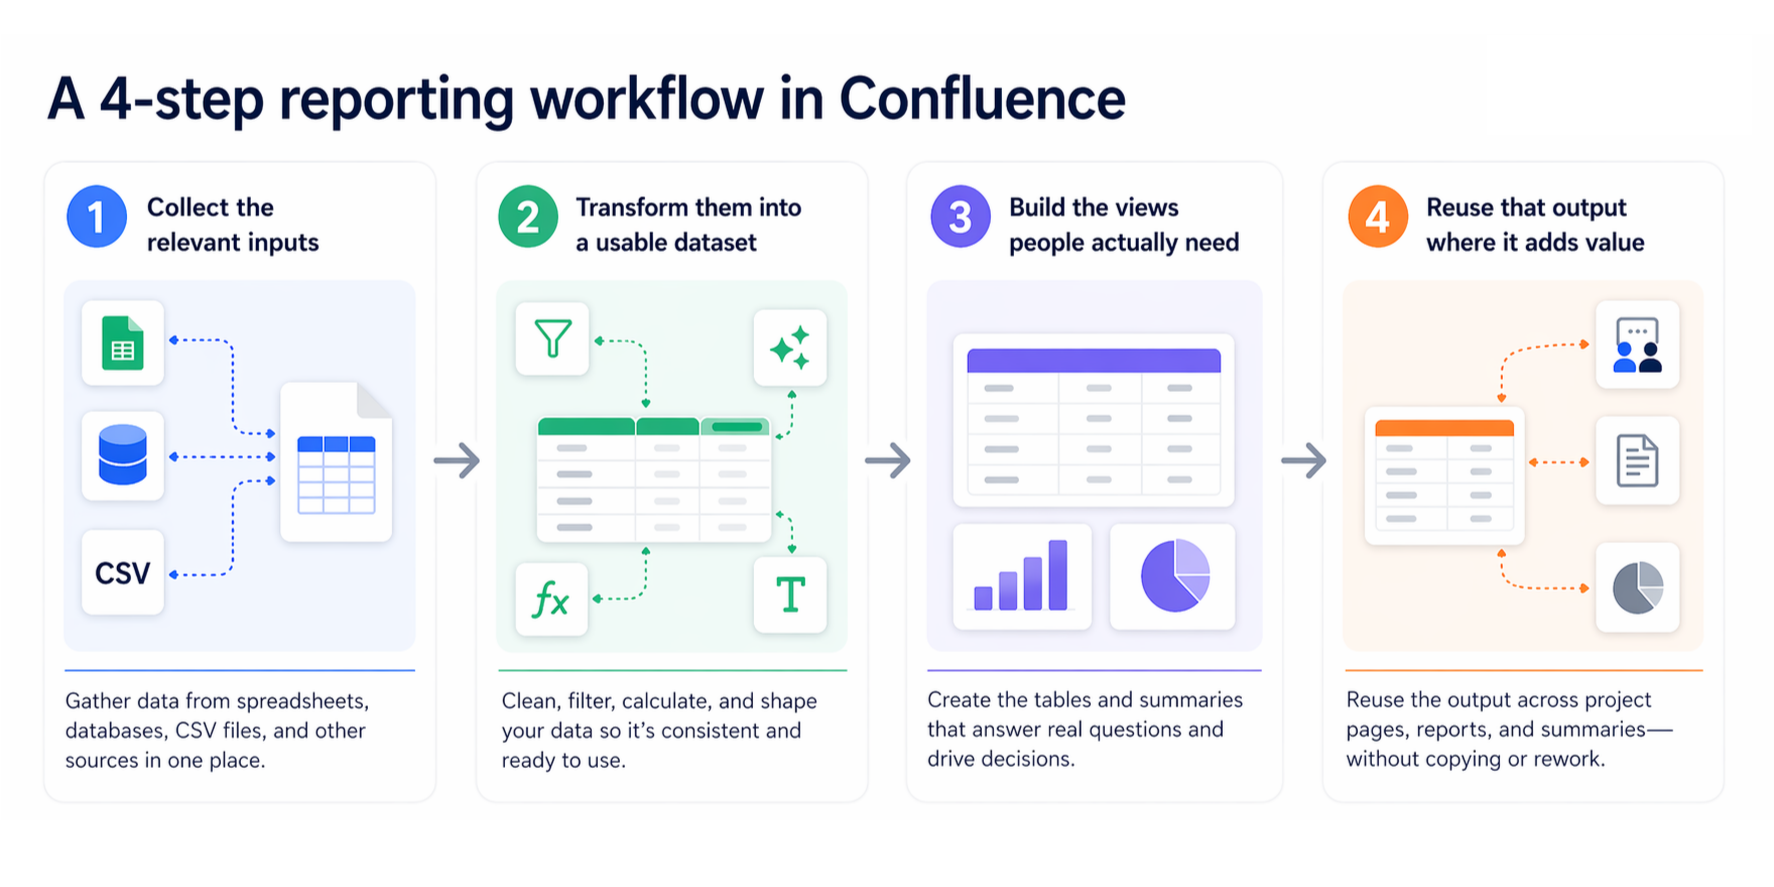
  • Collect the relevant inputs

  • Transform them into a usable dataset

  • Build the views people actually need

  • Reuse that output where it adds value

Infographic titled “A 4-step reporting workflow in Confluence” showing four connected stages: collect relevant inputs, transform them into a usable dataset, build the views people need, and reuse the output across pages. Each step appears in a separate card with icons for data sources, table transformation, report views, and reused outputs.
How teams can move from fragmented inputs to reusable reports in Confluence.

Use case 1: Merge tables from multiple pages

Best for

Use this when similar tables are maintained on different Confluence pages, but you need a single combined report. For example, when you want to:

  • roll up budgets or expenses

  • consolidate tool inventories across teams

  • build an employee list across a department or division

  • track progress across multiple projects or teams

Typical problem

Different teams keep their own status, budget, risk, or KPI tables on separate pages. The structure is close enough to combine, but every time you need a roll-up, you end up copying rows into a master table, rebuilding summaries, and checking whether the source pages have changed again.

How to do it

Collect

Use the Table Excerpt macro on each source page to mark the tables you want to reuse, then collect them on a reporting page using Table Excerpt Include. That lets you bring matching tables together without duplicating sources of truth.

Transform

Once the source tables have been collected into a single view, you can further shape the result in Table Excerpt Include: add extra metadata fields such as the page creation date or labels, or transpose the source tables if that makes the final report easier to work with.

Build

From there, shape the combined dataset into the right output. Use the Table Filter macro for a more focused working view; Pivot Table for a roll-up by team, status, or period; and Chart from Table if the result is easier to read visually.

Reuse

Once that output is ready, you can reuse it on other pages with Table Excerpt and Table Excerpt Include. This way, your reporting workflow supports several audiences.

What you get

You get a single consolidated report built from multiple source pages, while each team retains ownership of its data where it already lives. That reduces copy-paste work, keeps local maintenance intact, and makes the roll-up easier to trust.
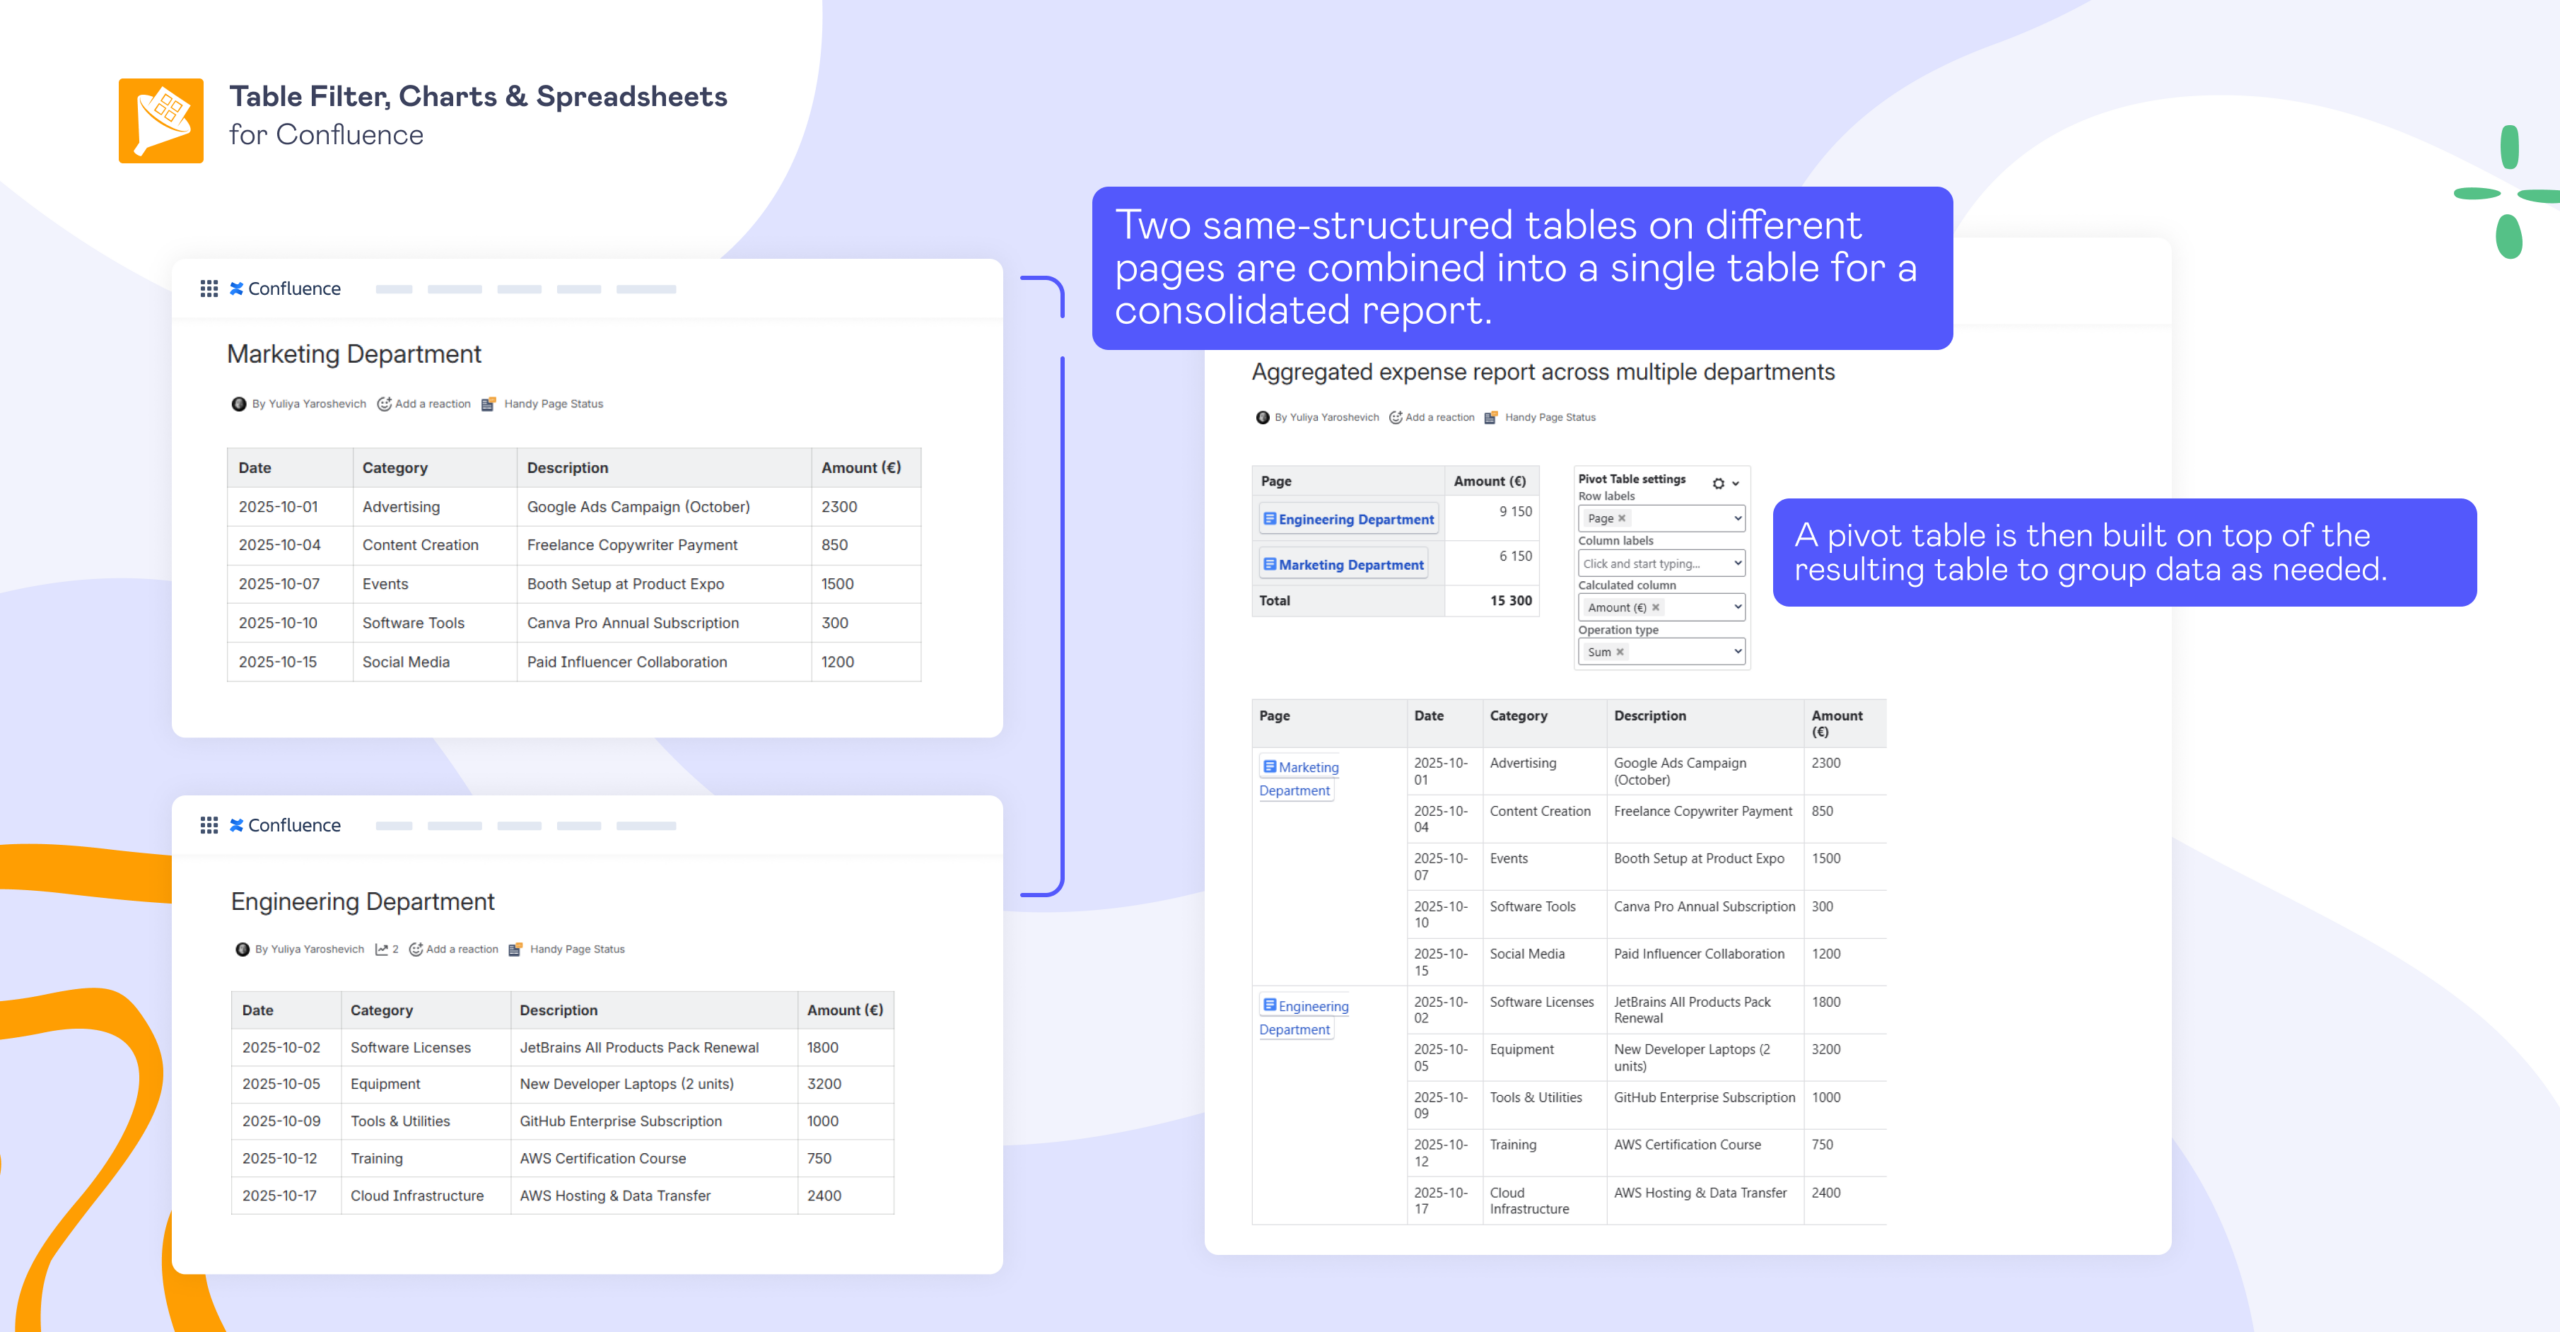
Illustration of merge tables in Confluence: two department expense tables on separate Confluence pages (Marketing and Engineering) being combined into one aggregated expense report, with a pivot table added to summarize the consolidated data.
Two tables with the same structure from different Confluence pages are merged into a single consolidated report, then summarized in a pivot table for a higher-level view.

Use case 2: Join related tables by a shared field

Best for

Use this when you have two related Confluence tables connected by a shared field and want to combine them into a single report. This often applies when you need to:

  • match tasks with owner details kept in a separate table

  • connect assets with location or category data

  • combine project records with reference information stored elsewhere in Confluence

Typical problem

You may have one table with project data and another with reference fields tied to the same records. Without a proper join, you either keep jumping between them or export both to another tool just to combine a few columns.

How to do it

Collect

If the tables are not already on the same page, pull them in from other pages using Table Excerpt and Table Excerpt Include first.

Transform

Use the Table Transformer macro with its Lookup Tables preset to match rows on that shared field and combine the related values into a single output. This is what turns two connected datasets into a single report-ready table so the shared information appears together rather than being split across separate sources.

Build

After that, build the kind of report stakeholders need. Use Table Filter to surface the part of the joined table that matters for the report. Create a pivot table, if the goal is to summarize the enriched data. Use Chart from Table when a visual summary is more useful than raw rows.

Reuse

Once the joined output is ready, wrap it in Table Excerpt and surface it on other pages with Table Excerpt Include, rather than recreating the same lookup logic in several places. That lets one enriched dataset feed multiple reports, dashboards, or stakeholder pages without repeating the join.

What you get

You get one readable report instead of two separate tables. The related values are brought together in a single reporting view, making the full picture easier to read.
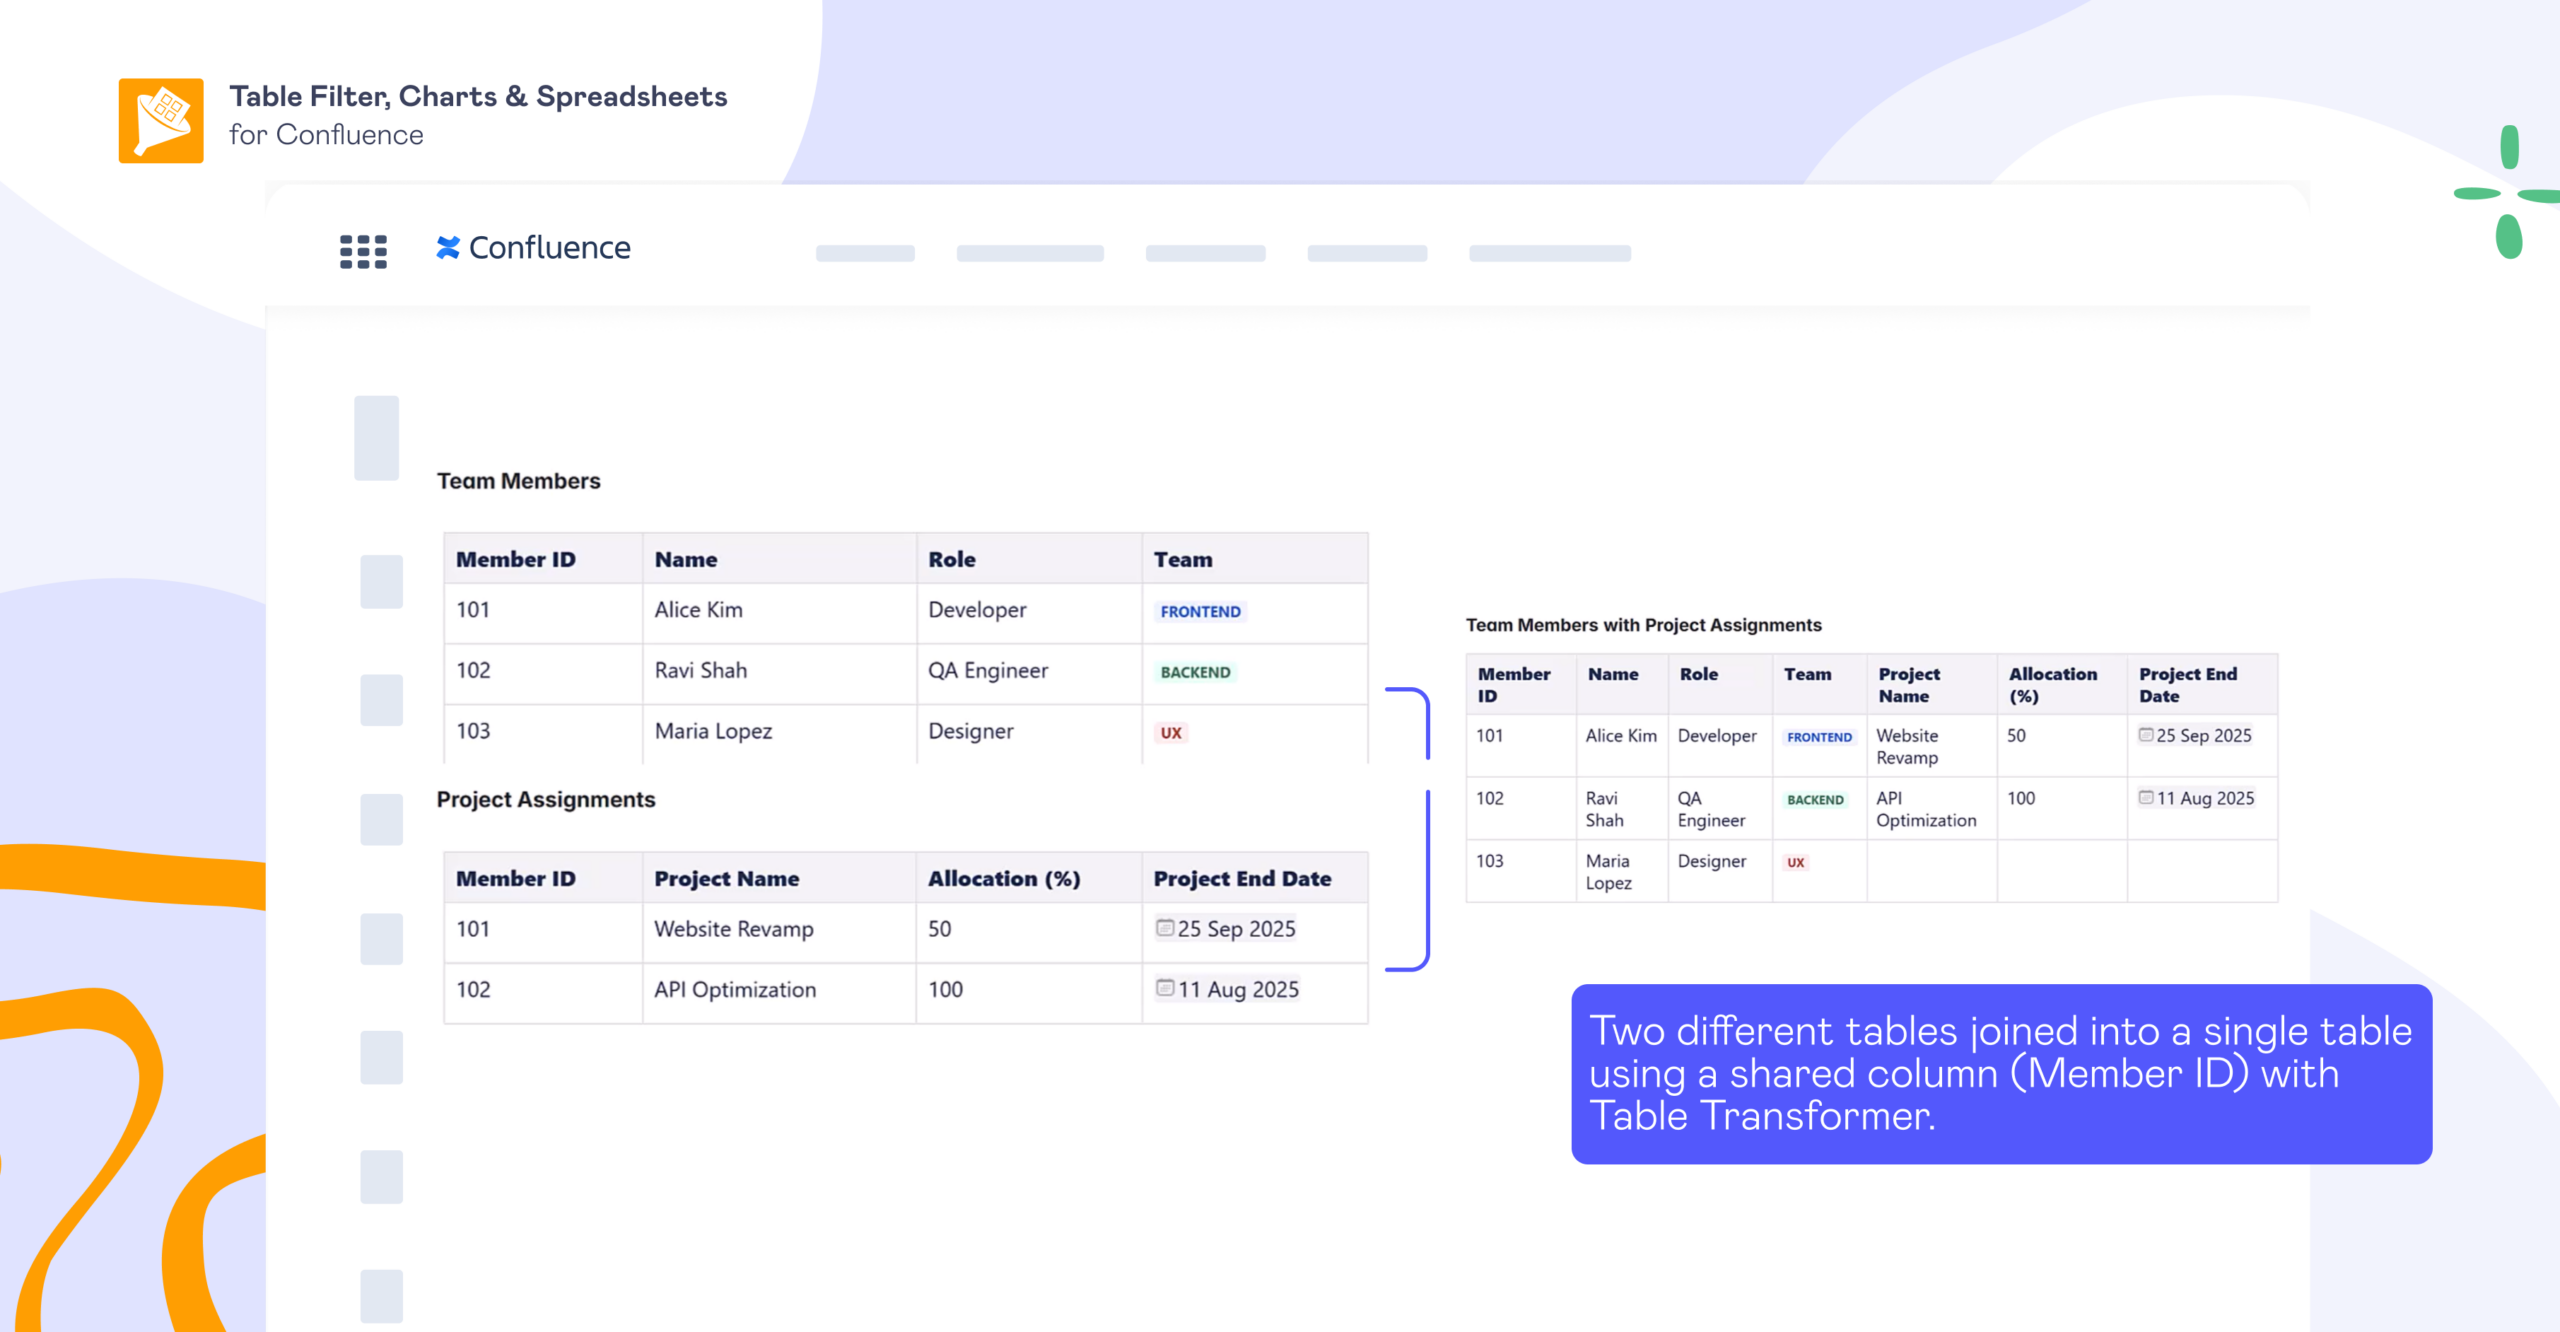
Illustration showing two related Confluence tables (Team Members and Project Assignments) joined into one combined table by the shared Member ID field using Table Transformer.
Two related tables are joined on a shared field to create a reporting view that brings the connected data together in one place.

Use case 3: Bring together Jira-based data

Best for

Use this when the reporting problem involves Jira-based tables and the result needs to be easier to read, summarize, or reuse inside Confluence. It’s useful when you want to:

  • combine work item data with linked dependencies

  • roll up delivery information for stakeholder reporting

  • bring related Jira outputs into one page for project reviews, release tracking, or cross-team coordination

Typical problem

You may have one Jira-based table with the main work items and another with related records that matter for reporting. The reporting view is fragmented. People end up switching between Jira outputs, manually following work item links, or exporting data just to reconstruct the picture elsewhere.

How to do it

Collect

Start by pulling the Jira-based tables you want to work with onto the same reporting page, typically using the Jira work items macro.

Transform

Use Table Transformer to combine those Jira-based datasets into a single usable output. In simpler cases, this may involve a more standard transformation. When the relationship is harder to model with a simple lookup, this macro also gives you room for custom SQL logic. That opens up virtually any custom reporting setup you need — for example, bringing Jira data from 20 different projects into a single report.

Build

Then turn the transformed Jira-based data into the kind of reporting layer the page needs. In some cases, the right output is still a detailed table, refined with Table Filter. In others, a summarized view built with Pivot Table or a visual snapshot from Chart from Table makes the result easier to review and share.

Reuse

Once the output is ready, wrap it in Table Excerpt and reuse it with Table Excerpt Include on the page where the broader reporting story belongs. That lets you keep the data and decisions together without having to rebuild the reporting layer in multiple places.

What you get

You get Jira-based reporting that is easier to review and reuse in Confluence, with a single, clearer view instead of several disconnected outputs.
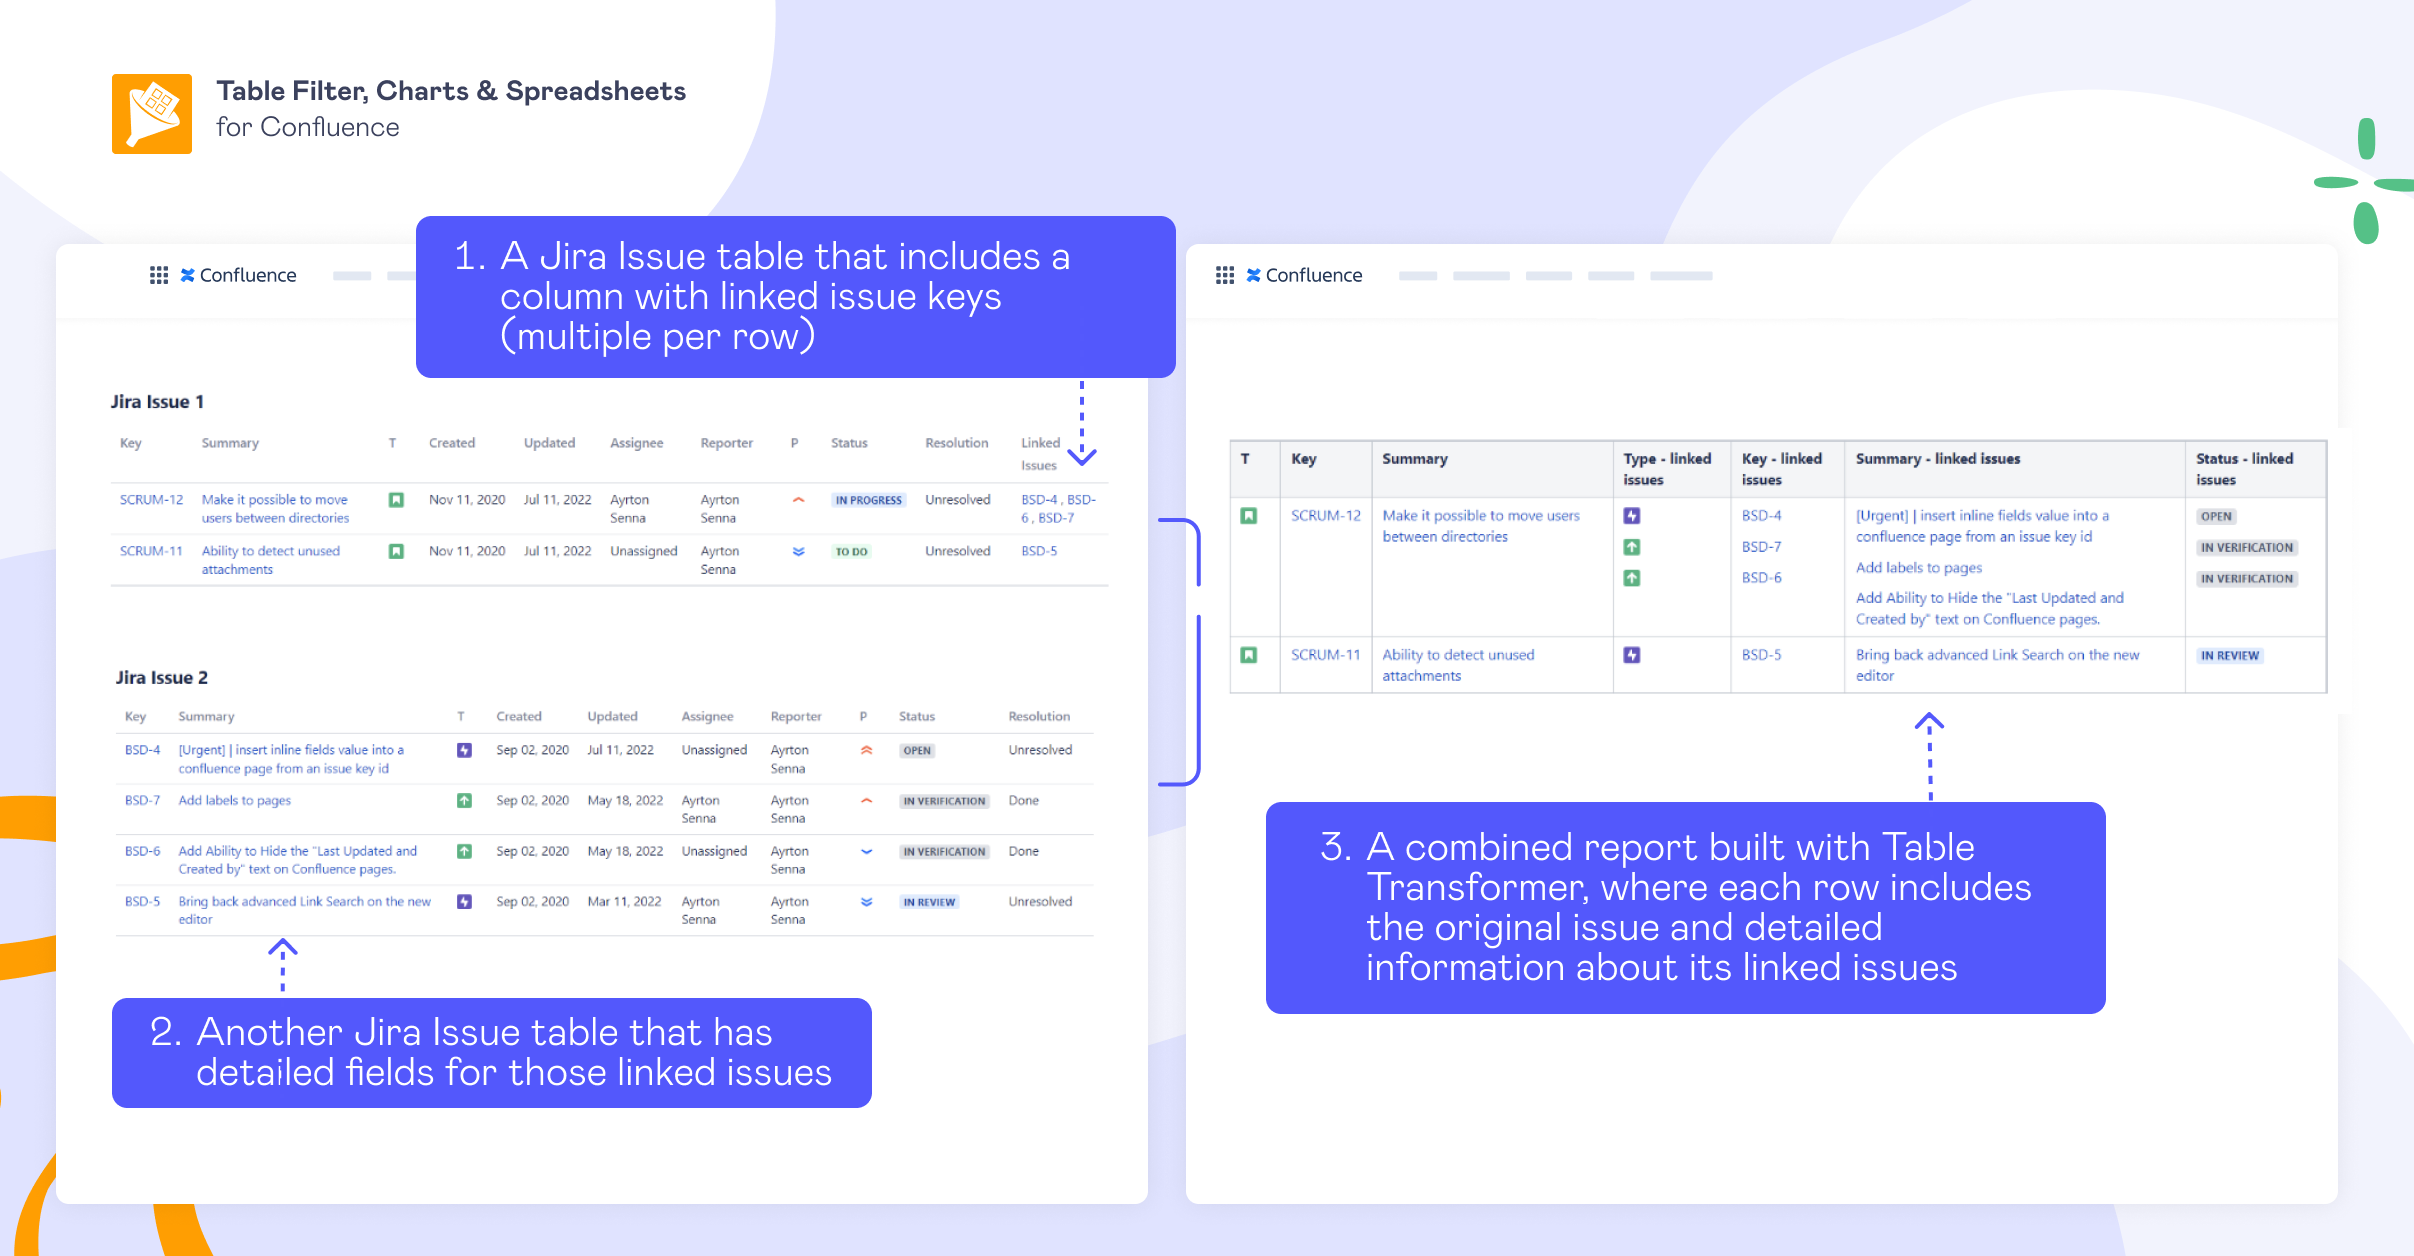
Illustration showing two Jira issue tables in Confluence being combined with Table Transformer: one table contains original issues with linked issue keys, the other contains detailed records for those linked issues, and the result is one report that brings both together.
A Jira-based report can combine original issues with data from their linked issues, so related records appear together in one view instead of across separate tables.

Use case 4: Build spreadsheet-based views

Best for

Use this when the work calls for spreadsheet-style calculations, and you want to handle them in Confluence rather than exporting to Excel or Google Sheets. Common examples include:

  • importing external data and continuing the analysis inside Confluence

  • replacing an Excel or Google Sheets workflow with a spreadsheet that stays on the page

  • reusing calculated metrics, ranges, or selected cells across project pages or reports

Typical problem

Keeping spreadsheet work in a separate tool adds an extra layer of back-and-forth, while copying the results into Confluence turns them into another static snapshot.

How to do it

Collect

Let’s say part of the reporting data sits outside Confluence and needs to be pulled in before you can work with it on the page. Bring it into Confluence using the Table from CSV macro, then convert it into a spreadsheet with Spreadsheet from Table. This gives you a spreadsheet-style workspace on the page, so you can keep working with the data in Confluence instead of switching back and forth between Confluence and Excel or Google Sheets.

Transform

Process the data the way you would in a spreadsheet: apply formulas, calculate metrics, and prepare the specific values you want to reuse.

Build

At that point, the spreadsheet itself may already be the main working view. But if the goal is to surface only part of it, define the exact cell range or sheet that should be shown elsewhere. That way, you do not have to expose the entire spreadsheet just to reuse one result.

Reuse

Use the Table Spreadsheet Include macro to display the excerpt on other Confluence pages. Any updates made in the spreadsheet are reflected in the reused output, sparing you the need to manually replace the same data on every page.

What you get

You keep spreadsheet work in Confluence, making the results easier to reuse across pages. Instead of maintaining the calculations in one place and copying the outputs somewhere else, you can work in a spreadsheet and surface the right parts where they are needed.

Move from copy-paste reporting to a reusable workflow

Done well, consolidated reporting helps make Confluence the center of teamwork. It gives teams three things at once: data that stays close to its context, a workflow that does not have to be rebuilt every time, and reports that are easier to scale and trust.

Once the source tables are reusable and the reporting logic is centralized, the report ceases to be a one-off artifact. With Table Filter, Charts & Spreadsheets for Confluence, you shape it once and reuse the output in the form each stakeholder needs.

Instead of constantly recreating summaries and pasting static snapshots into pages, you keep the reporting flow connected to the source from start to finish. The result is less manual rework, fewer conflicting versions, and more confidence that people are looking at the right data in the right context.
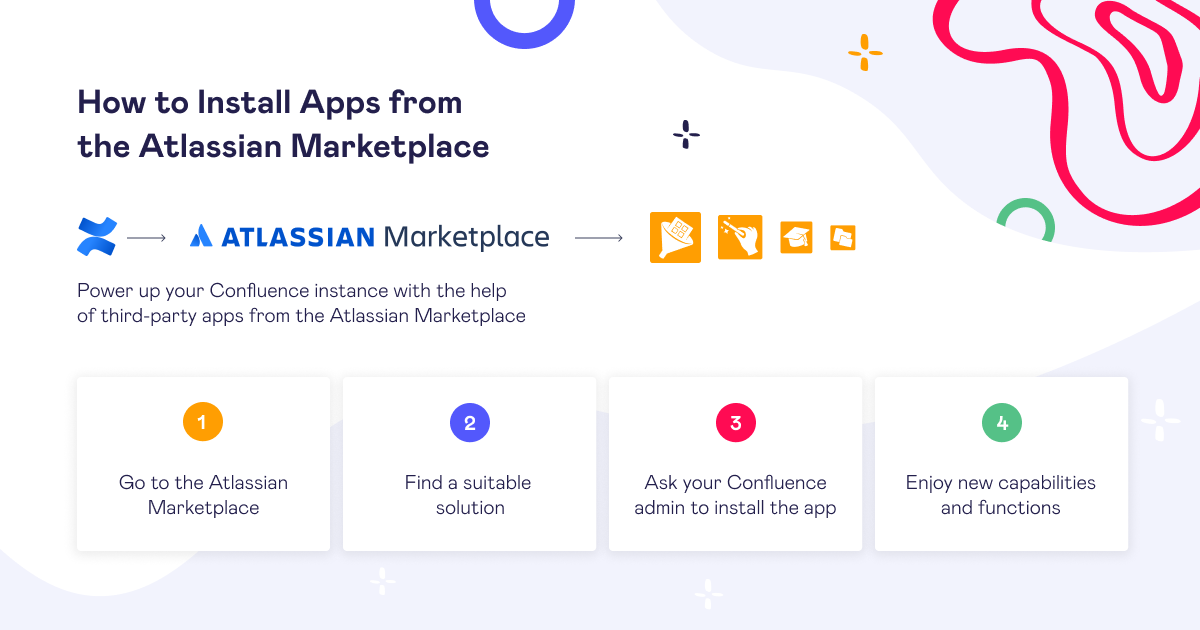

Graphic titled “How to Install Apps from the Atlassian Marketplace,” showing a four-step flow: go to the Marketplace, find a solution, ask a Confluence admin to install the app, and use the new capabilities.
Installing the app is easy (assuming your Confluence admin is in a good mood).

“Start my free trial” button.

FAQs

How do I merge tables in Confluence?

Use Table Excerpt to mark each source table, then collect them on one page with the Table Excerpt Include macro. If the tables share the same structure, you can show them as one report table. If they do not, use Table Transformer to merge and standardize them.

How can I embed a table from another Confluence page?

Wrap the source table in the Table Excerpt macro, then display it on another page with Table Excerpt Include. This lets you reuse the same table without copying it manually.

How do I include a table from another Confluence page?

Use macros from the Table Filter, Charts & Spreadsheets for Confluence app available on the Atlassian Marketplace: Table Excerpt on the source page and Table Excerpt Include on the target page. These macros let you reuse the same table across pages while keeping it connected to the original source.

Can I insert a table from another page in Confluence?

Yes, with the Table Excerpt and Table Excerpt Include macros, you can surface a table from another page directly on the page where you need it.

How do I link a table from another Confluence page without duplicating it?

Instead of copying the table, reuse it with the Table Excerpt and Table Excerpt Include macros. That way, updates made to the source table can flow through to the reused version.

How do I display content from another Confluence page?

If you need to display table-based content, the Table Excerpt and Table Excerpt Include macros from Table Filter, Charts & Spreadsheets for Confluence let you reuse it across pages. This is especially useful when the same data needs to appear in multiple reports or dashboards.

Can I embed content from another Confluence page?

Yes, wrap the source in the Table Excerpt macro and pull it into another page using Table Excerpt Include.

How do I display content from another page in a report?

You can collect source tables from multiple pages with Table Excerpt Include, then use macros such as Table Filter, Pivot Table, or Chart from Table to turn that reused content into a live report view.

Can I build one report from tables stored on different pages?

Yes, mark the source tables with the Table Excerpt macro, collect them with Table Excerpt Include, and, if needed, use Table Transformer to merge them into one report-ready dataset. This way, you can build live reports from reused Confluence tables instead of copying and pasting them into one page.

How do I reuse the same table on multiple Confluence pages?

Use the Table Excerpt macro on the source page and Table Excerpt Include wherever else the table needs to appear. This avoids duplicate maintenance and keeps the workflow easier to manage.


How to Export a Confluence Table to Excel

January 29, 2026
#Confluence#How To#Confluence Tutorial
8 min

Choosing how to export a Confluence table to Excel usually comes down to why you’re doing it.

If you just need a one-off export of your data, Confluence doesn’t support this feature natively, so you can either copy-paste the table manually or use a Marketplace app for a cleaner, more reliable export.

But if you’re exporting because you want to work with the data further (for example, to filter it, run calculations, or create pivot tables), you don’t necessarily need to. You can use one of the third-party apps to work with your table like you would in Excel, without leaving Confluence.

Below, we’ll show you how to do both, step by step.

Key takeaways

  • Atlassian doesn’t support exporting tables from Confluence to Excel (or Google Sheets, if that’s your tool of choice) out of the box, so you’ll need to copy-paste manually or use a third-party app.

  • For a one-time shareable export, manual copy-paste is the quickest option, but you’ll likely experience formatting issues.

  • To export a cleaner dataset, use the Table Filter, Charts & Spreadsheets for Confluence app from the Atlassian Marketplace (and choose the Table Filter, Pivot Table, or Table Transformer macro depending on what you need to do with the table data before exporting).

  • If you’re exporting the table to do data work (not just share with someone else), you can often skip the export and work with the table directly in Confluence using Excel-like workflows. You’ll need the Table Spreadsheet or Spreadsheet from Table macros for that.

How do I export a Confluence table to Excel?

For a one-off Confluence table export to Excel, you can copy-paste it manually or export using a third-party macro.

Option 1: Manual copy-paste

Follow these easy steps:

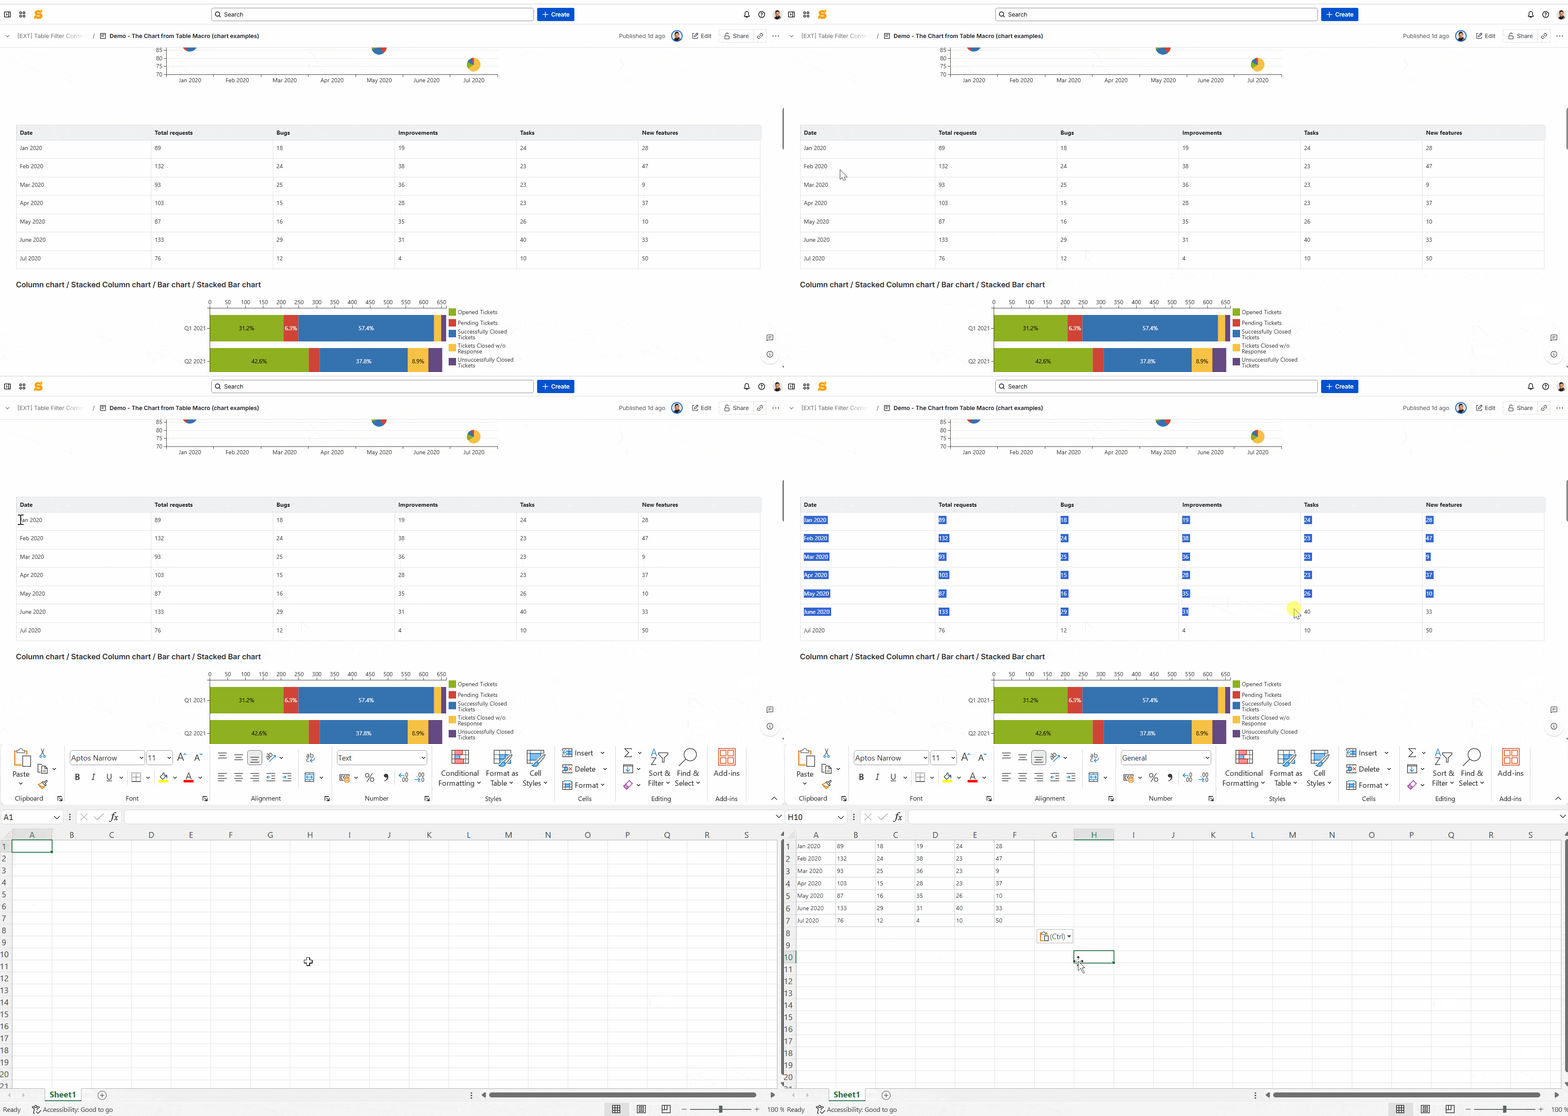
  1. Go to the Confluence page that contains the table.

  2. Highlight the full table by clicking the first cell and dragging to the last cell to select everything in it.

  3. Right-click and choose Copy or use Ctrl + C (Windows) or Cmd + C (Mac) to copy the selection.

  4. Open Excel and create a new document.

  5. Click the starting cell and paste.

Highlight a Confluence table by dragging across cells, then copy and paste into Excel.
Copy the table from Confluence and paste it into Excel.

Quick troubleshooting tips:

  • If the formatting comes through messy, choose Match Destination Formatting from the paste options to remove Confluence styling.

  • Alternatively, try Paste Special and paste as plain text (for example, Text or Unicode Text) so you get clean data you can format in Excel.

  • If the layout keeps breaking, use More actions (⋯) → Export to Word to export your Confluence page (not the table) to a Word file, then copy-paste it further into Excel.

  • If Excel puts everything into one column, go to Data → Text to Columns → choose Delimited → try Tab first, then Comma, if needed.

  • Unmerge any merged cells in the Confluence table before you copy it, since they can throw off alignment and make sorting or filtering in Excel unreliable.

Option 2: Confluence table export to Excel using third-party macros

In Confluence, there’s no built-in macro for exporting tables to Excel. For a smoother, more accurate alternative to manual copy-pasting, you’ll want to use the Table Filter, Charts & Spreadsheets for Confluence app from the Atlassian Marketplace. Its Table Filter macro lets you filter data, calculate totals, and visualize results, as well as shape what’s visible in the table, including sorting and freezing rows and columns.

  1. Wrap your table in the Table Filter macro:

    1. Edit the page and insert /Table Filter, then place your existing table inside the macro body (cut-paste or drag the table into it).

    2. Alternatively, in view mode, use More actions (⋯) → Apps → Use Table Filter App Macros to add it.

  2. Apply filters (optional): Set filters/sorting or hide columns so you export only what you actually need.

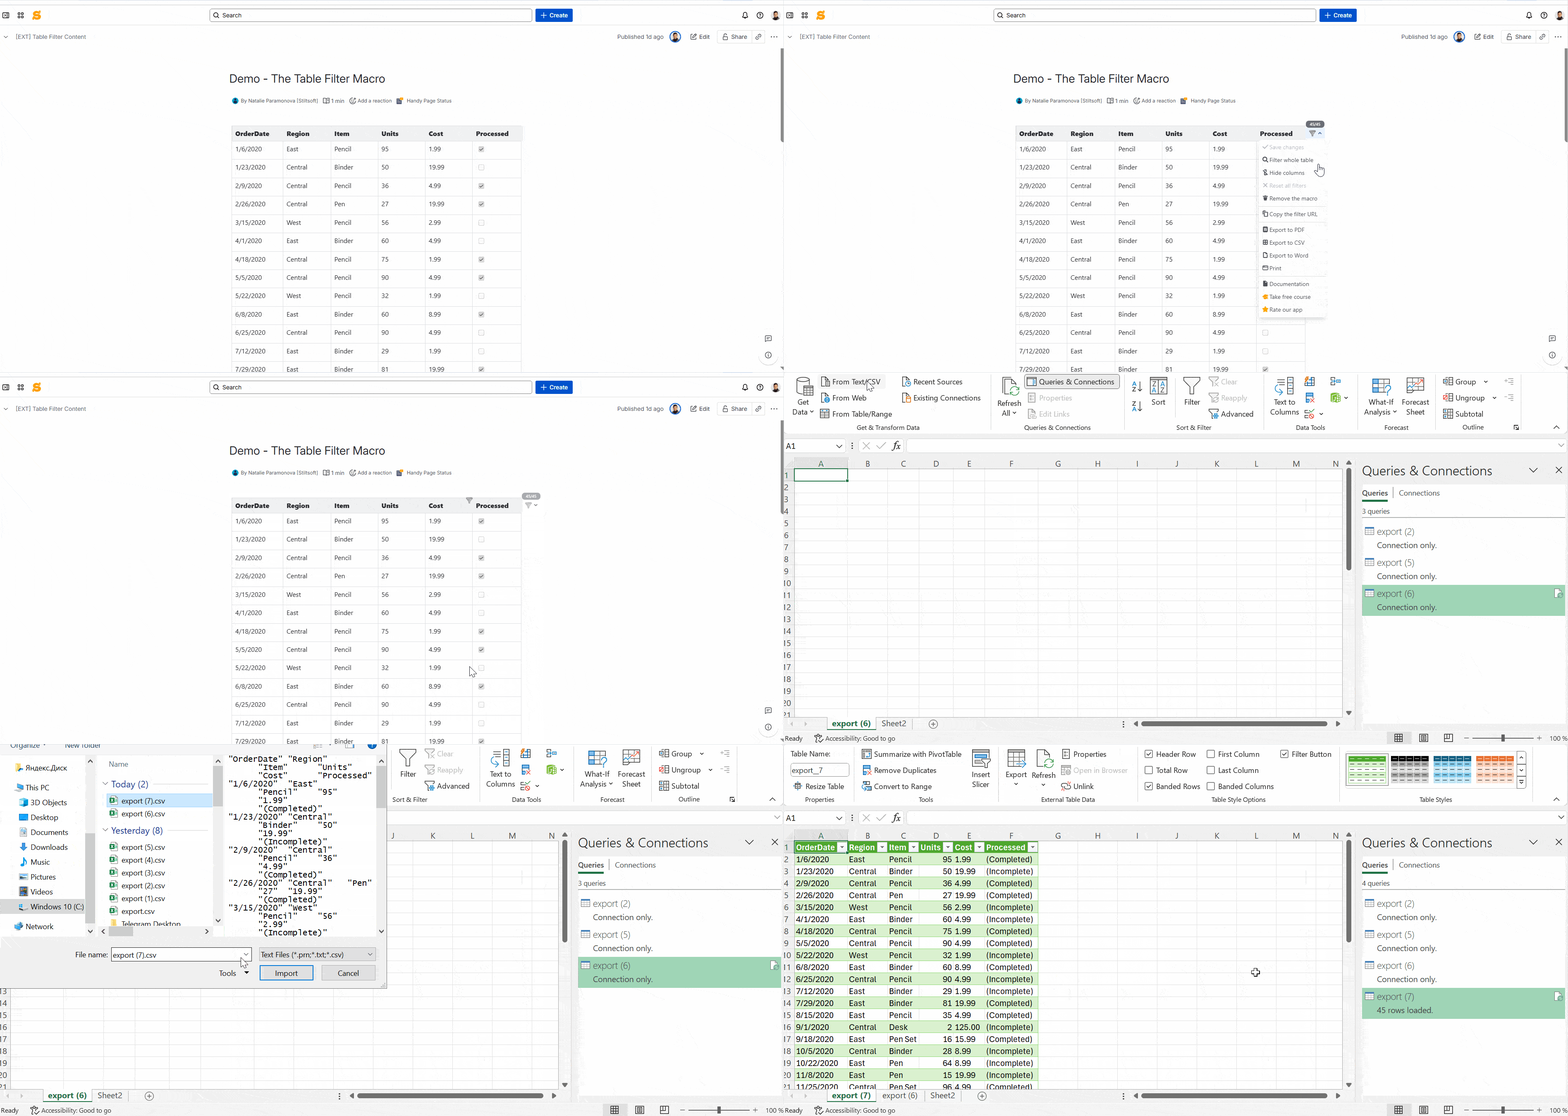
  3. Export to a CSV: In view mode, click the filter icon in the top right corner of the table and choose Export to CSV.

  4. Choose export settings and download: Pick Default settings or Custom settings (for example, delimiter/quotes/header), click Export, then save the CSV and open it in Excel.

Export to CSV is also available in the Pivot Table and Table Transformer macros if you need to aggregate table data in a pivot table or merge several tables before exporting to Excel.

Exporting a Confluence table to CSV from the Table Filter macro and loading it in Excel.
Use Export to CSV in Table Filter, then open the CSV in Excel.

Here’s the key point, though: if further analysis is the goal, exporting your table to Excel isn’t even necessary. With the Table Filter, Charts & Spreadsheets for Confluence app, you can stay in Confluence and work with the table like a dataset while filtering, performing calculations, and reshaping the view to fit your needs.

Alternative: skip the export and work with your table directly in Confluence

Use the Table Spreadsheet macro to create an Excel-like spreadsheet or turn your existing table into one, all with familiar formulas and functions. As part of the Table Filter, Charts & Spreadsheets for Confluence app bundle, this macro enables you to work with tables in Confluence just as you would in Excel.

Option 1: Stay with the original table (no spreadsheet required)

First up, however, double-check whether you even need a spreadsheet in the first place. If all you need is to filter, sort, or hide data, you can skip the spreadsheet and work with your source table directly using the Table Filter macro. For more complex data work, choose one of the two options below.

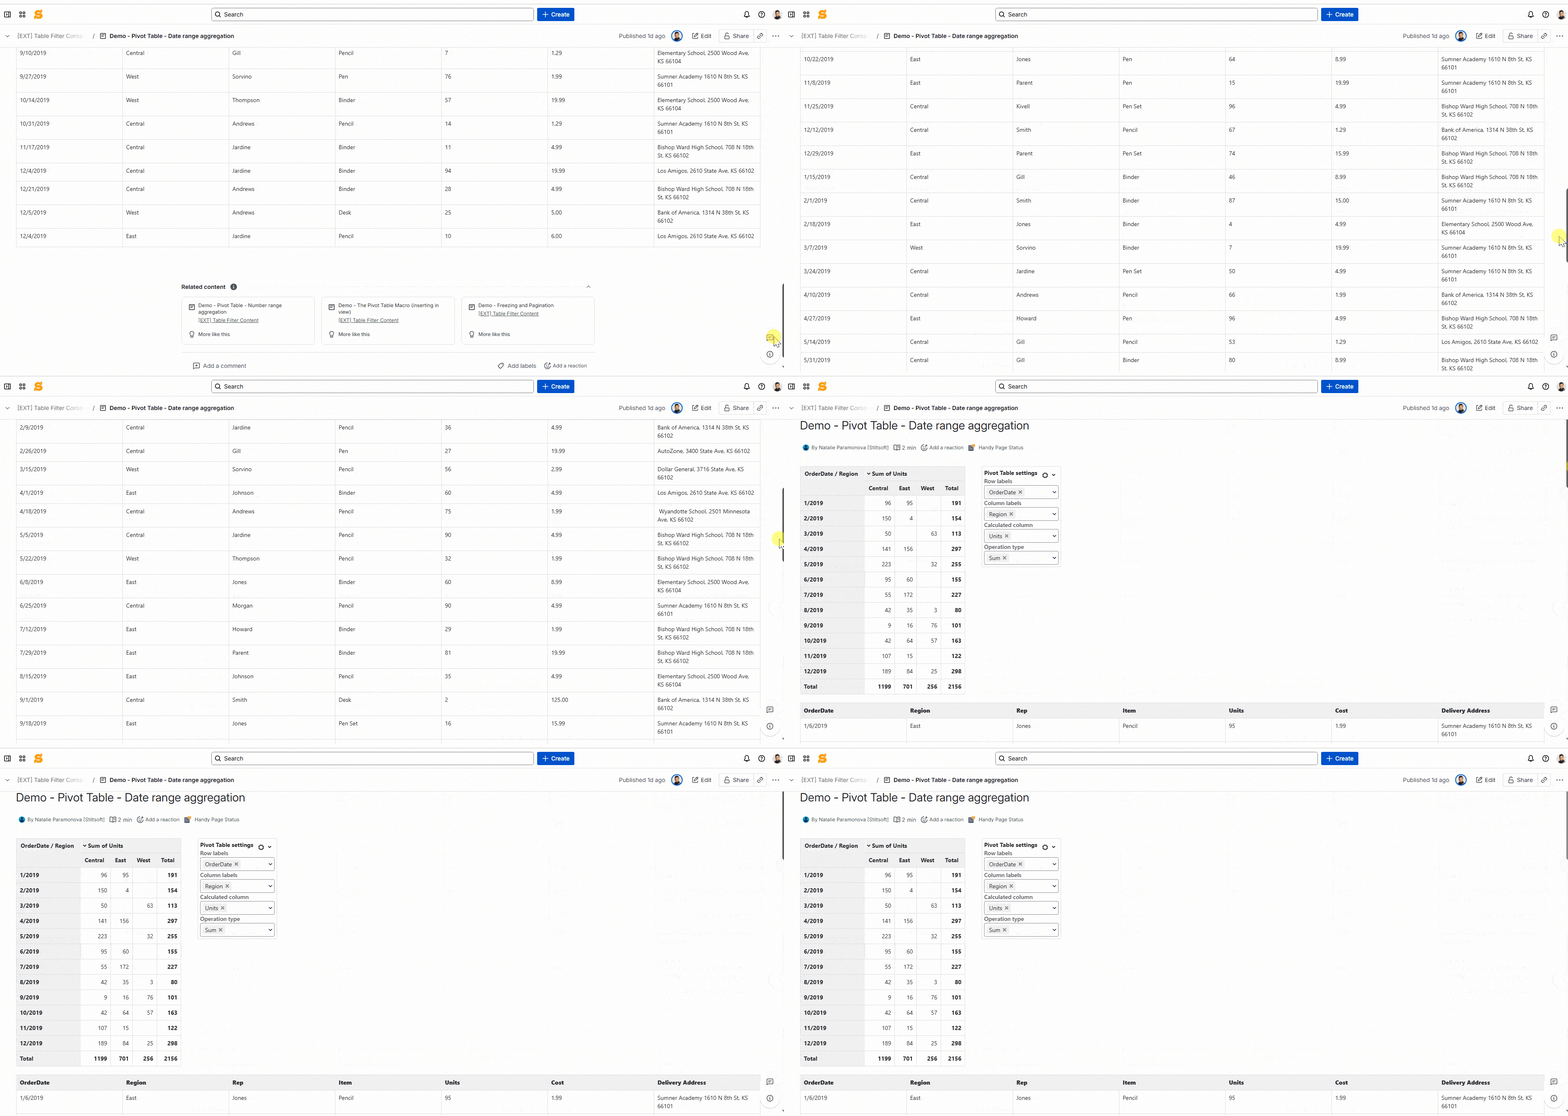
Creating a pivot table from a Confluence table using the Pivot Table macro.
Example: A pivot table created from a Confluence table without exporting to Excel.

Option 2: Add an Excel-like spreadsheet to your Confluence page

  1. Edit the page where you want the spreadsheet to live.

  2. Type /Table Spreadsheet and insert the macro, or use Insert → View more and find the Table Spreadsheet macro there.

  3. Start typing data directly into cells, or import an existing file (supported formats include XLSX, CSV, and ODS).

  4. Add filters, pivot tables, or charts, just as you would in Excel.

  5. Save the spreadsheet manually or enable autosaving (it’s stored as a page attachment; versions are kept).

  6. If you still need to export the spreadsheet, follow the steps described above.

Option 3: Convert your existing Confluence table into an Excel-like spreadsheet

  1. To convert a Confluence table to Excel, make sure the Spreadsheet from Table macro is enabled by your Confluence admin (it’s off by default).

  2. Edit the page and insert /Spreadsheet from Table, or add it in view mode via More actions (⋯) → Apps → Use Table Filter App Macros, then follow the preset dialog.

  3. Copy-paste your existing table (manual or macro-generated) into the macro body.

  4. Publish the page, switch to view mode, and you’ll see your table rendered as an Excel-like spreadsheet.

FAQs

Can you export a Confluence table to Excel in Confluence Cloud?

Confluence doesn’t offer a native “Export Confluence table to Excel” feature. Most teams either manually copy-paste the table into Excel (or Google Sheets) or use a marketplace app like Table Filter, Charts & Spreadsheets for Confluence to export the table to CSV or XLSX.

How do I export only part of a Confluence table to Excel?

Manually, you can copy only the rows or columns you need. Using the Table Filter, Charts & Spreadsheets app, you can first filter rows and hide columns, then export the file to contain only the visible (filtered) view.

Can I export directly to XLSX instead of CSV?

Confluence Cloud doesn’t natively export tables to XLSX. If you need a real Excel file, you’ll typically use an Excel-like spreadsheet macro such as Table Spreadsheet.

Can I work with a Confluence table like in Excel without leaving Confluence?

Yes, you can use the Table Spreadsheet macro and continue working with your data in Confluence using familiar Excel-like formulas and functions such as filters, charts, and pivot tables. You can also stay with the original table and apply the Table Filter macro if your data doesn’t require more complex processing that can only be done in a spreadsheet.

I don’t see the Table Spreadsheet and Spreadsheet from Table macros. Why?

Those macros only appear if the relevant app (Table Filter, Charts & Spreadsheets) is installed and enabled by your Confluence admin.

Will a converted spreadsheet stay synced with the original Confluence table?

The content of the spreadsheet created by the Spreadsheet from Table macro is dynamic, so it will change in its corresponding cell range whenever the source table is updated.

Try Table Filter, Charts & Spreadsheets for Confluence for free

Confluence Page Status Management

January 16, 2024
#How To#Project management#Confluence Tutorial#Reporting#Confluence#Case Study#Collaboration
10 min

Today, Confluence is widely used by many diverse teams for seamless collaboration and documentation management. This highly customizable tool facilitates knowledge sharing, project management, and effective communication. So, let’s dive into the typical workday filled with working with Confluence Cloud and see how Confluence page status management can enhance it.

Product and Content Managers: Challenges, Tips, and Tricks

To start, meet Betty and James, colleagues and Confluence Cloud enthusiasts who love to discuss their work and challenges during the coffee breaks. Despite working in different departments (Content and Product Management), their Confluence work organization challenges are alike. They both strive to find better ways to communicate their work status to their colleagues or indicate when the piece is ready to see the world. Whether it is the latest release or K-Base article, Confluence Page Status opportunities can help in both cases. It turns out that taking coffee breaks with colleagues has its perks and this time, the benefit is the discovery of the Handy Page Status macro from Handy Macros for Confluence app, which can save the day in case of fear of writing blog posts and planning multiple releases.

This article covers tips and tricks on how to set expectations for viewers and collaborators and locate required data in a heartbeat while on the Confluence page. See what James and Betty have learned on their journey and what highlights they had on the way. From how to indicate the Confluence documentation status to putting the Confluence Page Status data in custom reports to filter and search by it – all covered in the reading below!

Learn the Basics: Confluence Page Status

First, what is Handy Page Status, and what value does it bring to the table to the Confluence Page Status? Let’s say ideas are notes, Confluence is a sheet of music that fellow collaborators and viewers can review, and the music symphony is ready for collaboration and feedback. How can we keep everyone on the same music sheet and signal that the symphony was born? The simple solution is to customize and incorporate page status management that best serves your company’s needs.

So, Confluence Page Status is a game-changer for teams and professionals who:

  • Need to incorporate straightforward, accessible, and reusable tools that ensure transparency and clarity of the workflows and their timelines.
  • Deliver dynamic work exposed to active feedback or used immediately as a reference (Betty’s Example: Latest How-To K-Base Article; James’ Example: Content of 1.3.20 app release version).
  • Want to get control of the workflow and its lifecycle and make sure that the feedback is given on the specific timeline of which everyone is aware (Betty’s Example: Page Status: Under Review James’ Example: Page Status: 1.3.20)

Learn About Advanced Status Management: Handy Page Status

With Handy Page Status, both Betty and James can go the distance and level up their Confluence Page Status experience, In addition to native functionality, this macro can:

  • Create status options that work best for your company process and reuse these status sets across pages for status consistencyJames’ and Betty’s works are often parallel lines. Still, they benefit from each other’s Handy Page Statuses. James, assign each Confluence page with the bug report or feature request overview with the corresponding app version when it is planned to deliver them. Betty knows she needs the How-To Article in the blog ready precisely on the release date. All thanks to James’ Handy Page Status for Release. So she knows it’s safe to have the article in the ‘IN PROGRESS’ stage rather than ‘OPEN TO FEEDBACK.’
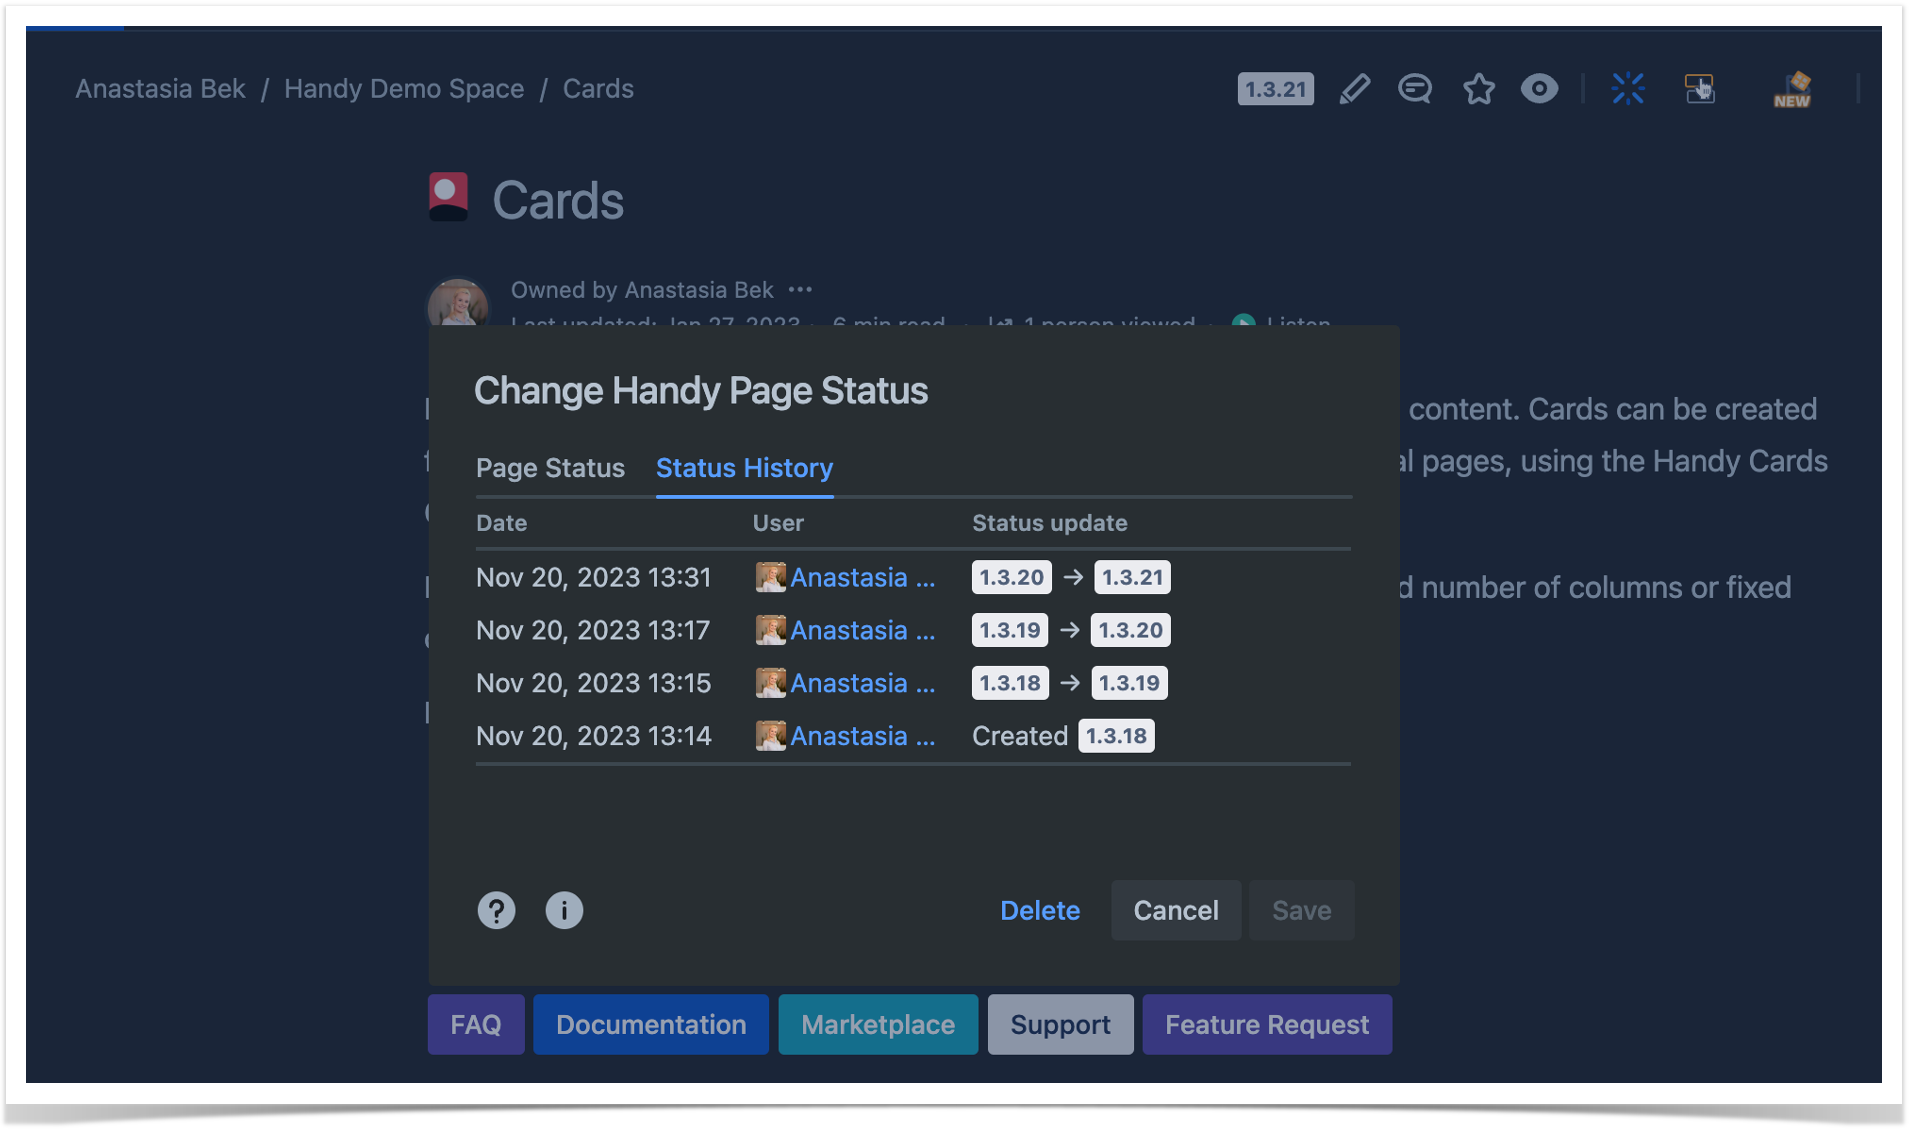
  • When making updates in one click, also see the update history.  The Handy Page Status history can help teams identify bottlenecks and encourage action. Maybe it’s time for another R’n’D session if the same bug fix has been postponed for three consecutive app versions. History also supports tracking time and seeing if Betty is in timing while changing her content from status to status.
  • Search and filter for specific page statuses and have a big picture of custom data in the form of the Handy Page Status Reports. Betty can create a custom report with a specific ‘READY FOR REVIEW’ status for selected spaces to signal feedback givers the article’s status before it goes live and public. James can review at a glance what will be released in version 1.3.20. It helps him decide whether the release can be locked, and the team can proceed with the following steps.

Boost Content Marketing and Product Management in Confluence

And now, here is an example solution. We will see how James and Betty put the Handy Page Status and Handy Page Status Report into practice. They immediately ace their daily workflows and relieve the pain that hits the nerve.

The solution only requires three easy steps:

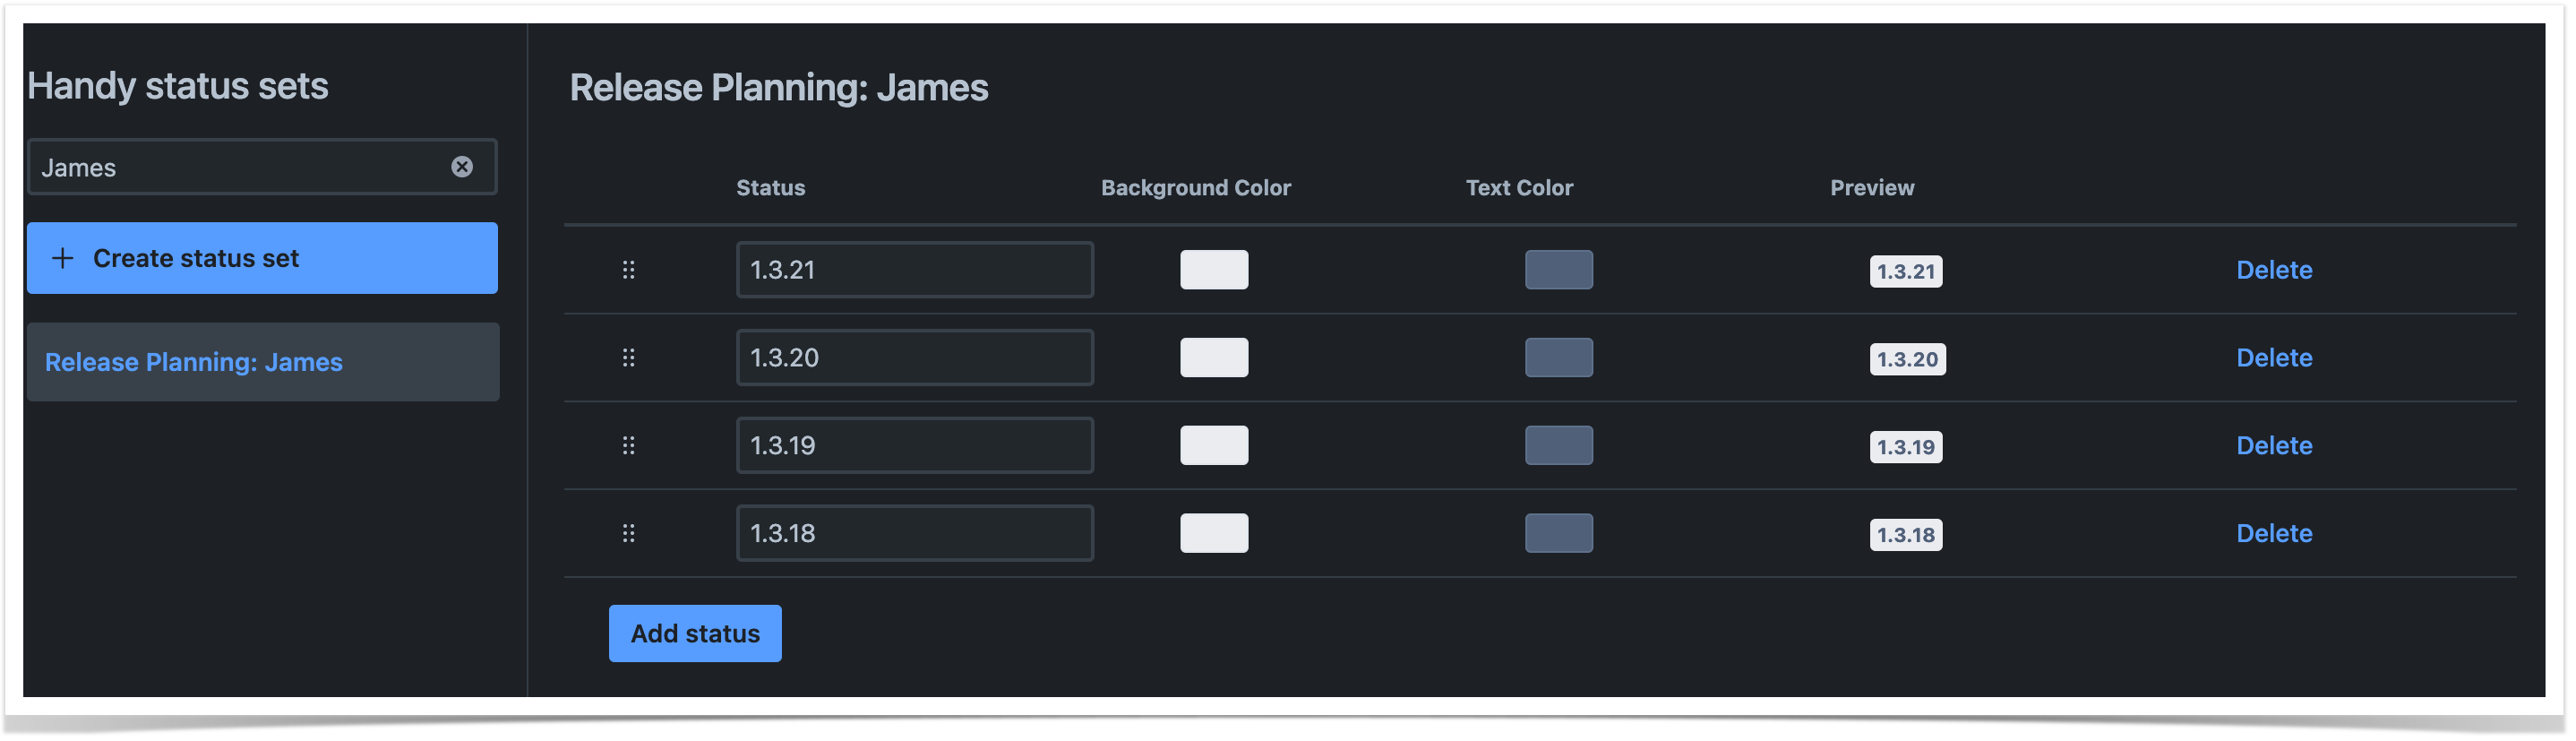
  1. Сreate a new status set that reflects your needs.
  2. Have the time of your life assigning statuses to all relevant pages.
  3. Benefit from the Page Status Report to search and filter Confluence pages and have all the critical information ready at one glance.

Minimalistic Dark Mode Lovers – we’ve got you covered!

Minimalistic Dark Mode for Page Status Report

For those who live on the bright side, Handy Macros for Confluence has a variety of colors to choose from and play with!

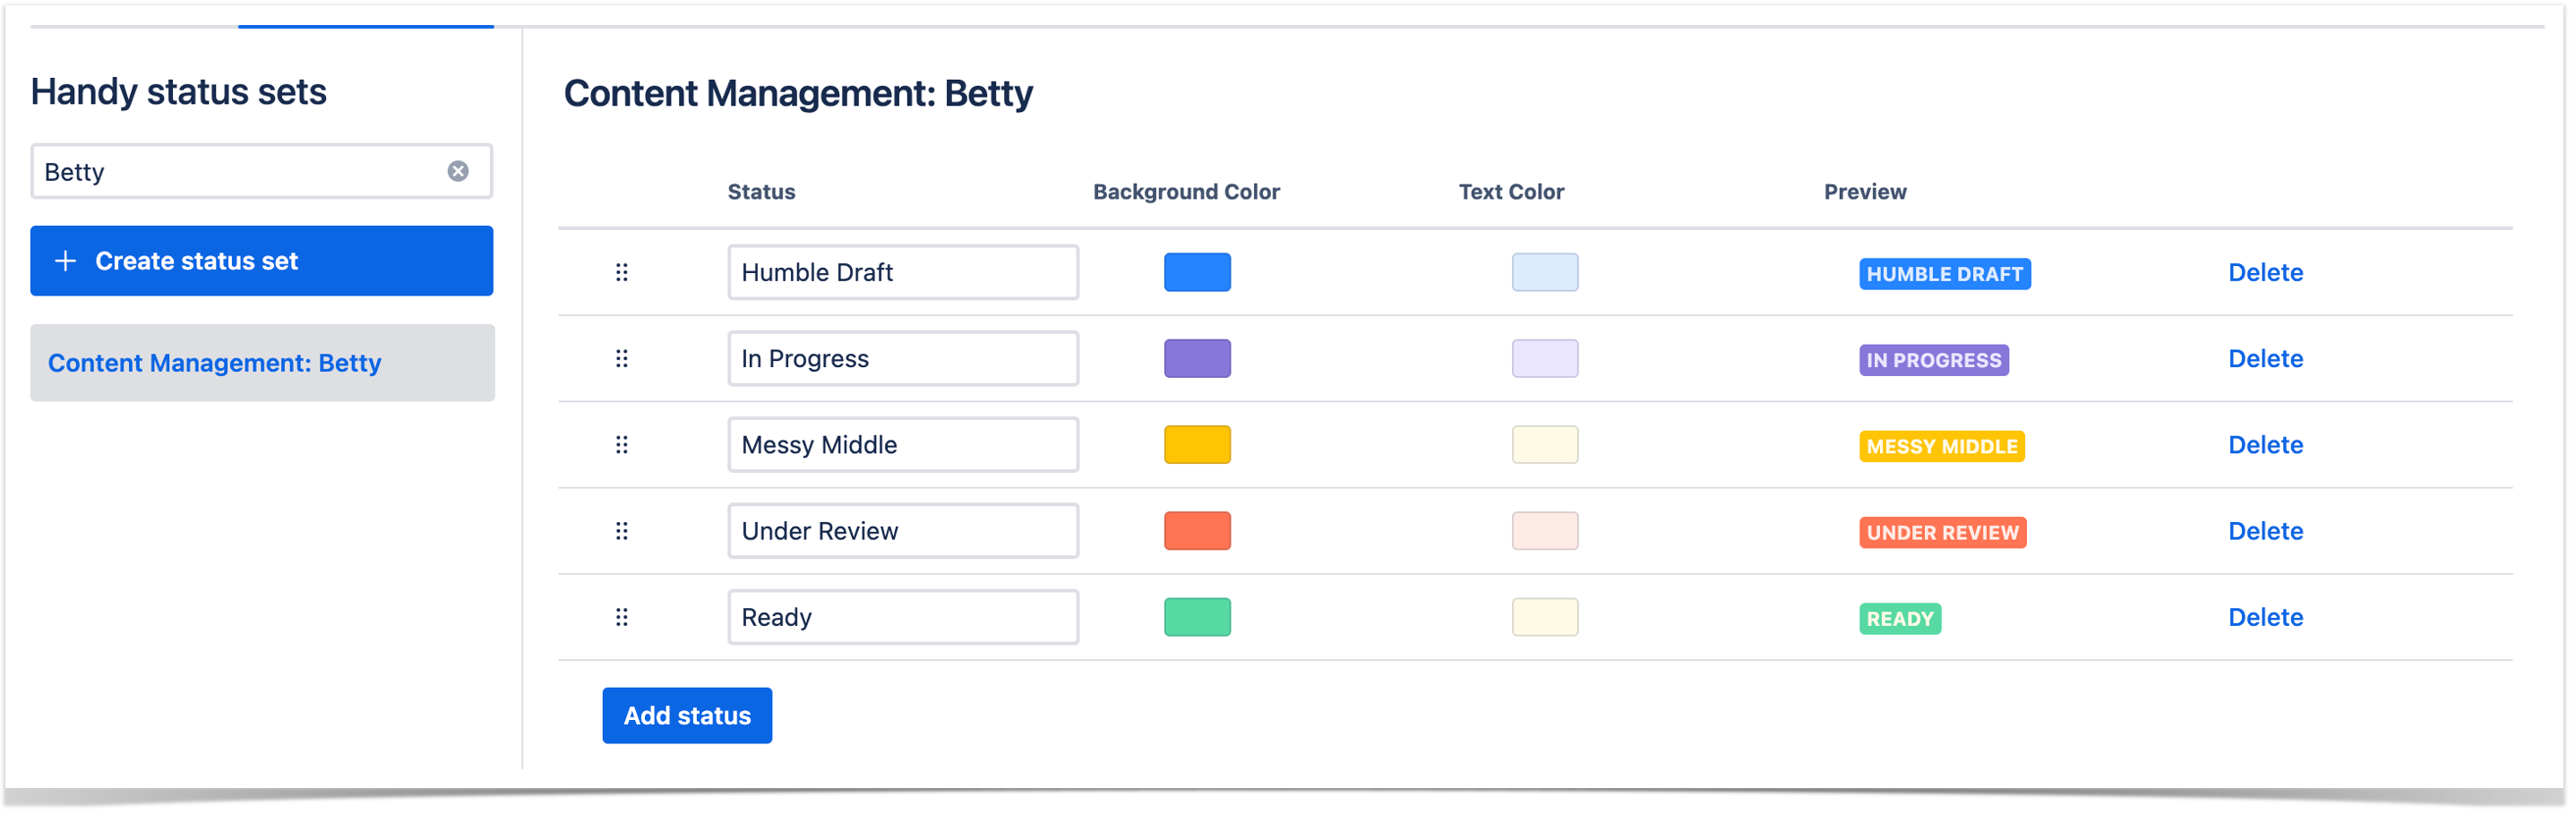
handy status colors

Organize Confluence Page Status Data into Reports 

Those steps look easy enough. Still, they remain to be an effective tool for page status control. The Handy Macros for Confluence app has even more to offer, from Confluence dark mode support to multiple reporting criteria.

The data can be collected in a separate Handy Page Status report based on:

  • Confluence spaces where the status is set
  • Handy Page Status sets
  • Handy Page Status options
  • Confluence users who set the status
  • Handy Page Status dates

Handy Page Status report

Now it’s time to review how it goes on Confluence pages. We will see how you can track release versions and indicate content creation progress in Confluence Cloud.

Control App Releases: James’ Case

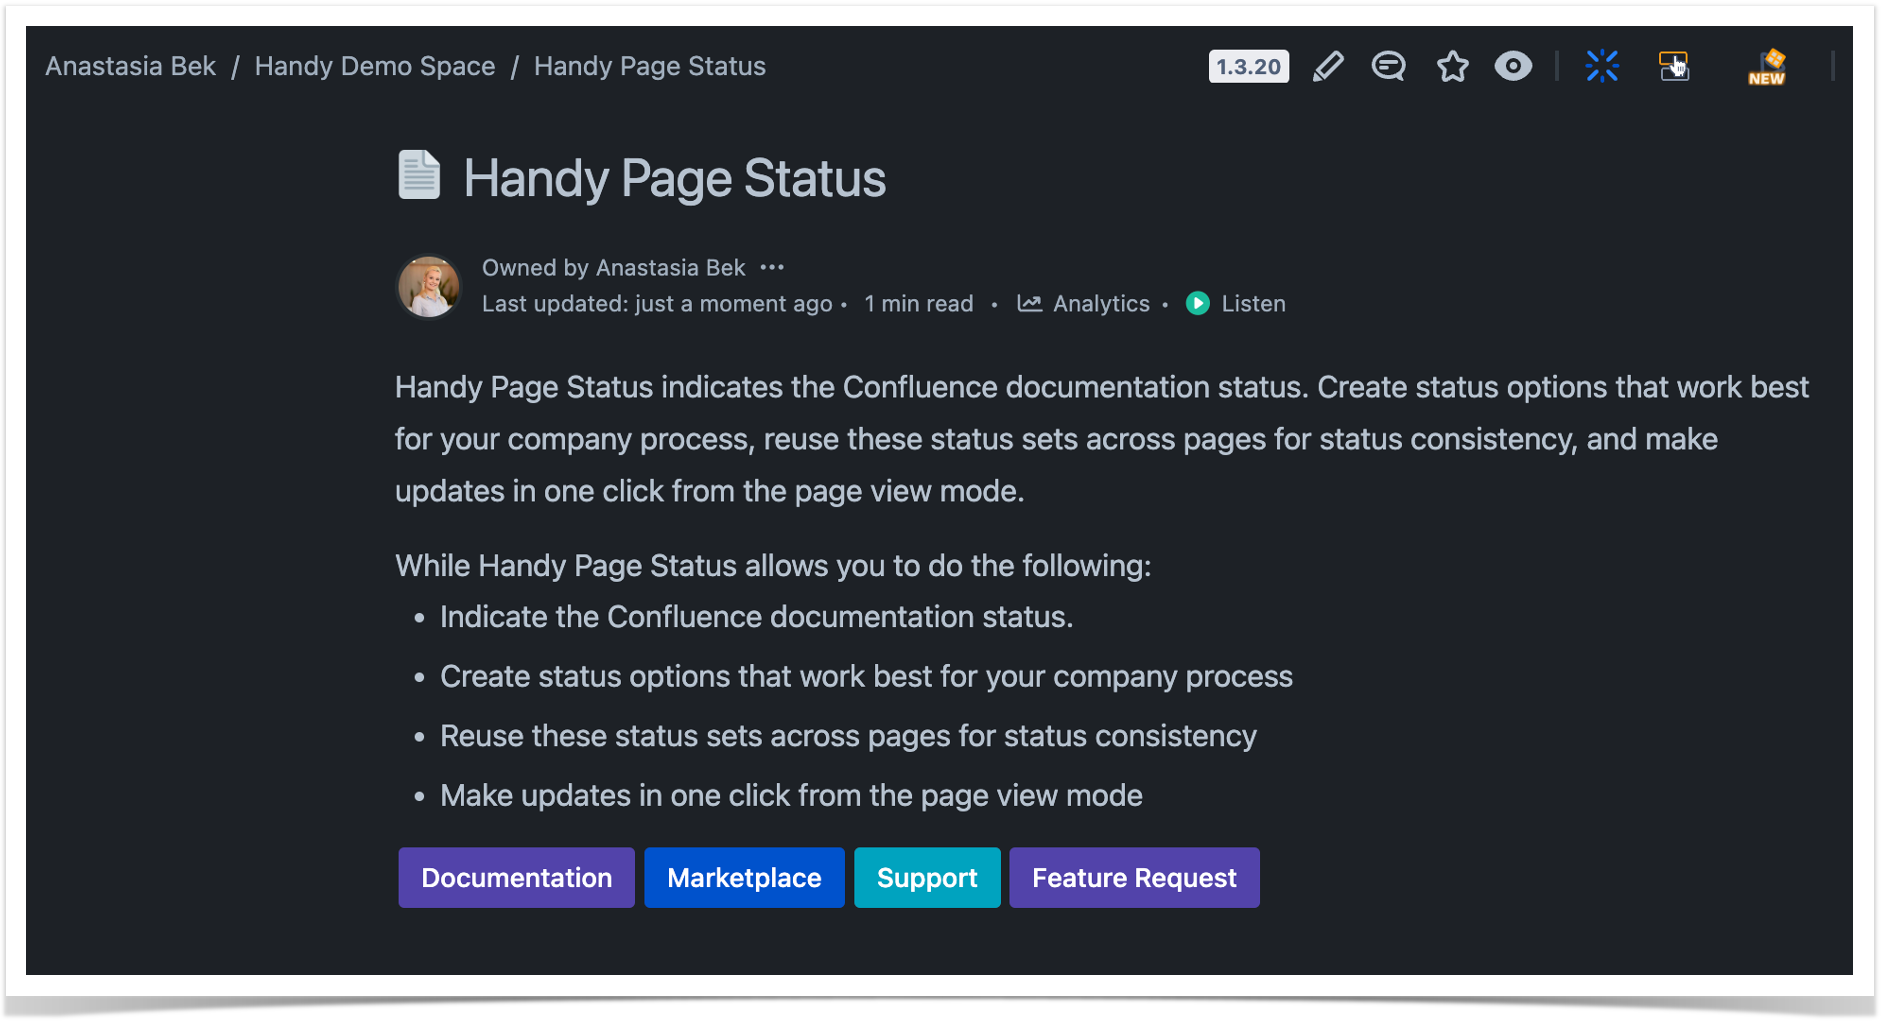
So, James keeps it simple with the release versions. Page Status is assigned to each feature/bug fix page, eventually forming a release. This way, users know when to expect the feature/bug fix to be delivered.

Workflow with Confluence Page Status

All the changes can be done directly in the mode. James and his team can always check for the dynamics if everyone has been waiting for the delivery for ages. James can view the history of the Page Status updates to validate the point or’ ages’ hypothesis in a few clicks. Sometimes, the path is straightforward; sometimes, it’s a bumpy road.All the changes can be done directly in the mode

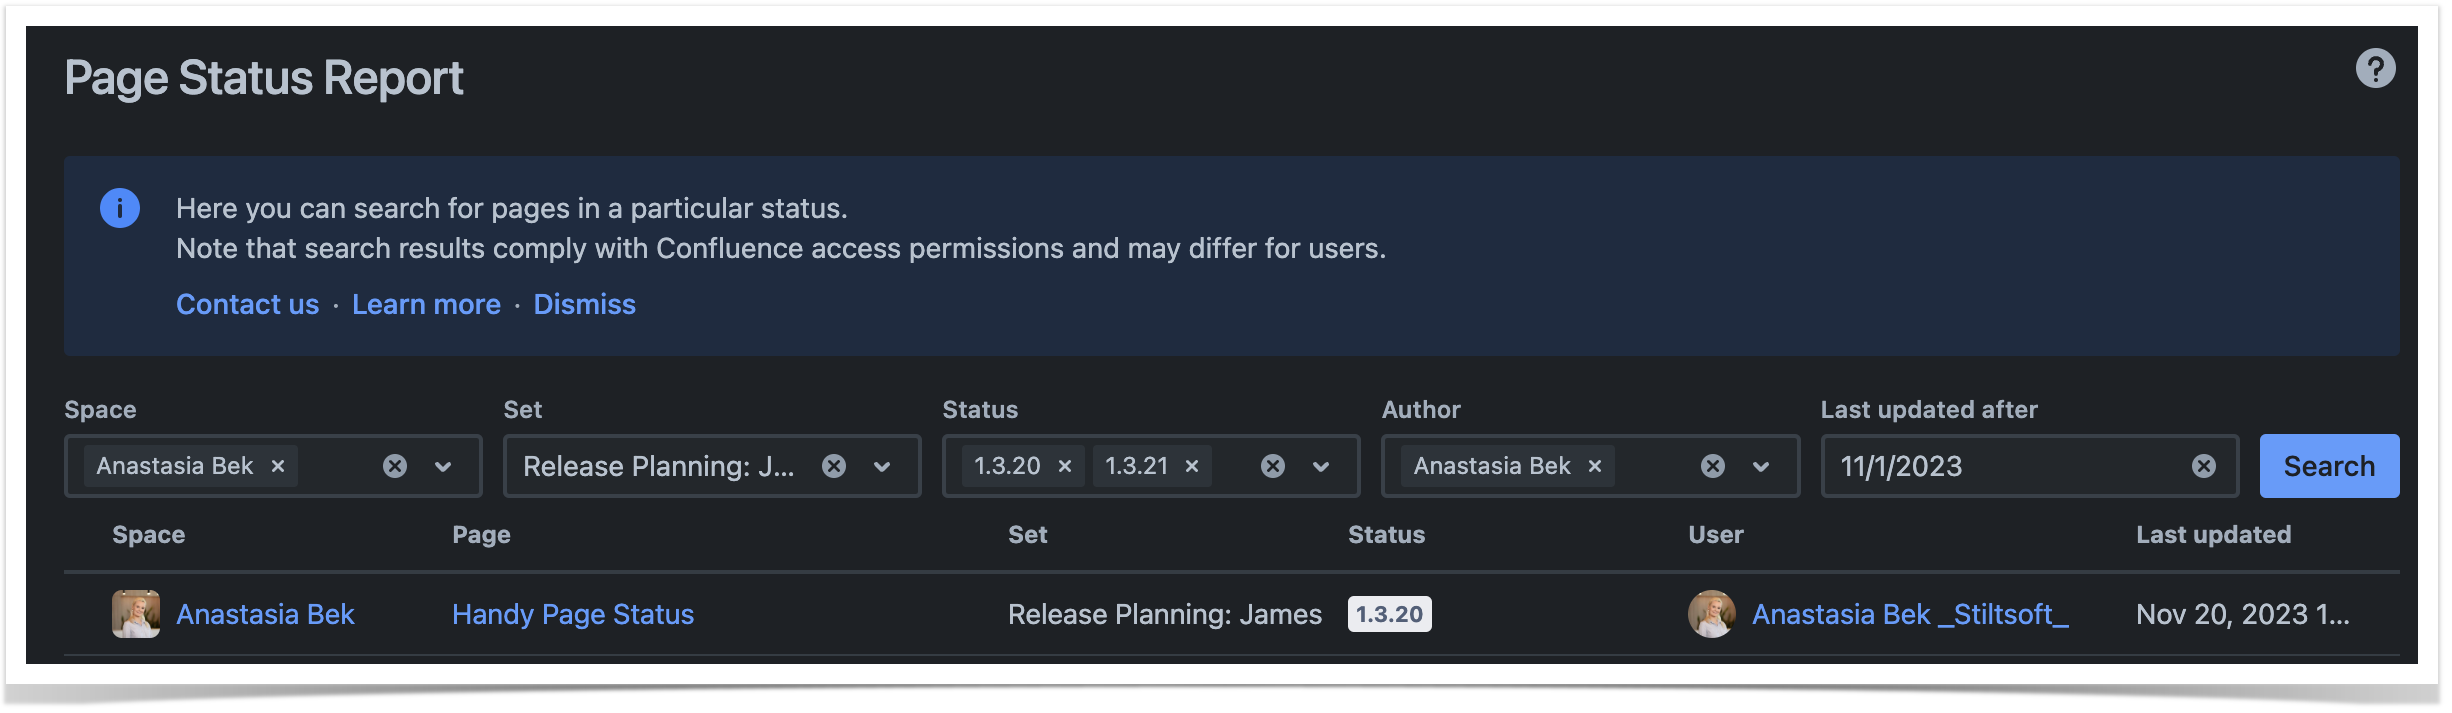
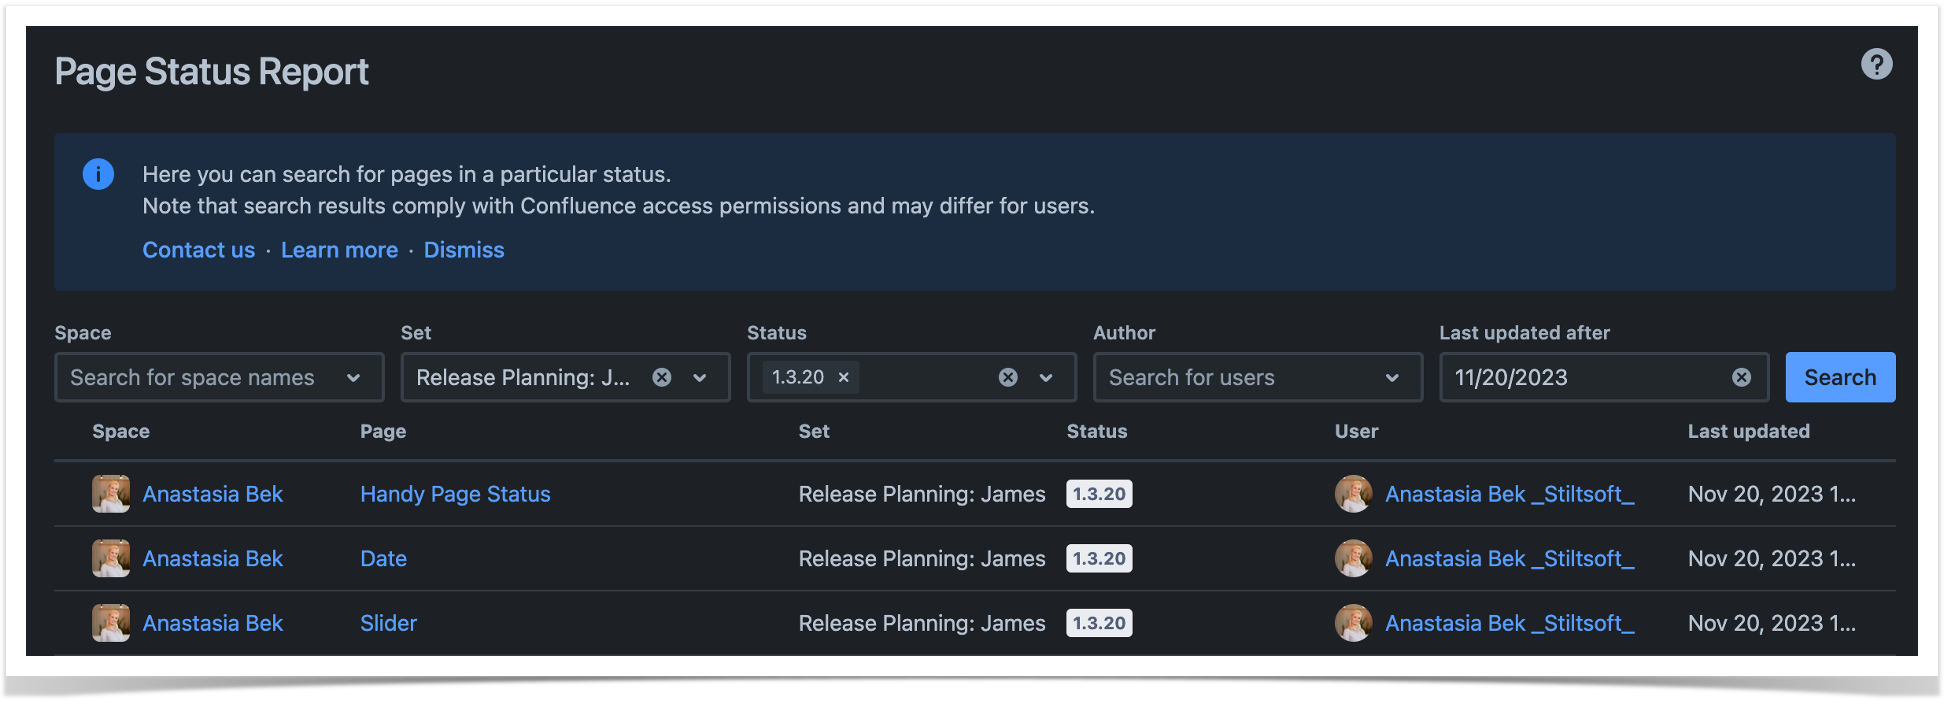
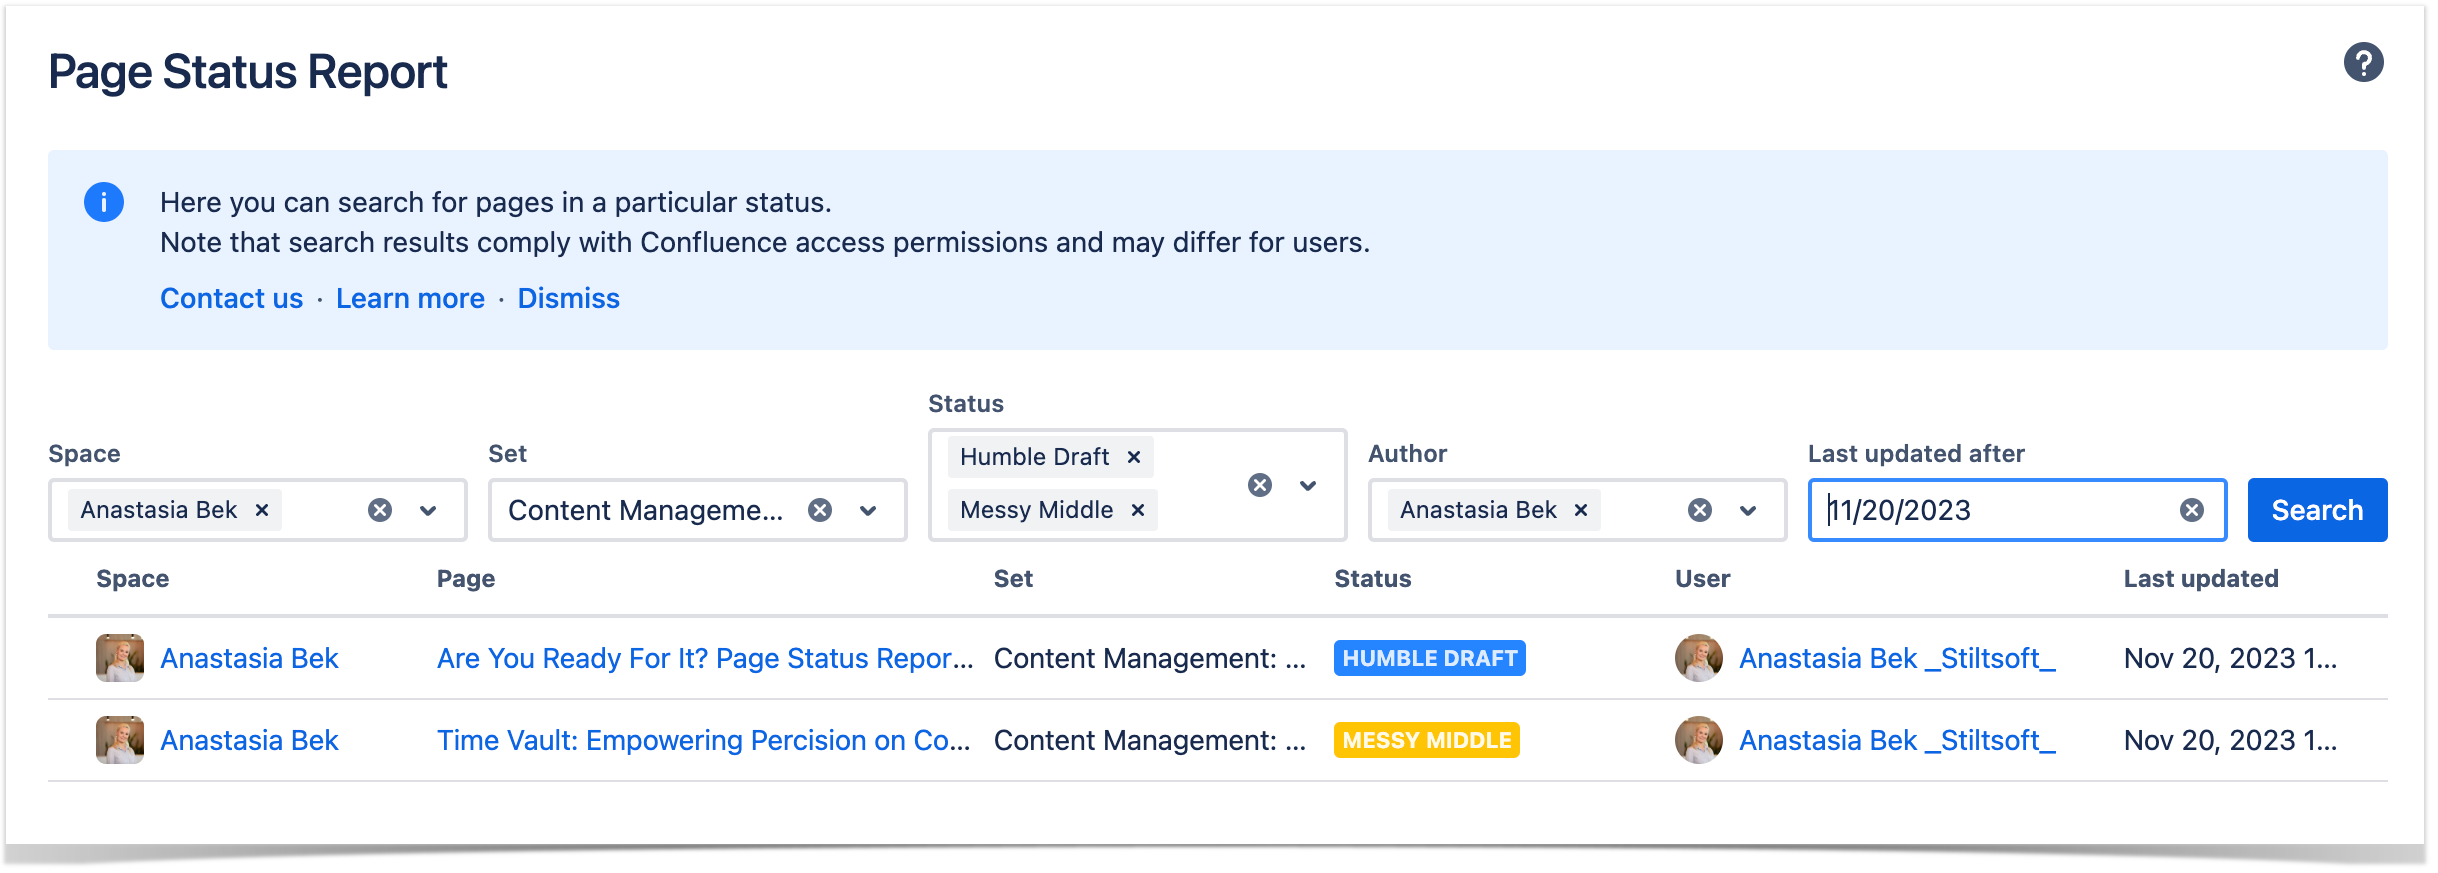
With multiple Confluence pages actively and dynamically worked on, it is essential to silence the noise and focus on the priority task. James’ priority task is to lock the upcoming release 1.3.20.  He also needs to communicate critical release information to all relevant stakeholders. For that, he chooses appropriate space and a particular Handy Page Status; James can make the report author-specific and filter for status updates done only after a specific date. Let’s say one of the developers promised to confirm the app version on or after a particular date. The result can look like this and be customized and elaborated even further.

Page Status Report comes in HandyThe view-mode page status updates and the ability to craft a custom report in a matter of a few clicks and seconds has a lot of benefits. James and his collaborators can review the critical data at a glance and focus on the issues at hand. This saves the team a lot of time and enhances overall productivity, autonomy, and collaboration in their workflows.
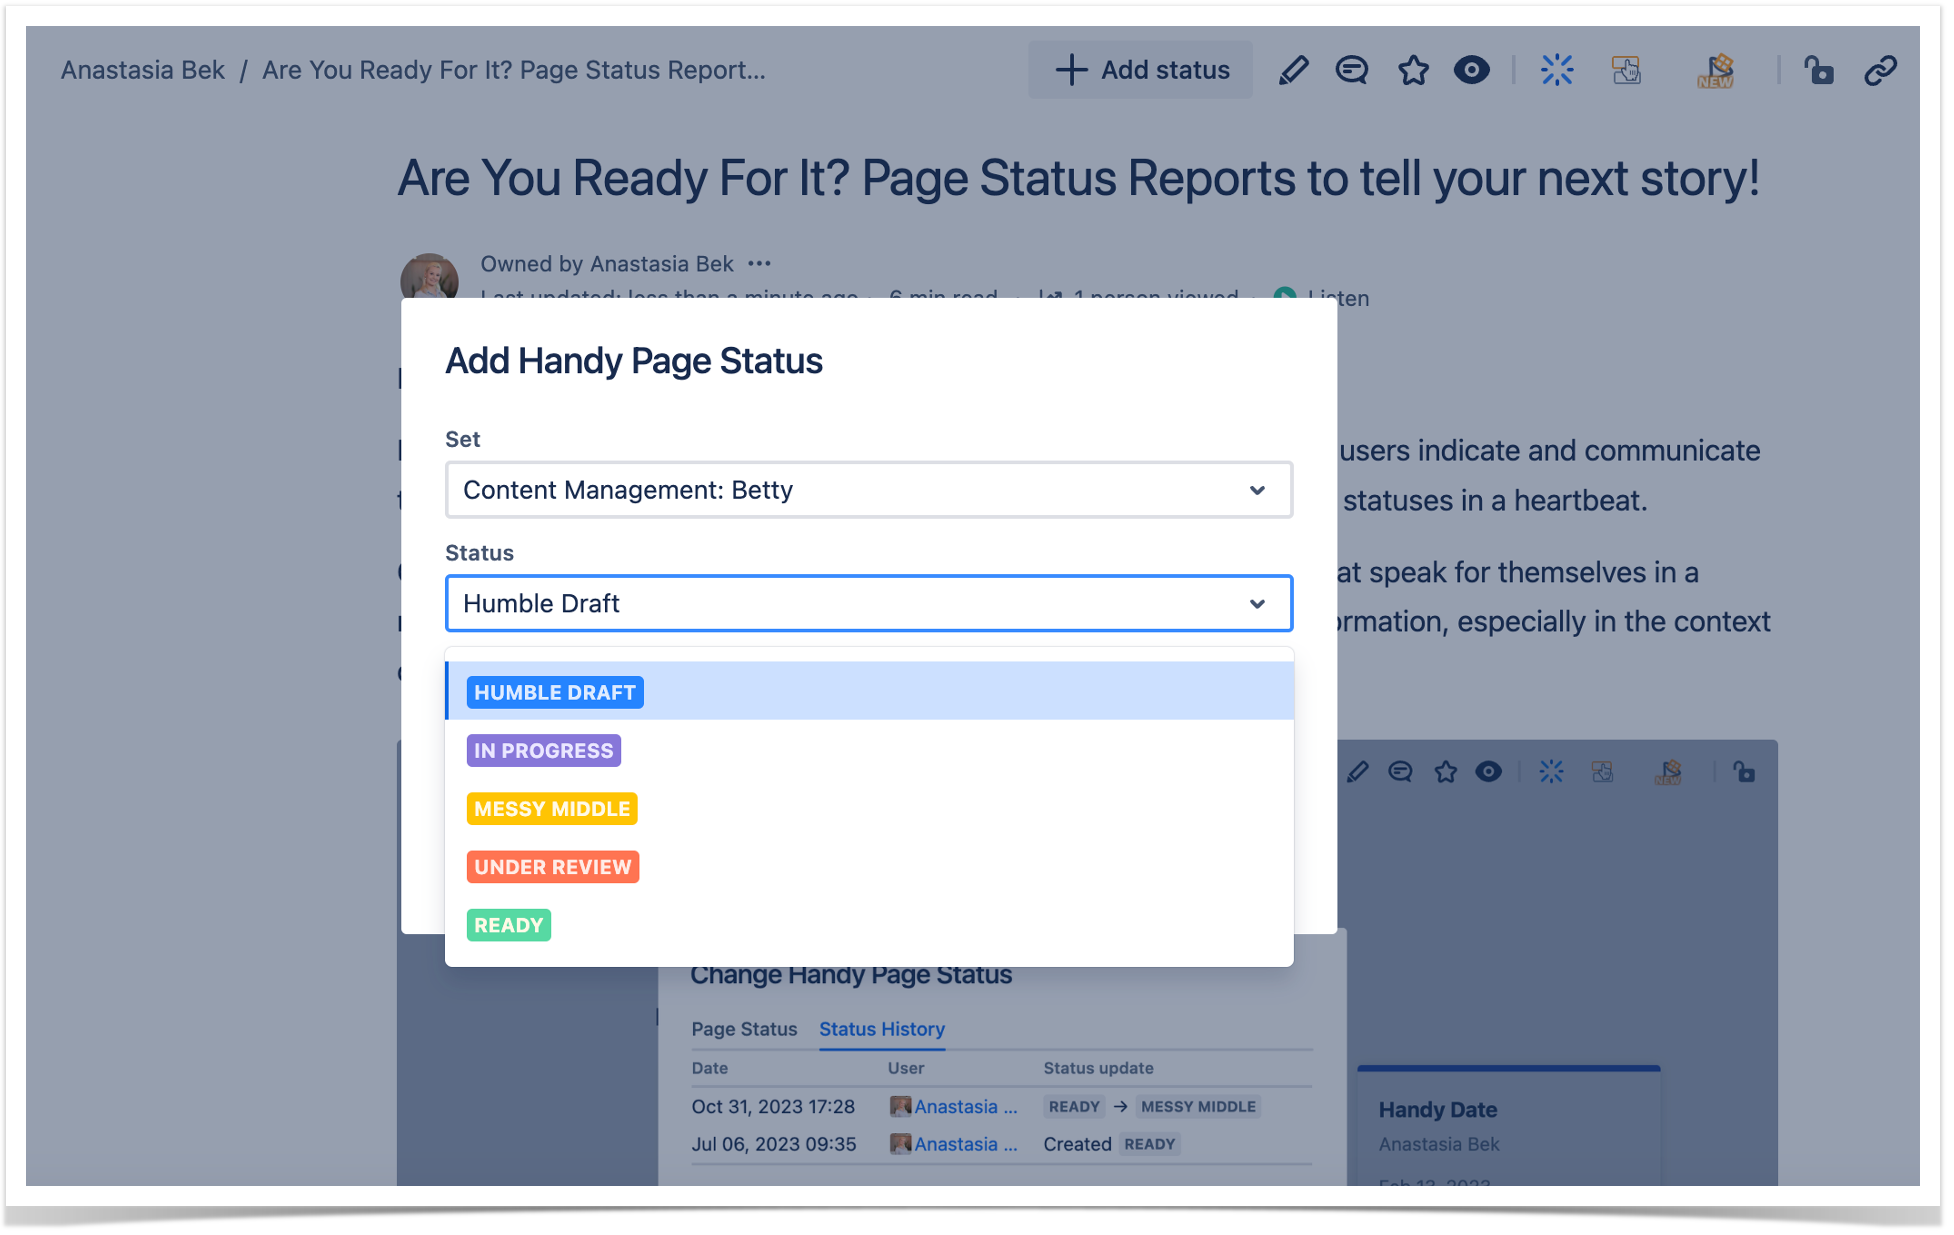

Facilitate Content Writing: Betty’s Case

Writer’s block and fear of the blank space can be scary. Betty sees Handy Page Status as a game-changer (and a lifesaver). Often, the root cause of her writer’s block is that the feedback on the working piece is given well in advance while still being a work in progress. So, Betty invented her superheroes in the form of Handy Page Status to avoid the frustration associated with the feedback given well in advance by indicating clear expectations on the pages. And if you’re asking if she has a favorite page status, a ‘MESSY MIDDLE’ is Betty’s favorite.

Betty’s collaborators and readers love the new workflow as well. They know that while it is interesting to witness the process or see how the messy middle evolves, they’re invited to the party only when the ‘UNDER REVIEW’ and ‘READY’ page status is indicated.Facilitate Content Writing

Humble Drafts and Messy Middles are good, but those are also the ones that need a check-in or clean-up. How many of those does Betty have? What can be done about the ones in those states? And what if Betty needs to review her work only in a particular space after today? For this case, use the Handy Page Status report with the required search parameters.Handy Page Status Report data

With this solution and specific spaces for which Betty writes content, Betty can locate her not-so-work-in-progress items and see what can be done about them with just a few clicks. She is also having her superhero moment because now she needs to browse only through the Handy Page Status Report data vs. looking through her notes/manually exploring Confluence pages. Besides, her colleagues benefit a lot from the report. Everyone can see what’s new and ready to be read in the Blog space regularly without getting ‘content dupes’. Here the Last updated after field can help them with that even if they like only to read fresh blog updates each Friday.

Closure

Betty and James work in different departments, and their daily workflows are different, too. Still, they are impressed with the diversity and customization opportunities of Handy Page Status and Page Status Report functionalities. Moreover, Betty and James are eager to spread the word to the other teams who can benefit from incorporating the opportunities into different fields like project management or documentation review.

You can check out the Handy Page Status Management in action by trying it out in Confluence Cloud to see how you and your team can benefit from it. Feel free to check out Handy Macros for Confluence at the Atlassian Marketplace to see if this app can be a good fit for your needs and use cases.

How to Ace Employee Certification in Atlassian Confluence

April 14, 2023
#How To#Confluence#Learning Management
6 min

Today companies that invest in employee training open the door to new business opportunities and are more attractive to their potential workforce. These organizations need a way to check the level of skills, experience and expertise of their employees on a continuous basis. Some choose professional certification for that. While it is required for certain professions (doctors, pilots, emergency medical technicians, for example), many employers turn to professional certification voluntary. Why? Here are some of the reasons:

  1. Certified employees prove that they have what it takes to be effective making their employer feel more confident
  2. Personal sense of achievement fuels individual’s drive to work even better and harder
  3. Improved skills enable staff to undertake a greater variety of work
  4. Credibility boost in the eyes of company’s clients when its workers stay up-to-date on the hottest trends in their industry
  5. Successful certification may result in income and/or status increase both for the employee and the organization
  6. Companies need a way to identify knowledge gaps reducing potential risks, especially in critical areas such as safety
  7. We all love being rewarded, after all

There are plenty professional certifications provided by professional societies and associations, as well as companies (such as Google, IBM, Microsoft, Cisco, Amazon, Salesforce, etc.) interested in raising industry standards. In addition to going with third-party certifications, you can create your own internal ones. They are likely to have less credibility for clients compared to third-part certifications, but will be most relevant covering your unique processes, requirements and best practices.

In this blog, we will tell you more about internal certification with and without training and will also highlight a way to check if your employees are ready to take a third-party certification.

Employee certification in Confluence

To prepare for internal or third-party certification you can:

  1. use a separate learning management system (LMS) to help employees engage with training content
  2. encourage your team to get ready on their own
  3. create training courses in Confluence

If your company uses Atlassian Confluence, you can organize internal certification or set up preparation to a third-party professional certification using izi – LMS for Confluence – create certification training courses and/or certification quizzes (tests). You can make training and certification more appealing for your team because they will use the platform they already know. All you need to do is to populate your Confluence with the proper materials to train and educate your team.

image2019 3 6 23 37 48

The izi LMS app offers various options to choose from when it comes to certification.

Internal Certification with Prior Training

Having all of the required information to get certified on hand in Confluence LMS will make everyone’s life a lot easier. This means that you can provide your employees with training and education right in Confluence.

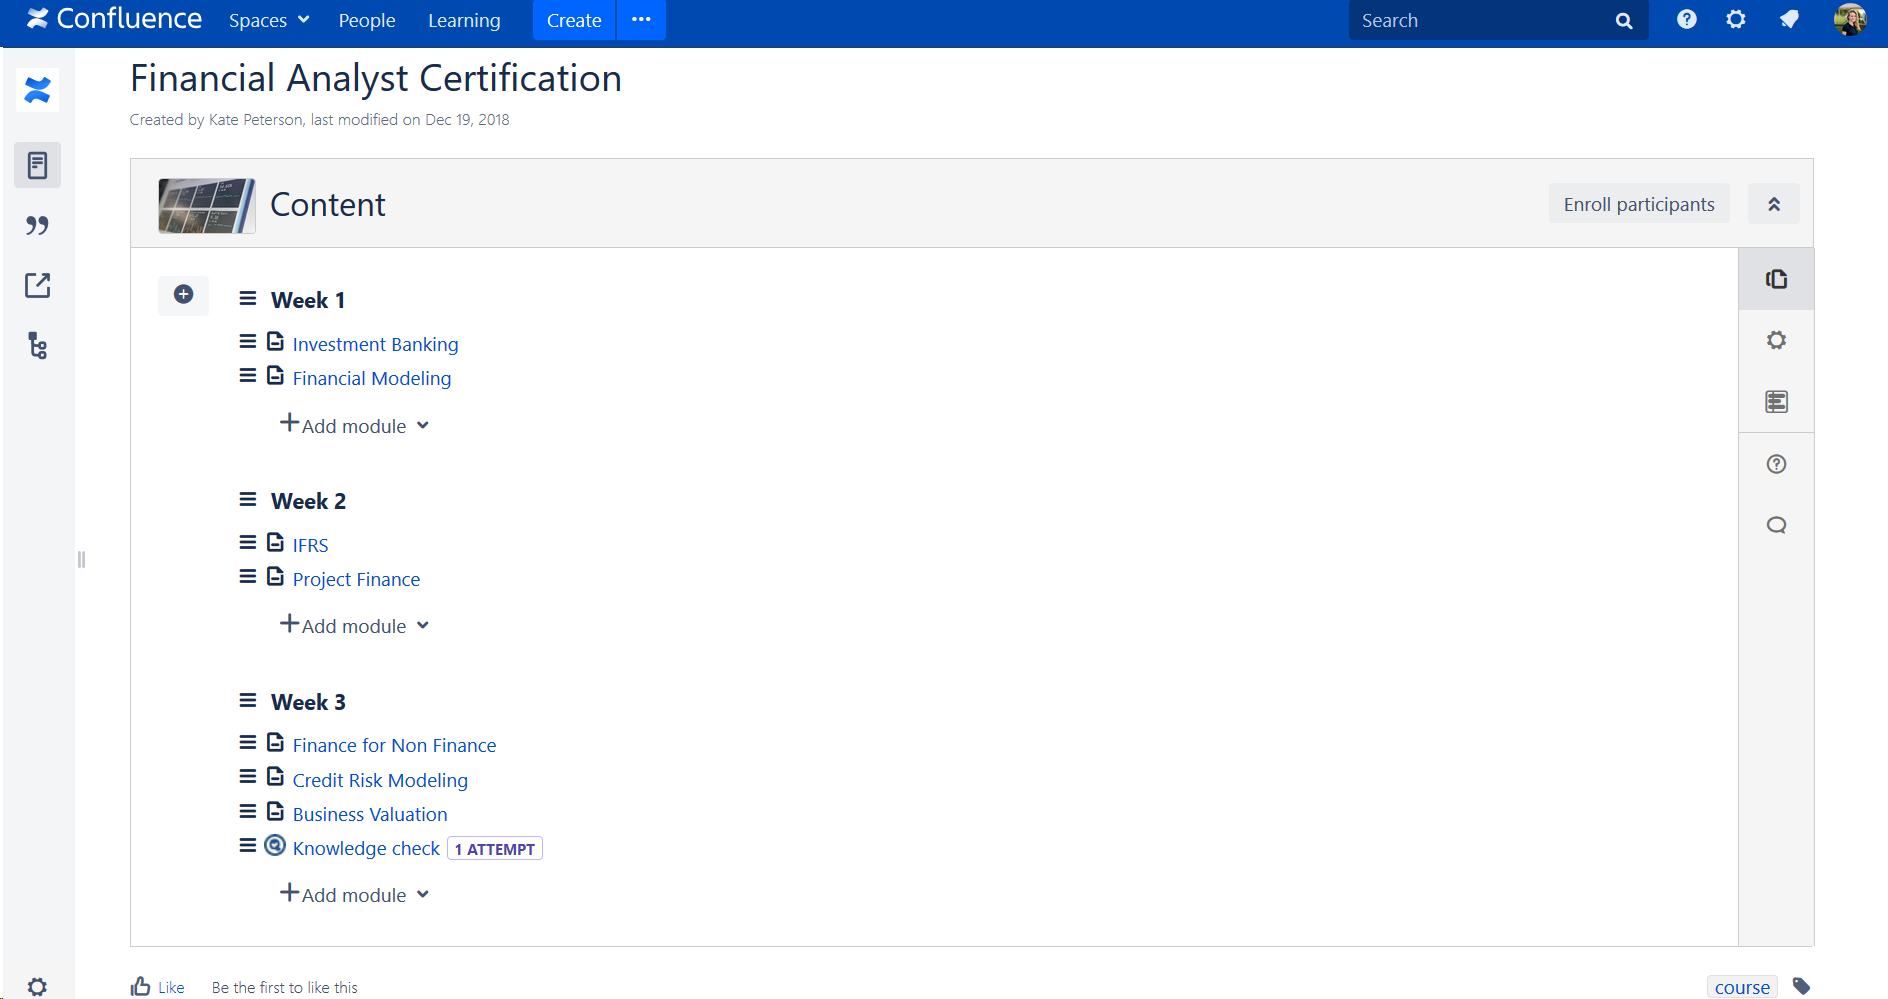
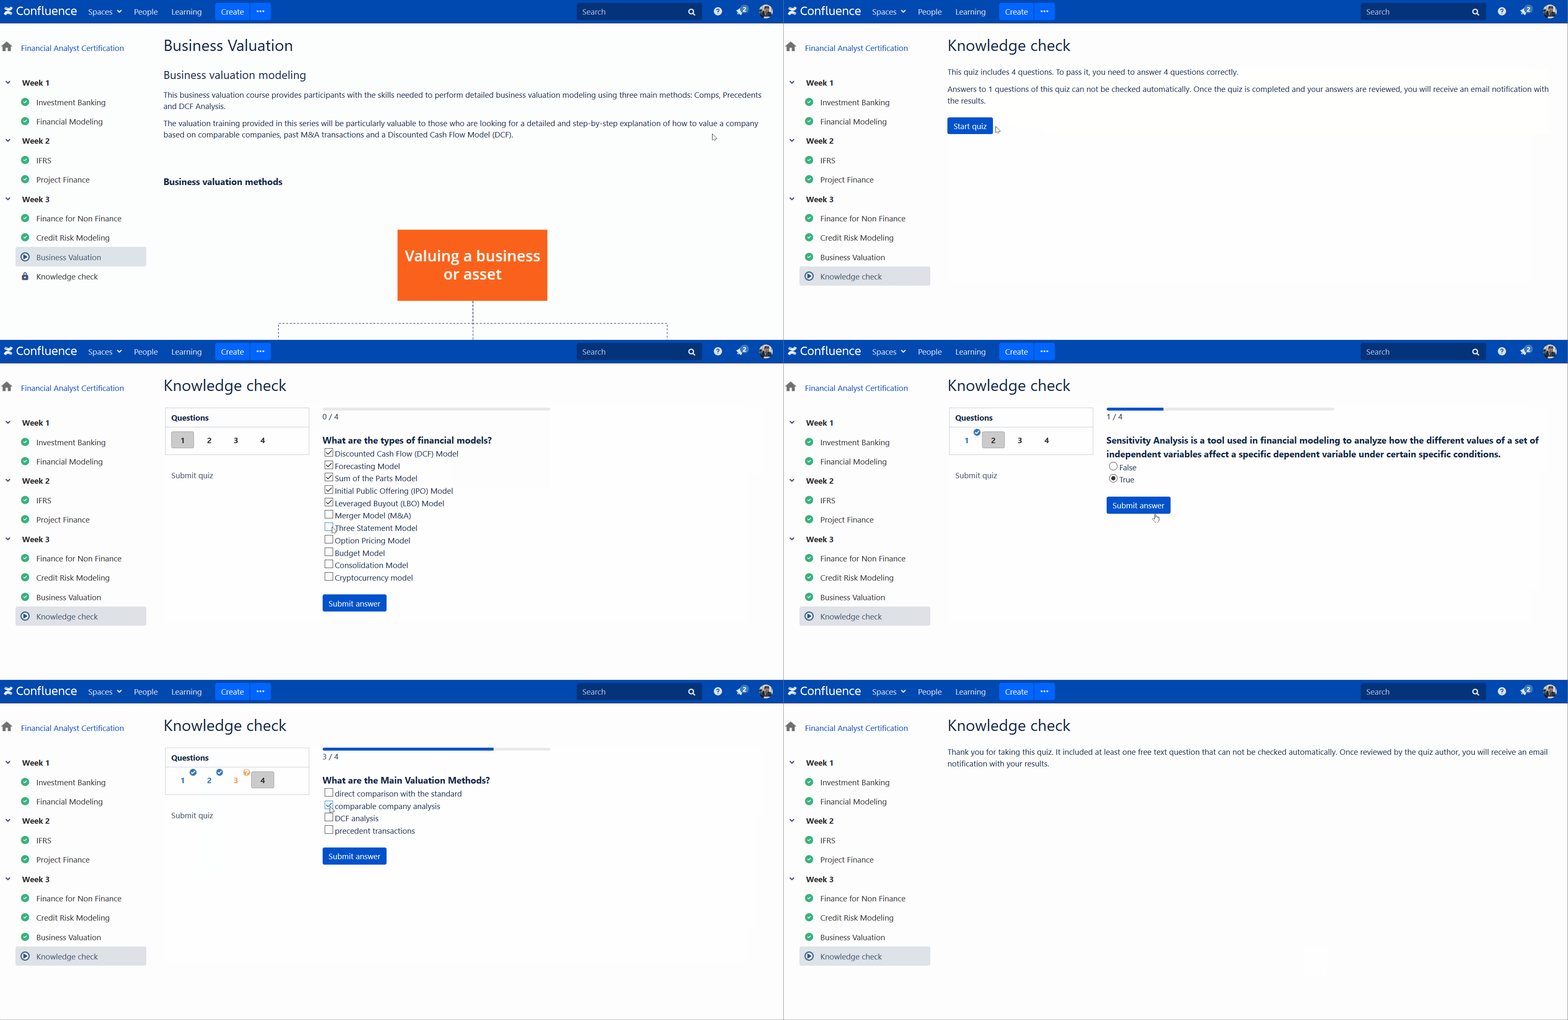
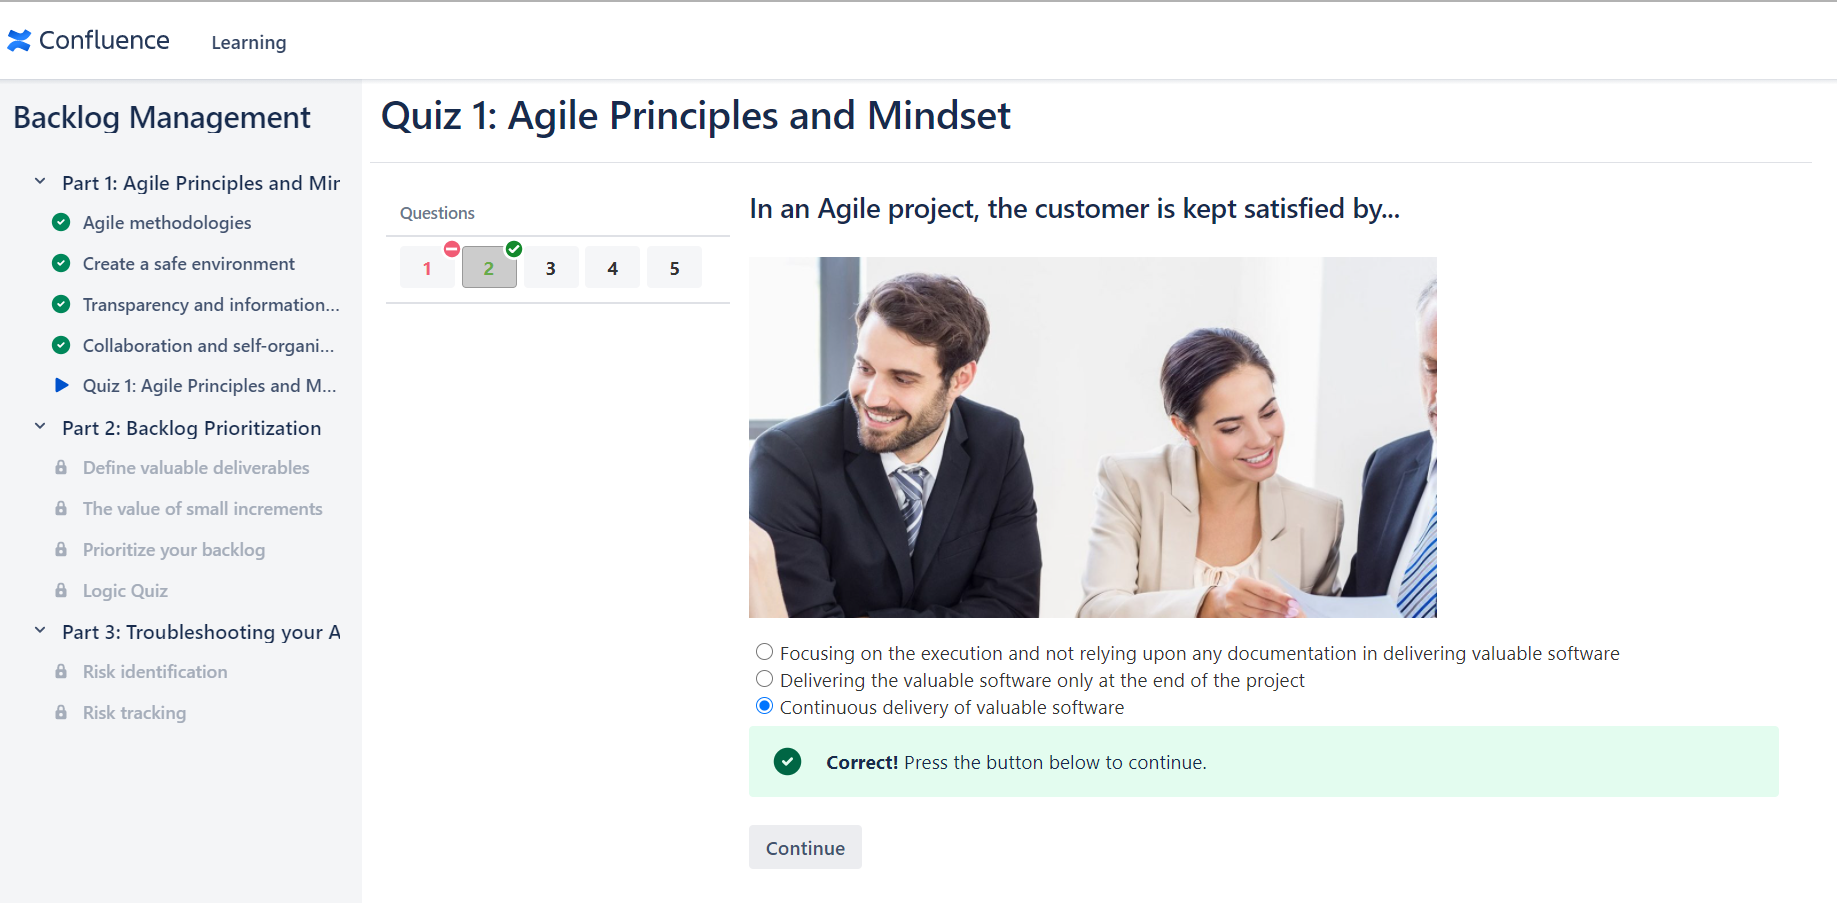
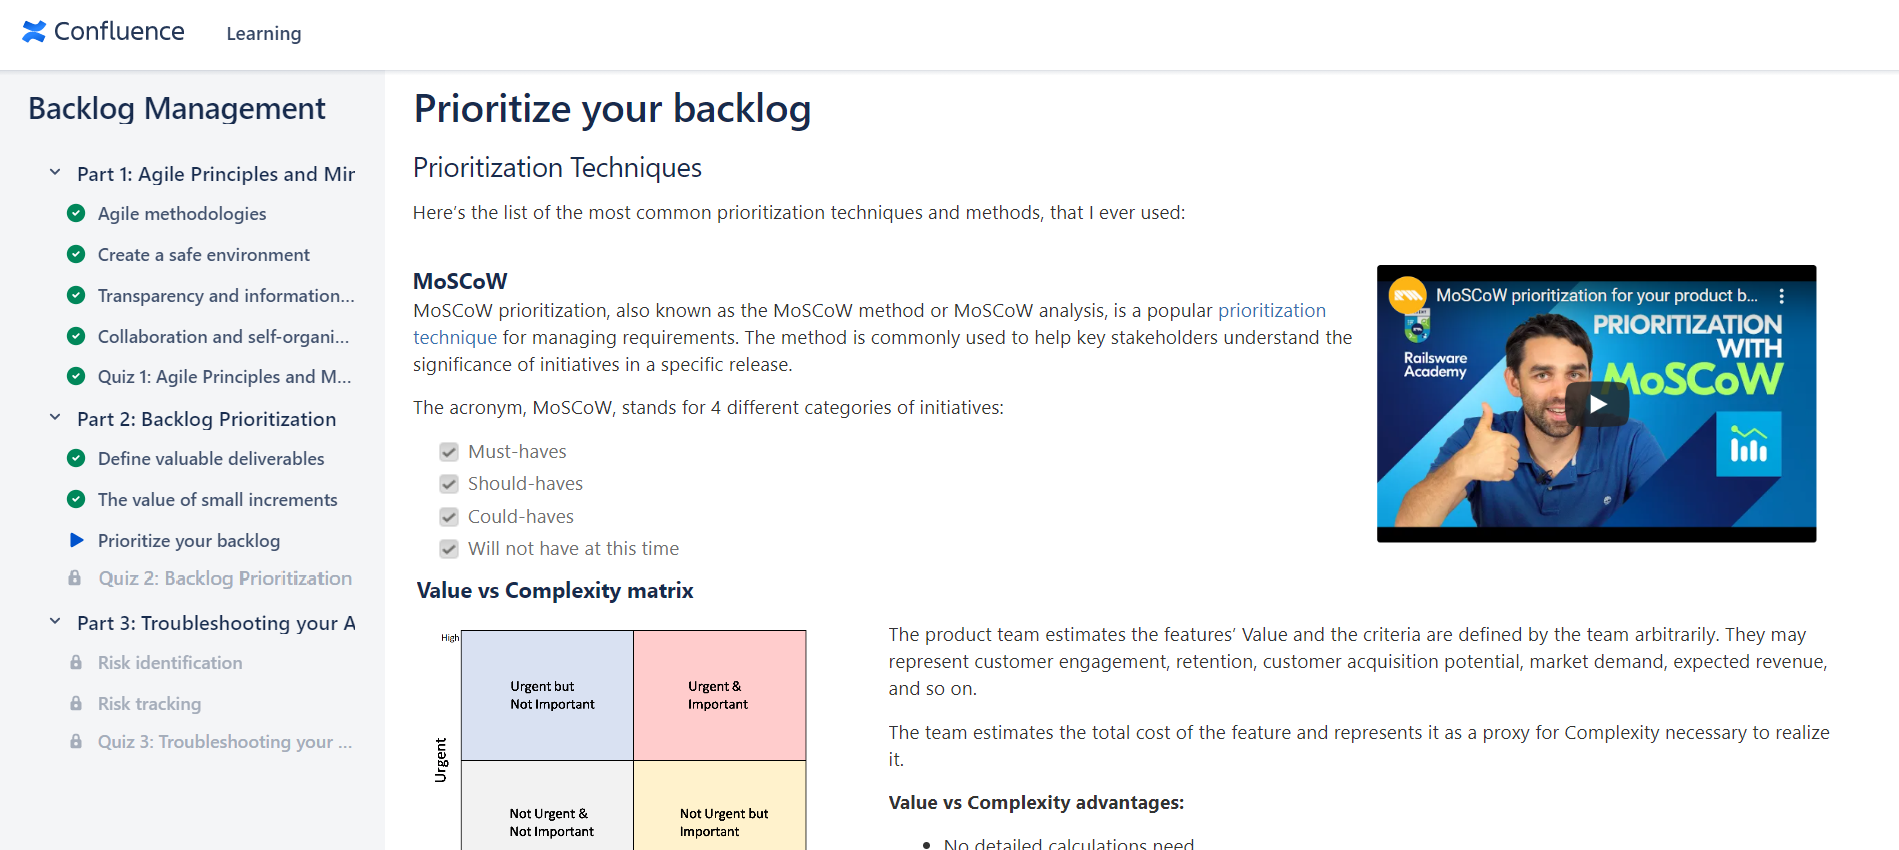
Your learning administrator can create a course with multiple modules divided by topics, time period, and more. The app also allows you to build self-check tests after each learning section to evaluate students’ knowledge. Or you can add only the final test every participant must take to complete the course and get certified. This way you can easily assess competences and skills of employees.

image2019 3 7 10 6 3

Your employees can train online at their own pace learning the information in each module.

certification

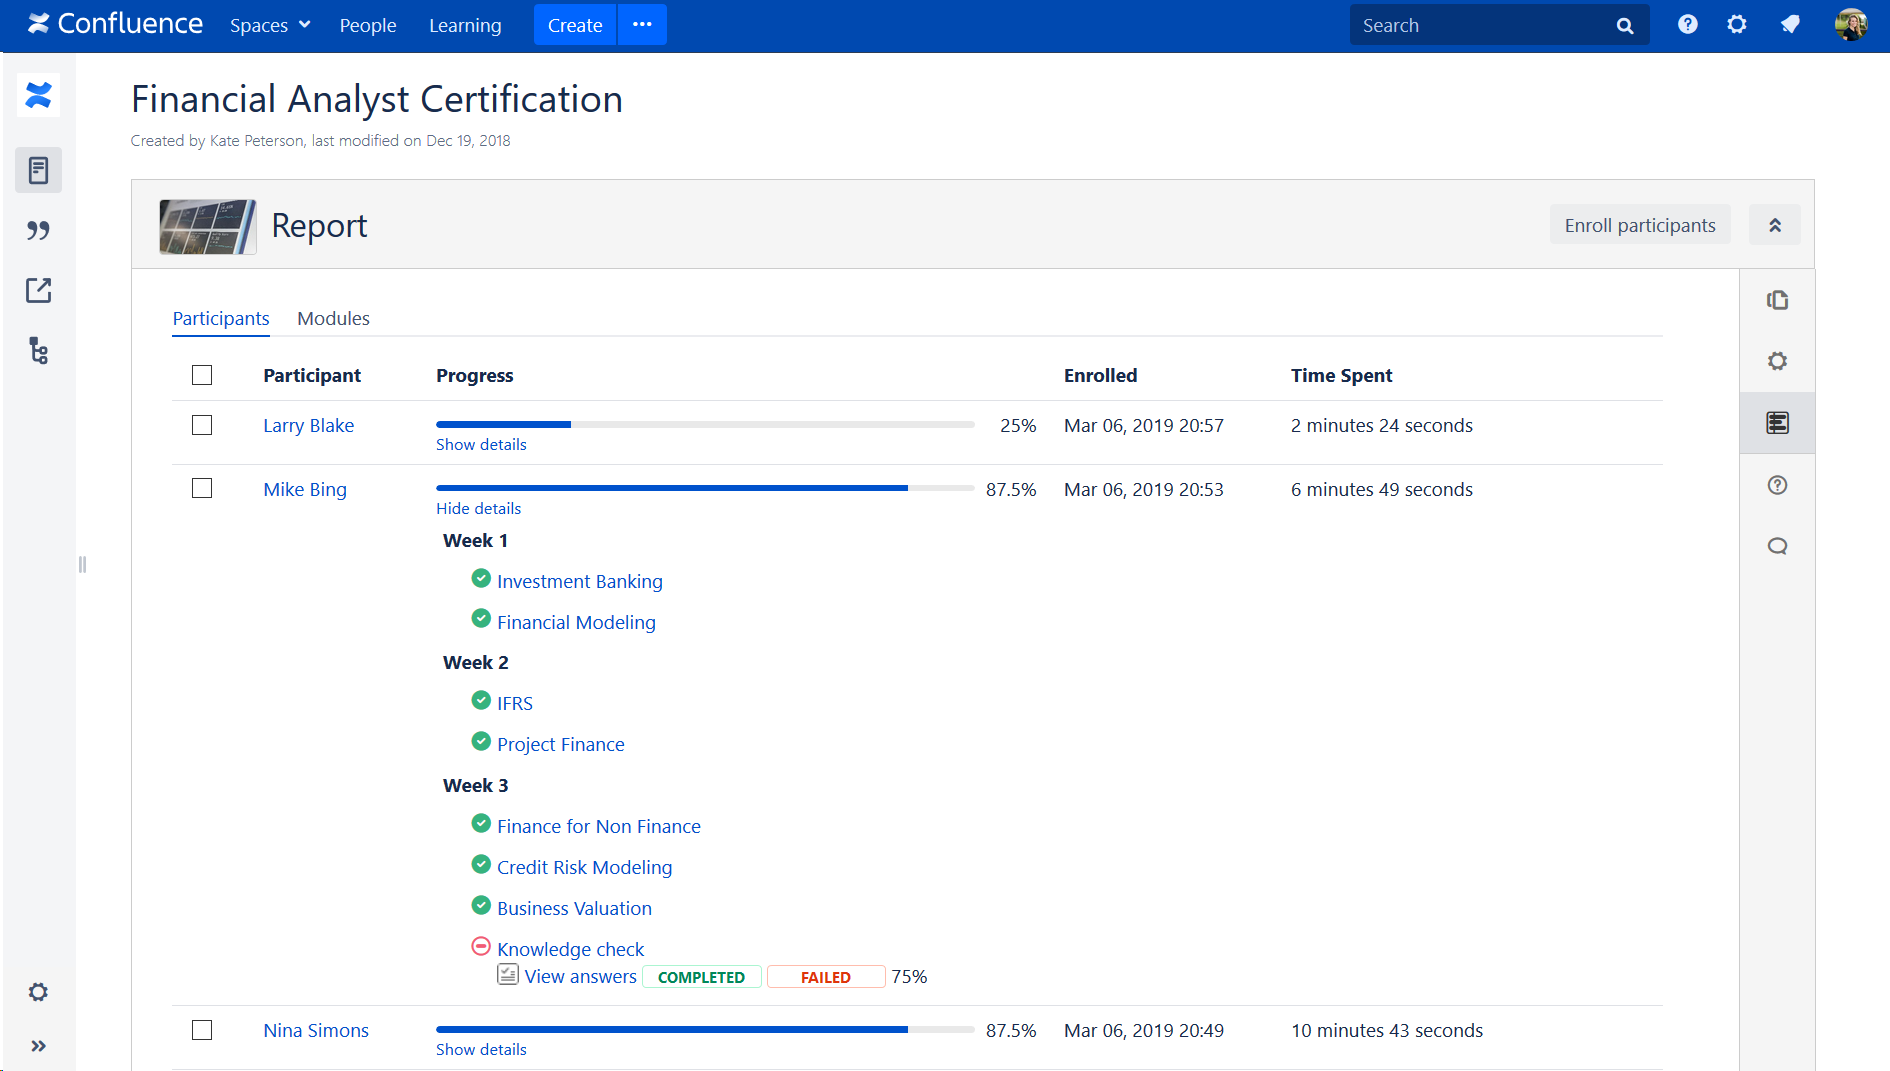
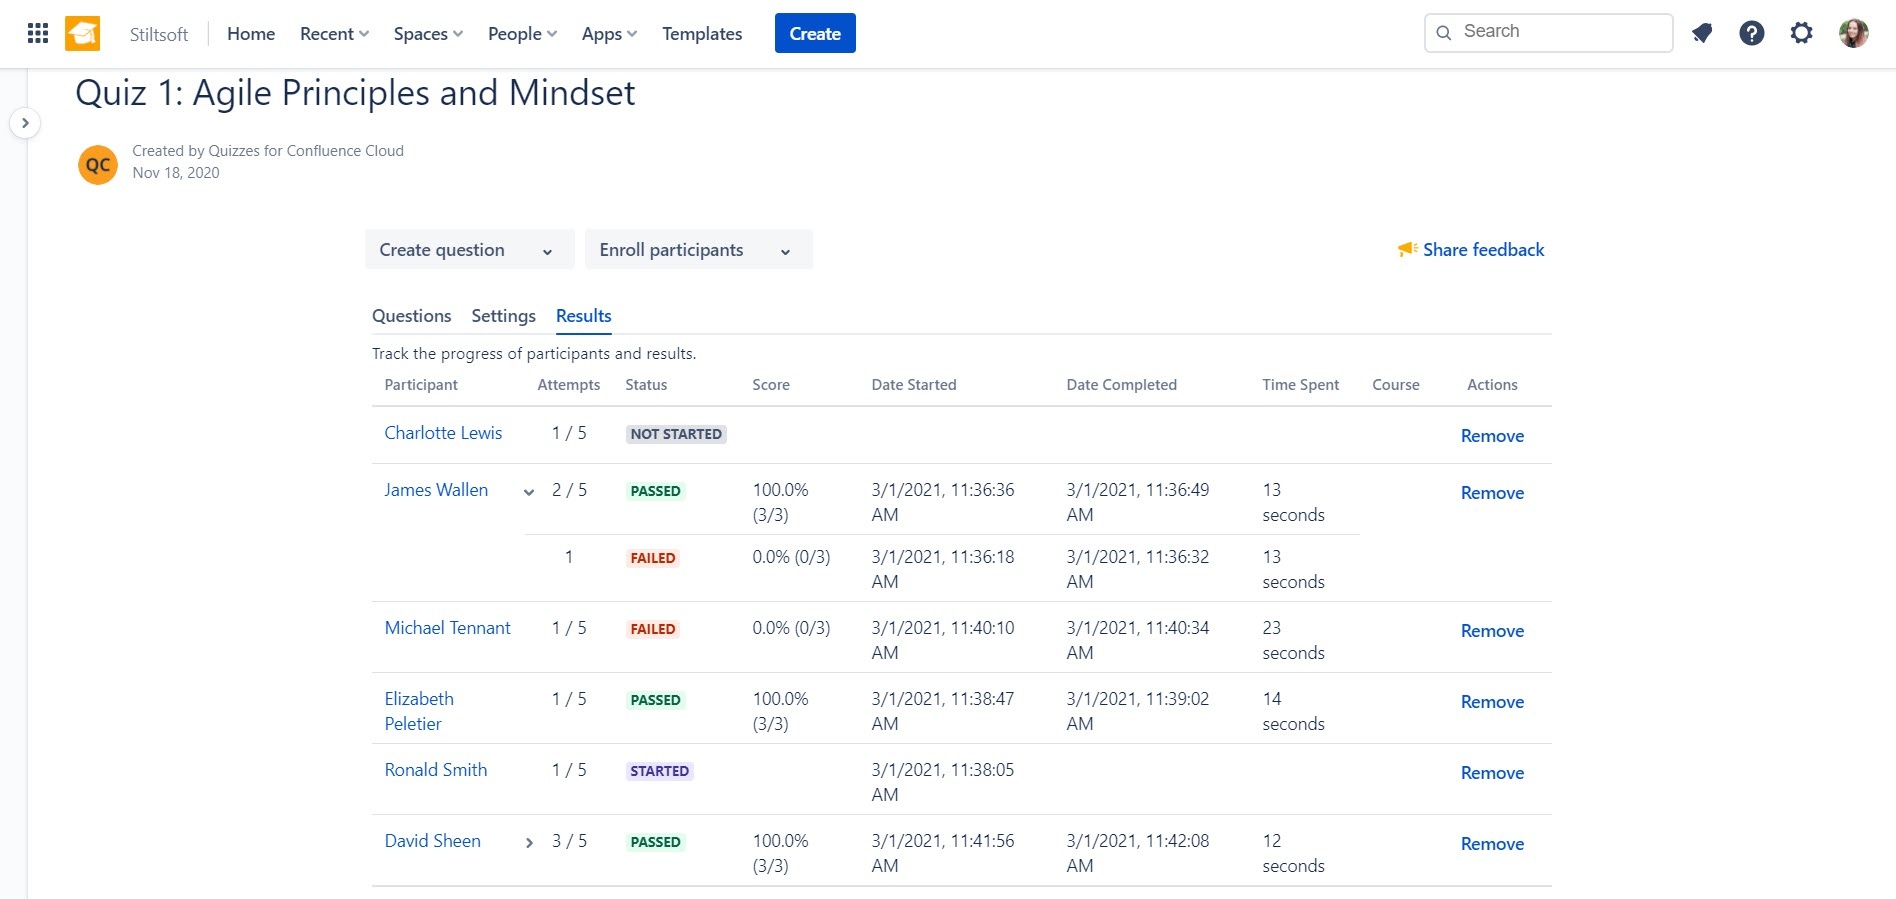
The course administrator can easily check the results of all the participants.

image2019 3 7 0 2 6

Internal Certification Test

Regular internal certification tests help you confirm that the individual possesses the experience and skills to perform a specific job or uncovers the lack of knowledge about an organization’s products, services, policies, safety practices etc.

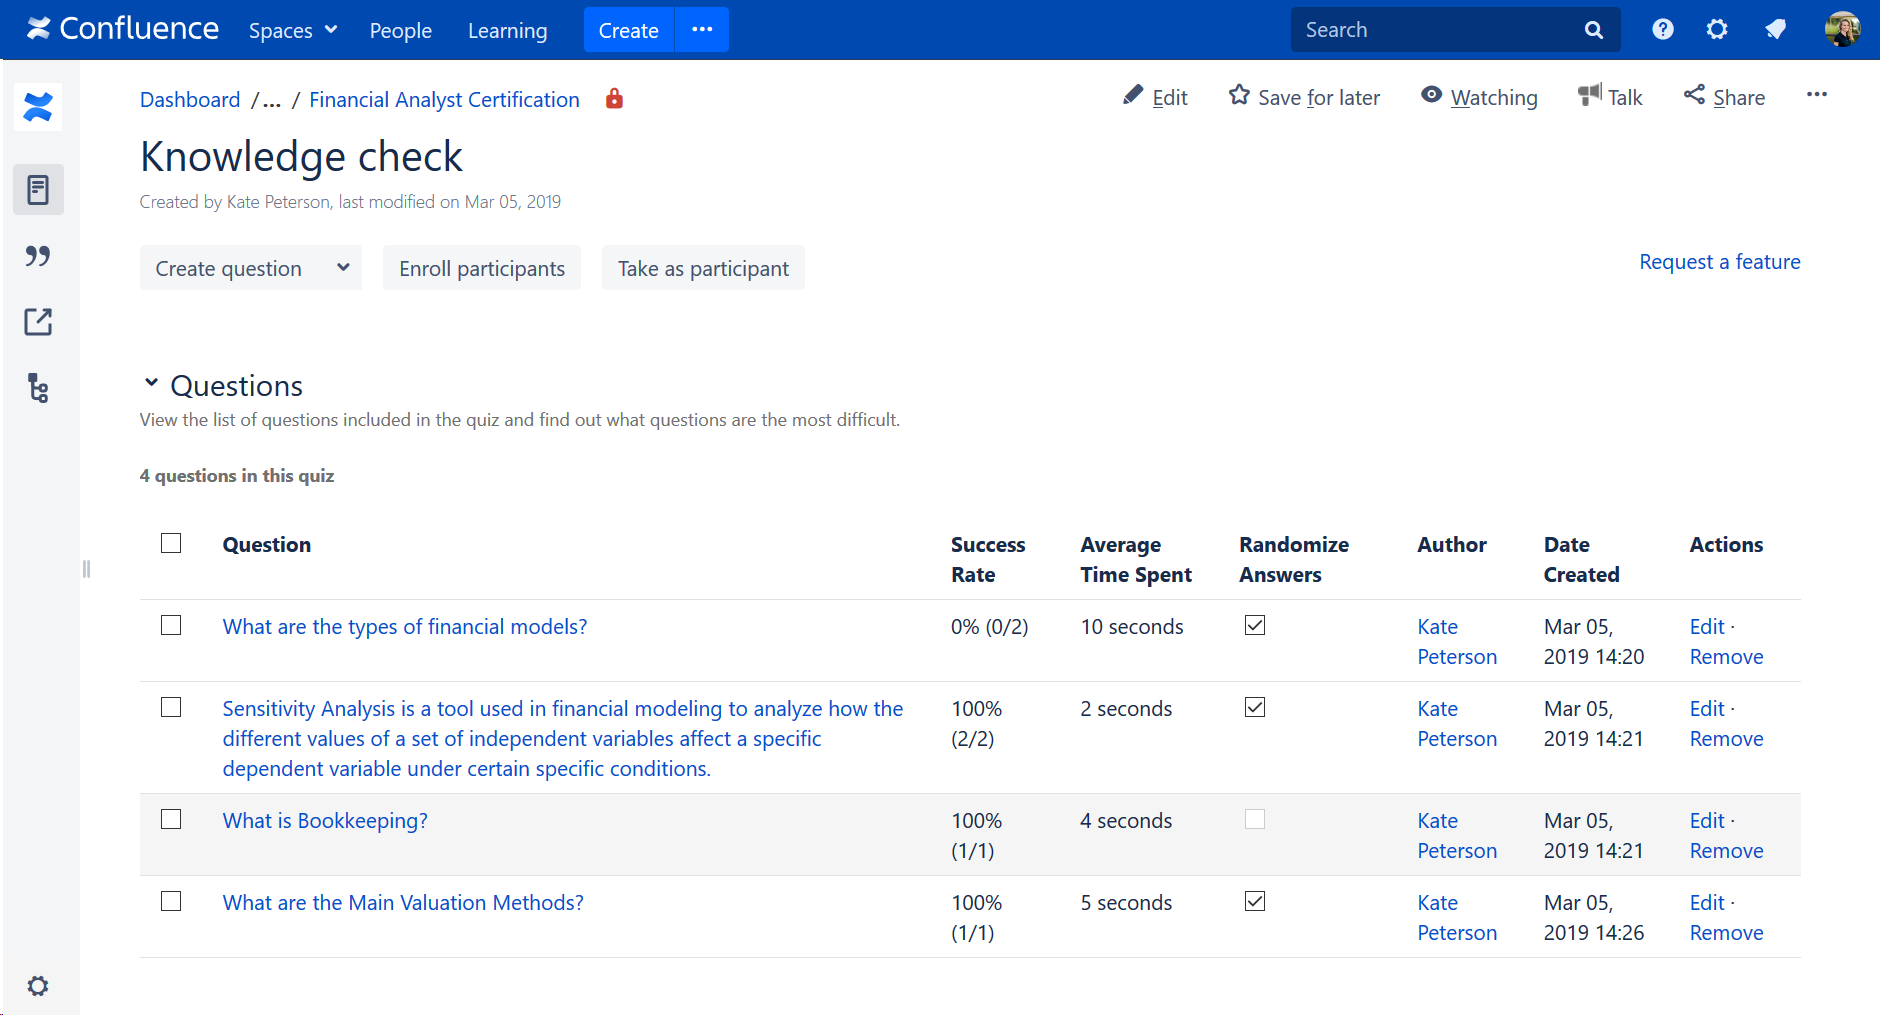
For internal certification tests that don’t require prior training, you can create quizzes (tests) using various types of questions. Moreover, you can reuse questions from other Confluence quizzes on related topics.

image2019 3 7 0 18 20

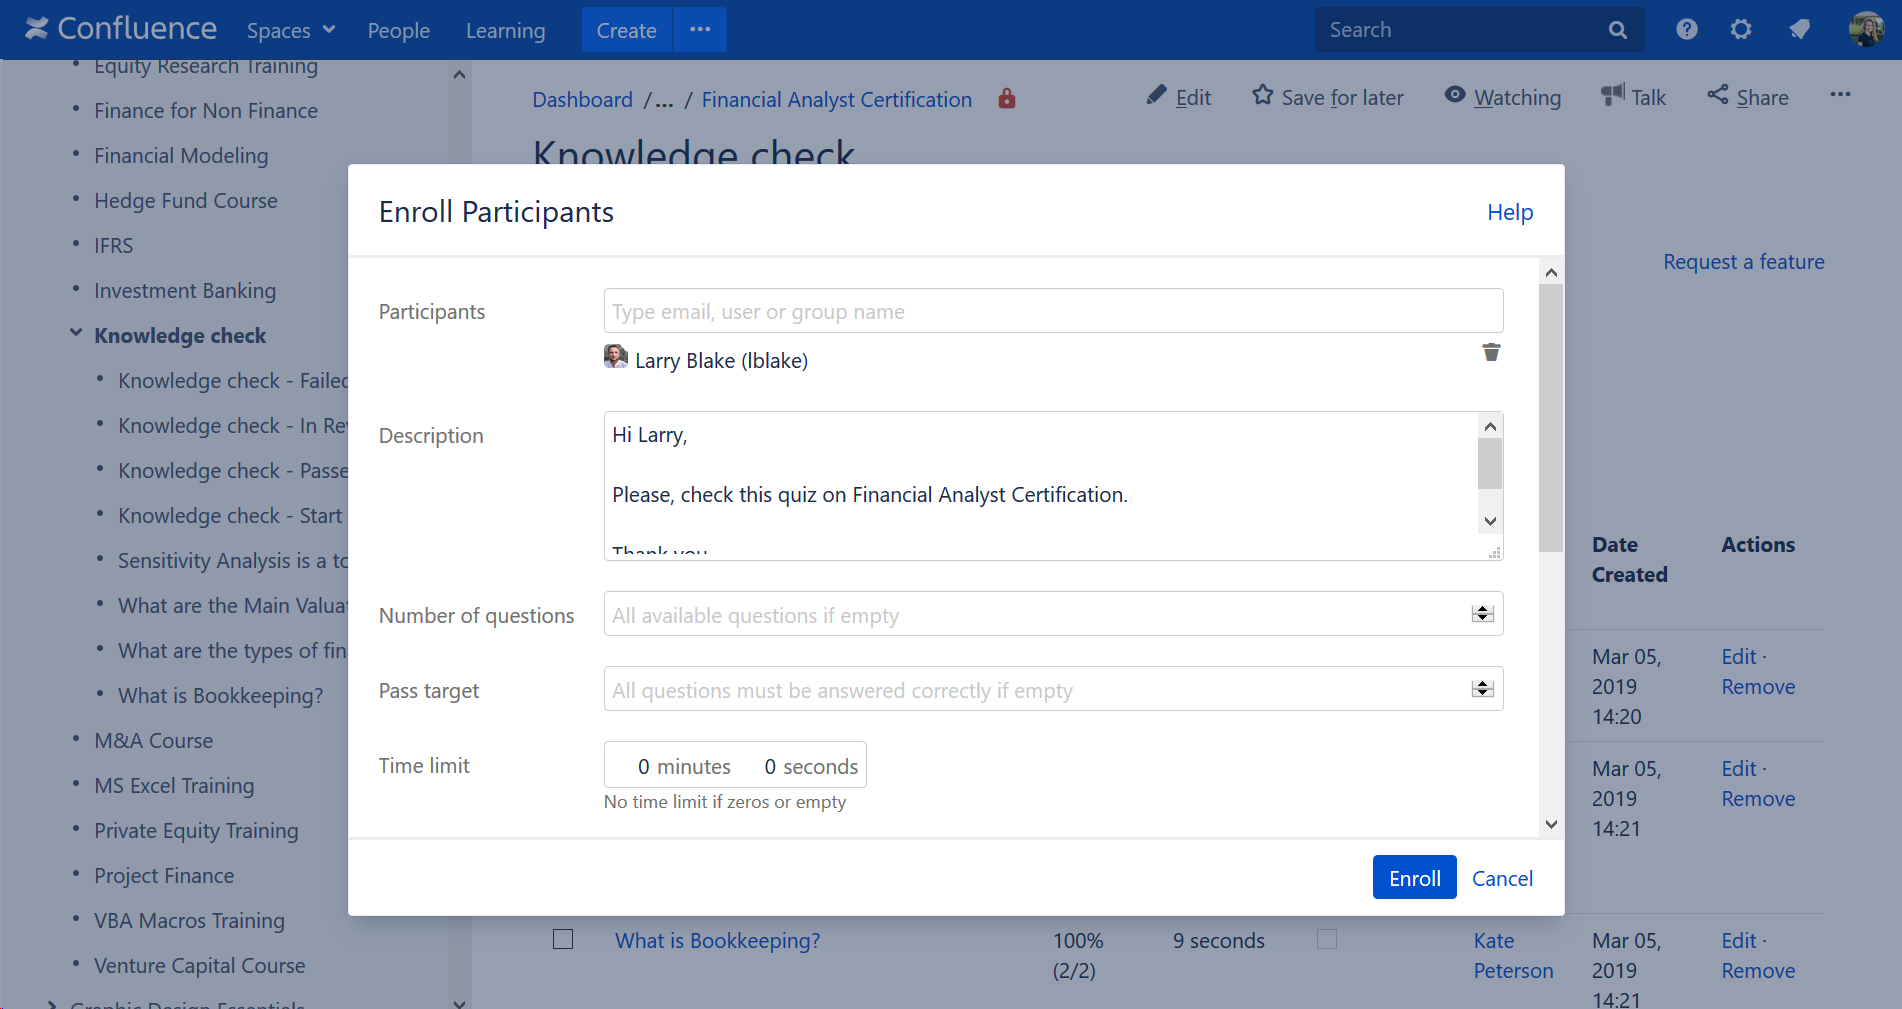
The izi LMS app allows you to easily enroll both Confluence users and people outside your system. This might be helpful when you need to certify people who are not working in your company.

image2019 3 7 0 24 38

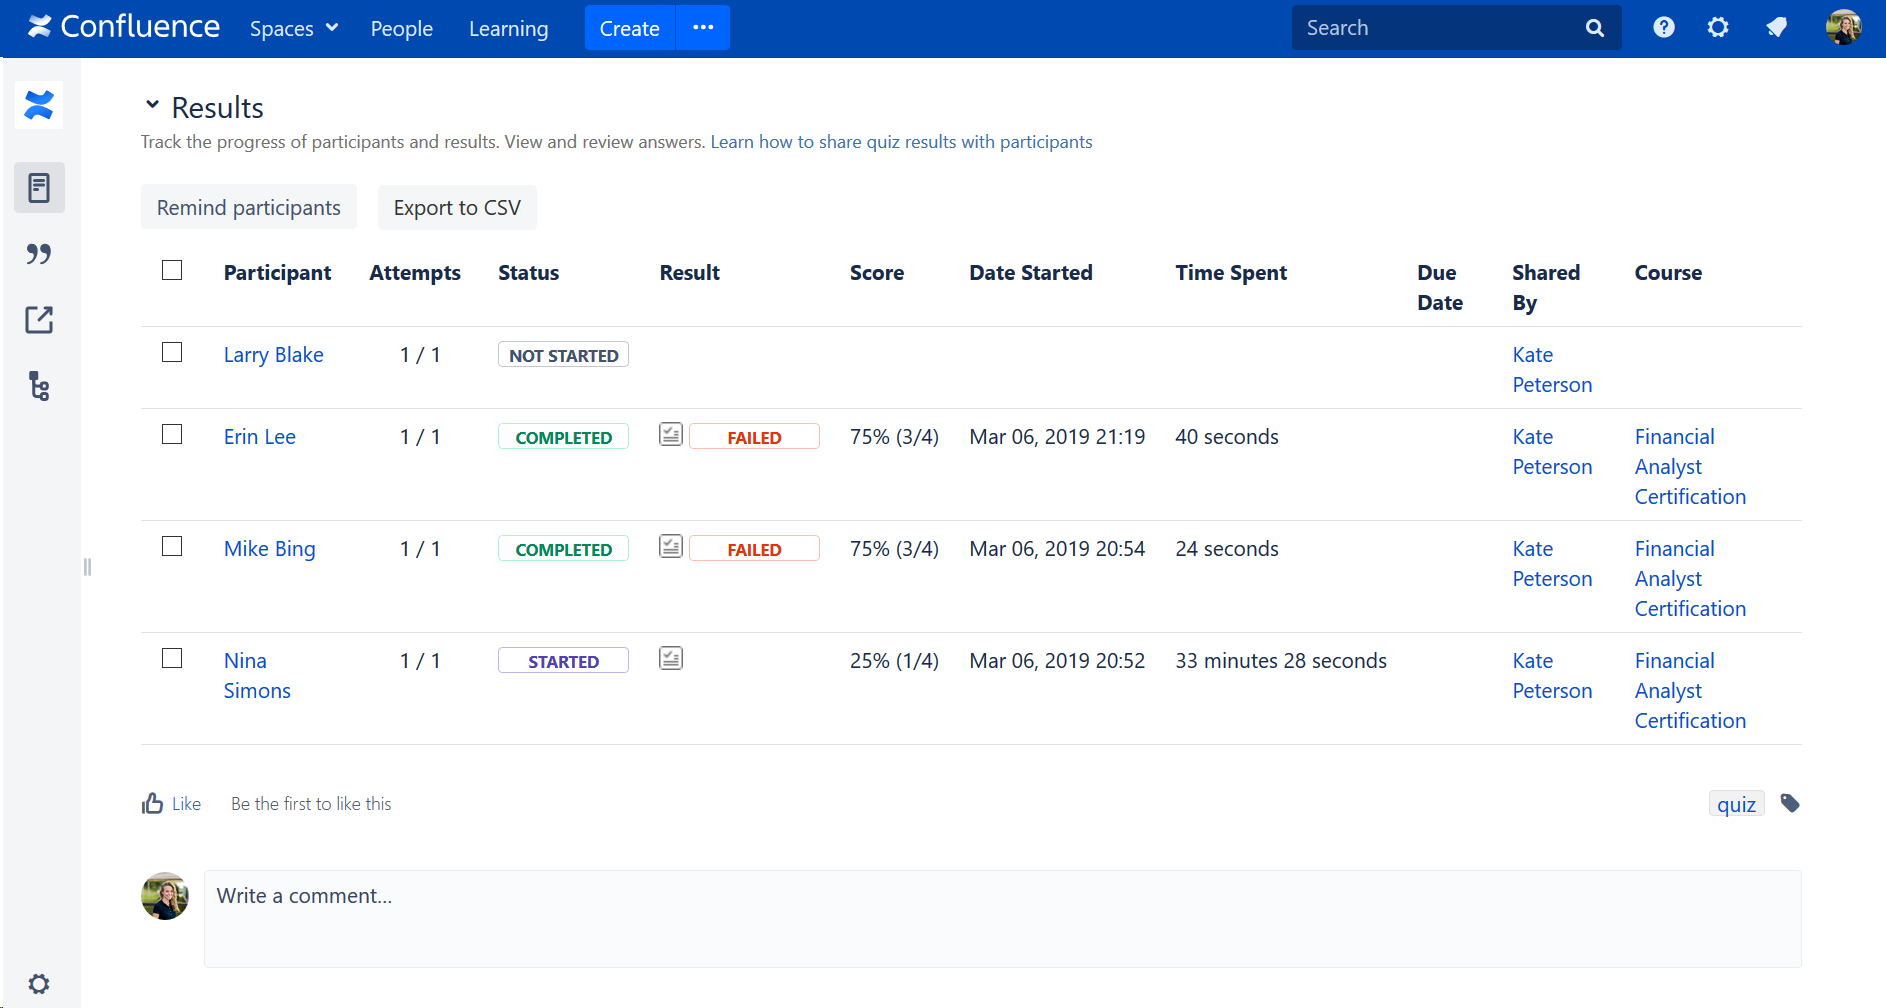
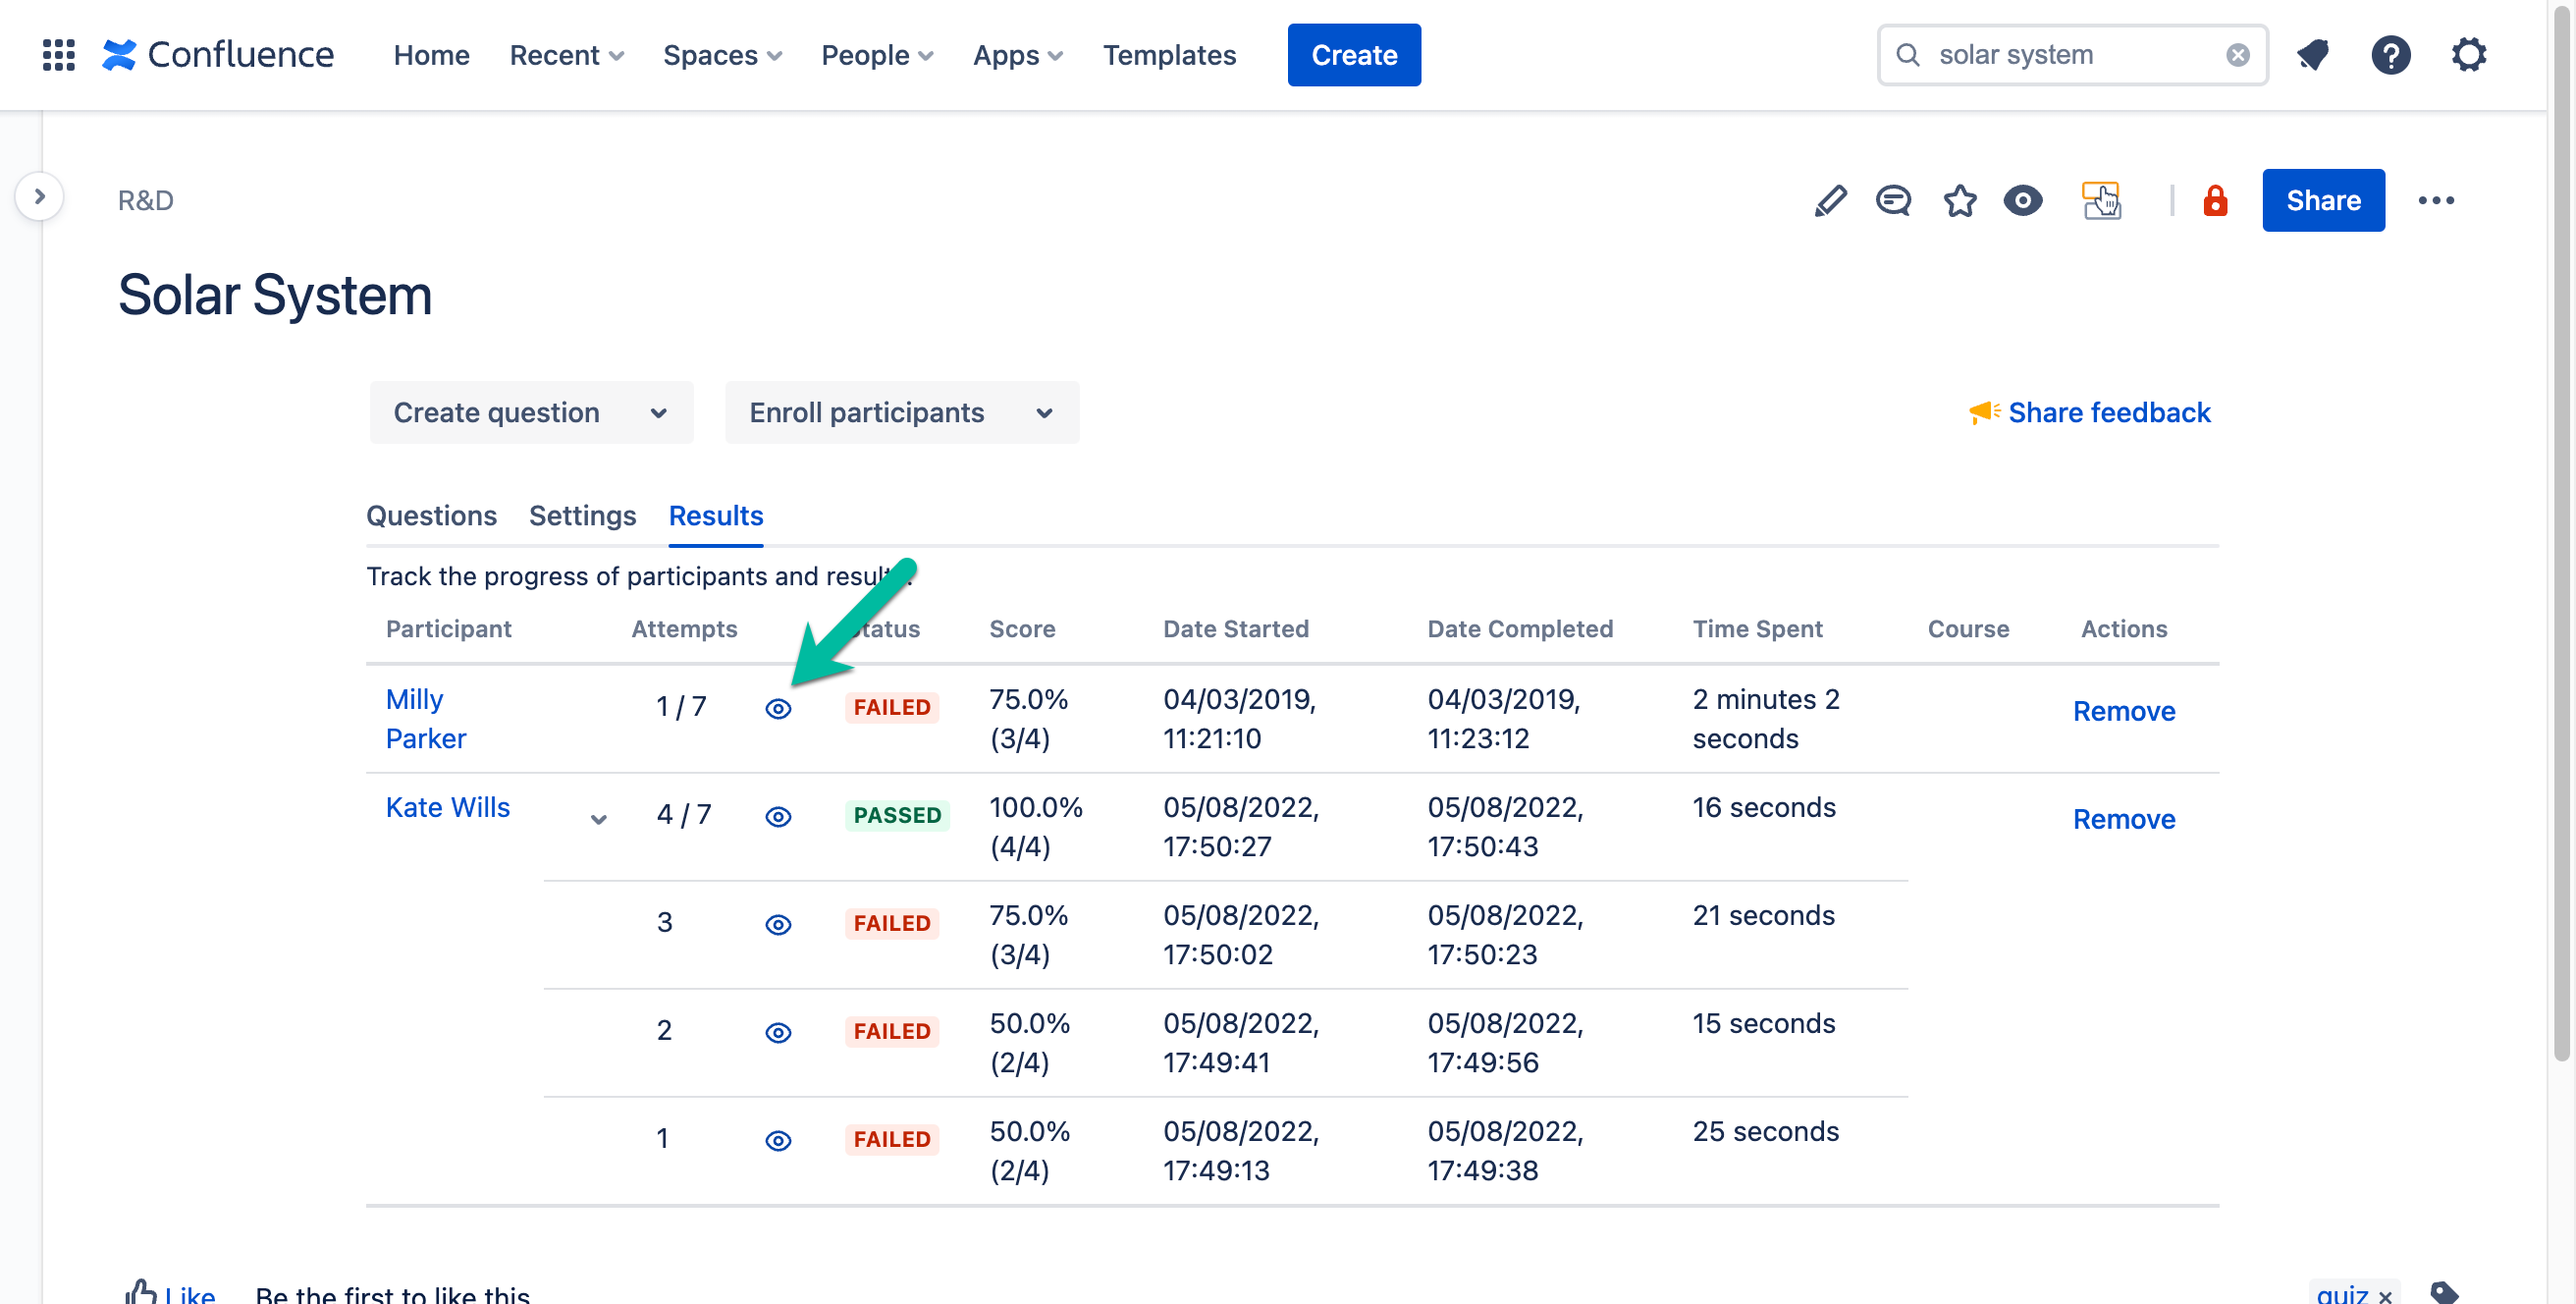
You can track the certification progress of your employees checking how each participant did and the score each person got.

image2019 3 7 0 26 52

This way you can see the status of all their certifications and training requirements in one place.

Readiness Check for Third-Party Certification

As a manager, you need to keep an eye on anything that might impact the process of employee certification. So in case another company certifies your team members, it is better to check onsite if your employees are ready to get certified. This way you can save company’s time and money and certify only well-trained personnel.

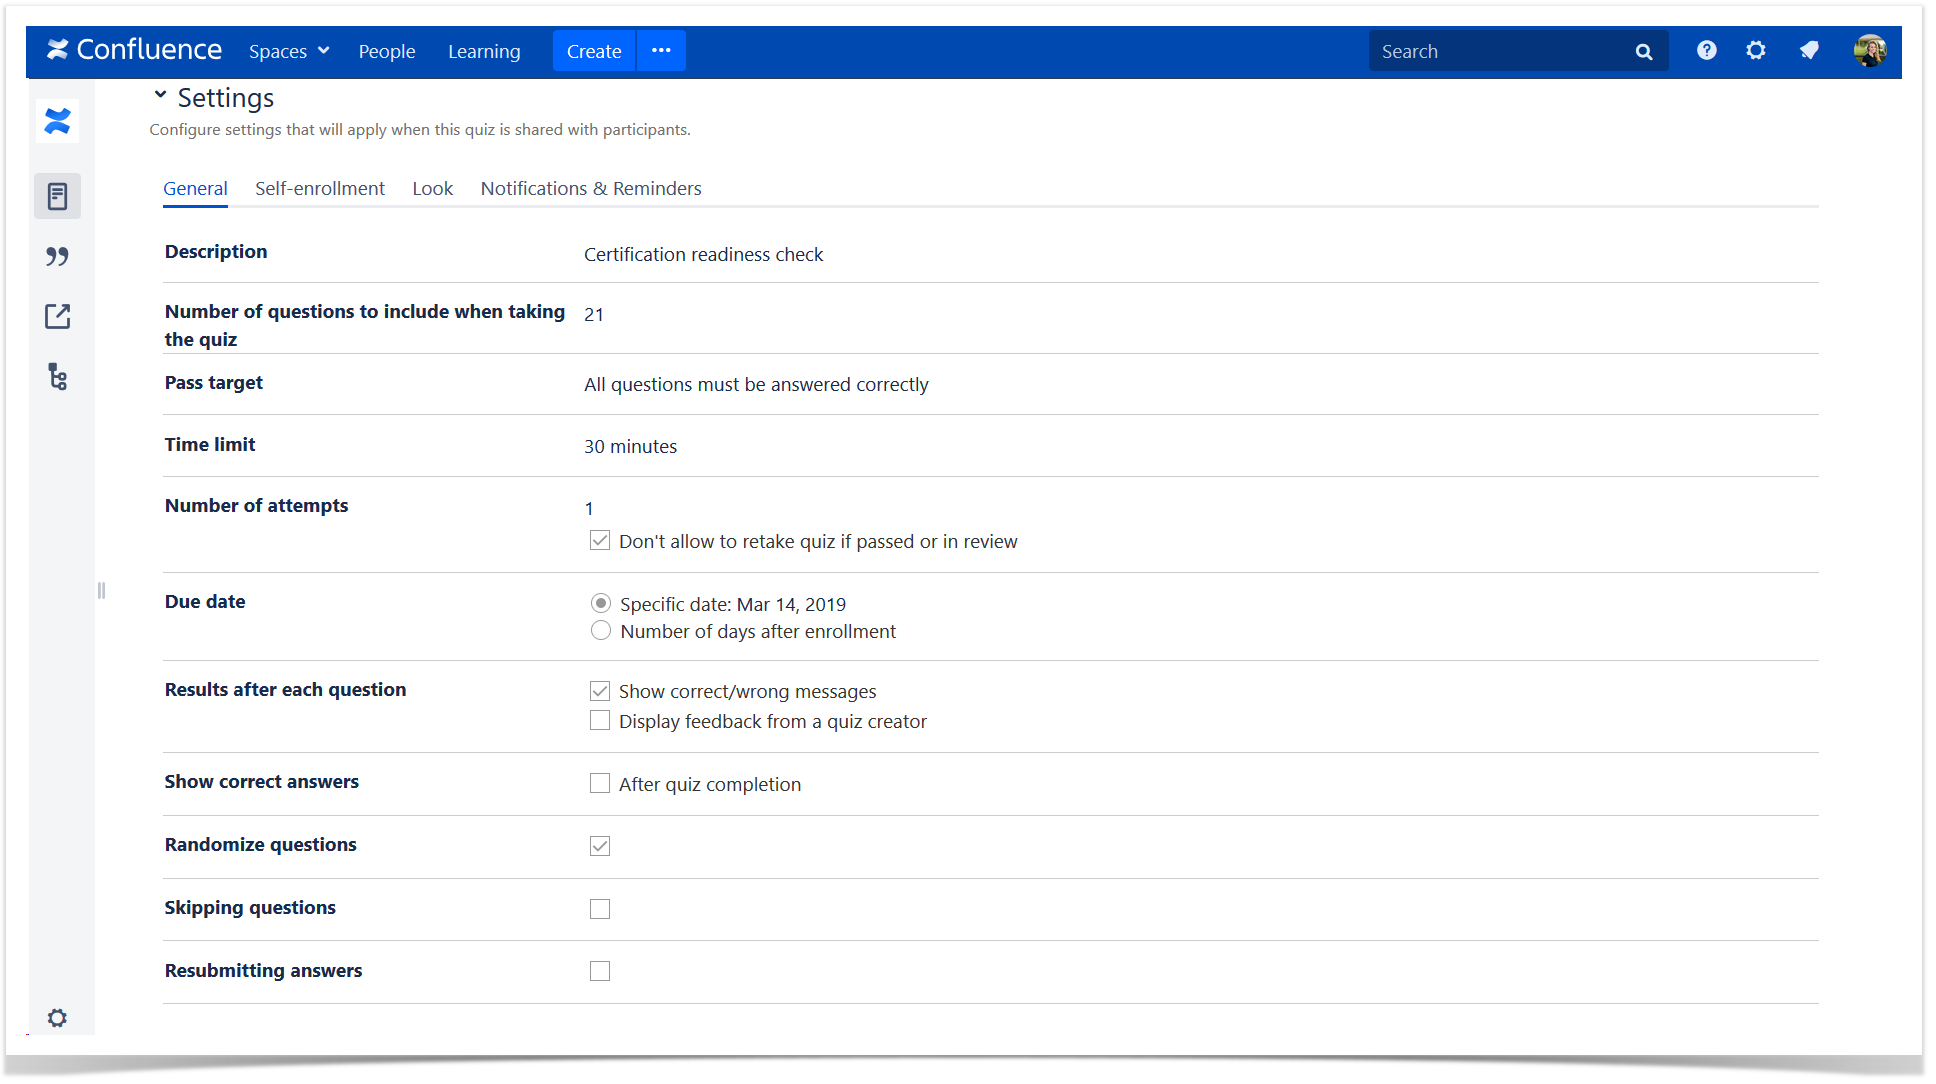
You can create quizzes to assess knowledge, competences and skills of the people who are going to obtain certification off-site. So all quiz participants must complete the quiz successfully to get a certification permit. Just set the pass target, the number of attempts and the time limit and then track the results.

image2019 3 7 17 37 17

Take your employee certification to the next level

Certifications act as benchmarks for employee competency and performance. Whether you’re assessing knowledge of your team or aiming to increase their skills, staying on top of certifications is a key part of running an effective workplace.

Use izi – LMS for Confluence to make sure all of your employees are meeting industry standards. Constant certification in Confluence can help your team increase available skills, achieve their goals and tackle everyday challenges.

You can check the sample training courses and try them either as a participant or as an administrator. You can also use our demo site to try out this app and discover its features with no need to install it.

If you have any questions, feel free to comment on this blog post.

Try izi – LMS for Confluence for free

If You Use Confluence, Your New LMS Could Be Hiding in Plain Sight

March 25, 2023
#Confluence#Learning Management
7 min

A learning management system (LMS) can be a roadblock or a fast track to staff training, knowledge transfer and compliance, depending on the way it is used.

There are plenty of forks in the road even before you select a system from the 800-plus options available, and that number continues to grow. You might choose a generic LMS or one niched for particular industries, channels, prospect use cases, budgets, and more. Then, you’ll need to assign your team and roles to project manage data migration from your legacy system (if that’s possible) and integrate the new LMS with how your company works. It could take a year to get to the implementation stage if you’re hosting the system on your premises or less for a hosted or cloud-based system.

Are you getting a sense of one of the critical issues of adopting a new LMS?

Time is the real cost of an LMS

When your new LMS is live, think of the time wasted to get staff up to speed with the new interface before they’ve even started the real training. Some of your workers may even dig in their heels, saying they haven’t had a chance to get around it.

That could be because they’ve actually run out of time, and they may not be lying.

More than 1,100 times a day, the average employee switches between 35 job-critical applications, a Pegasystems Inc report has found. It surveyed 35 global companies across 11 industries. Staff using more than 30 applications each shift made 28% more errors than their peers who used fewer apps. The report says expanding this over the years sees days of lost time and much highly error-prone activity. In other words, if your staff switch systems less, they’ll make fewer errors and will be more productive.

work in Confluence without switching

It adds up.

Over a year, employees’ idle time costs companies more than $100 billion a year just in the US, according to Harvard University researchers. Too much idle time means staff aren’t being productive and are at risk of becoming disengaged and demoralized with their work.

Of course, the other costs of adopting an LMS include support, maintenance, creating content, and managing learning. Most vendors offer a per-user, per-month pricing model, and the price goes up if you opt for extra features.

LMS for Confluence that comes to where your staff operate

If you’re already using enterprise collaboration software such as Atlassian Confluence, your staff are no doubt comfortable whether they’re working face-to-face or remotely.

So, why not bring in your new LMS for Confluence, so they don’t have to learn a new system? After all, if they’re learning new content within Confluence, chances are they’ll already be switched on to collaborate.

LMS for Confluence

Studies show if you interact with others, ask questions and use what you’ve learned, you’ll remember 69% of the content in two days. That compares with just 28% if you learned solo.

Nesting your learning portal within Confluence helps make your staff more efficient. An Association for Intelligent Information Management study found more than eight in 10 businesses said they wasted too much time searching for and recreating knowledge. In fact, US businesses waste three-quarters of a trillion dollars searching for content that already exists.

Having your LMS sitting within Confluence means staff won’t have to switch to a separate system for learning, and you’ll save time on system integration. You’ll be able to keep tabs on certifications for your organization for legal compliance, too.

Confluence as your LMS makes sense.

There is an app that’s a Confluence learning management system, set up and ready to go for:

  • Pre-recruitment testing
  • Employee onboarding
  • E-learning
  • Creating quizzes from scratch
  • Developing courses
  • Checking product knowledge
  • Training and
  • Testing as well as certifications.

It’s a Confluence app called IZI for Confluence – LMS, Training Courses, Quizzes – it lets staff easily move from working on tasks to training and back without leaving Confluence.

izi - LMS for Confluence

The back story

Since going live in October 2015, this Confluence LMS has been harnessed by teams across the globe for staff training and more within Confluence. It’s particularly popular in the US, Germany, the UK and India, according to Crunchbase. Most users are tech companies, but it’s also gaining traction in pharmaceutical, automotive, banking, insurance, and medical spheres.

The multi-award-winning company behind izi – LMS for Confluence is Stiltsoft, which started operating in 2010. It offers 20-plus apps for Atlassian tools, including the popular Table Filter and Charts, also available from the Atlassian Marketplace. Stiltsoft has more than 7,000 customers in 80-plus countries. They include Netflix, Allianz, Symantec, Logitech, Tesla, Samsung, Dell, Mercedes-Benz, AT@T, and Walmart.

Stiltsoft customers

Stiltsoft has won Codegeist awards for best apps and, in 2021, was named an Atlassian Platinum Marketplace Partner. It’s also active in the Marketplace Bug Bounty Program.

How this LMS for Confluence works for enterprises

Here’s what’s on offer with this Atlassian Confluence app.

For Confluence users, the interface of this LMS is already familiar. Simply enroll using Confluence users and groups that are already set up in Confluence. That means there’s no need to handle user management in this LMS.

Once the app is on your Confluence dashboard, get started by choosing either the introduction to:

Each section steps you through with lots of screenshots to help visualize the process. Add text, images, rich text, presentations, links, or videos to bring your content to life. You’ll have professionally designed blank templates as your canvass to begin creating.

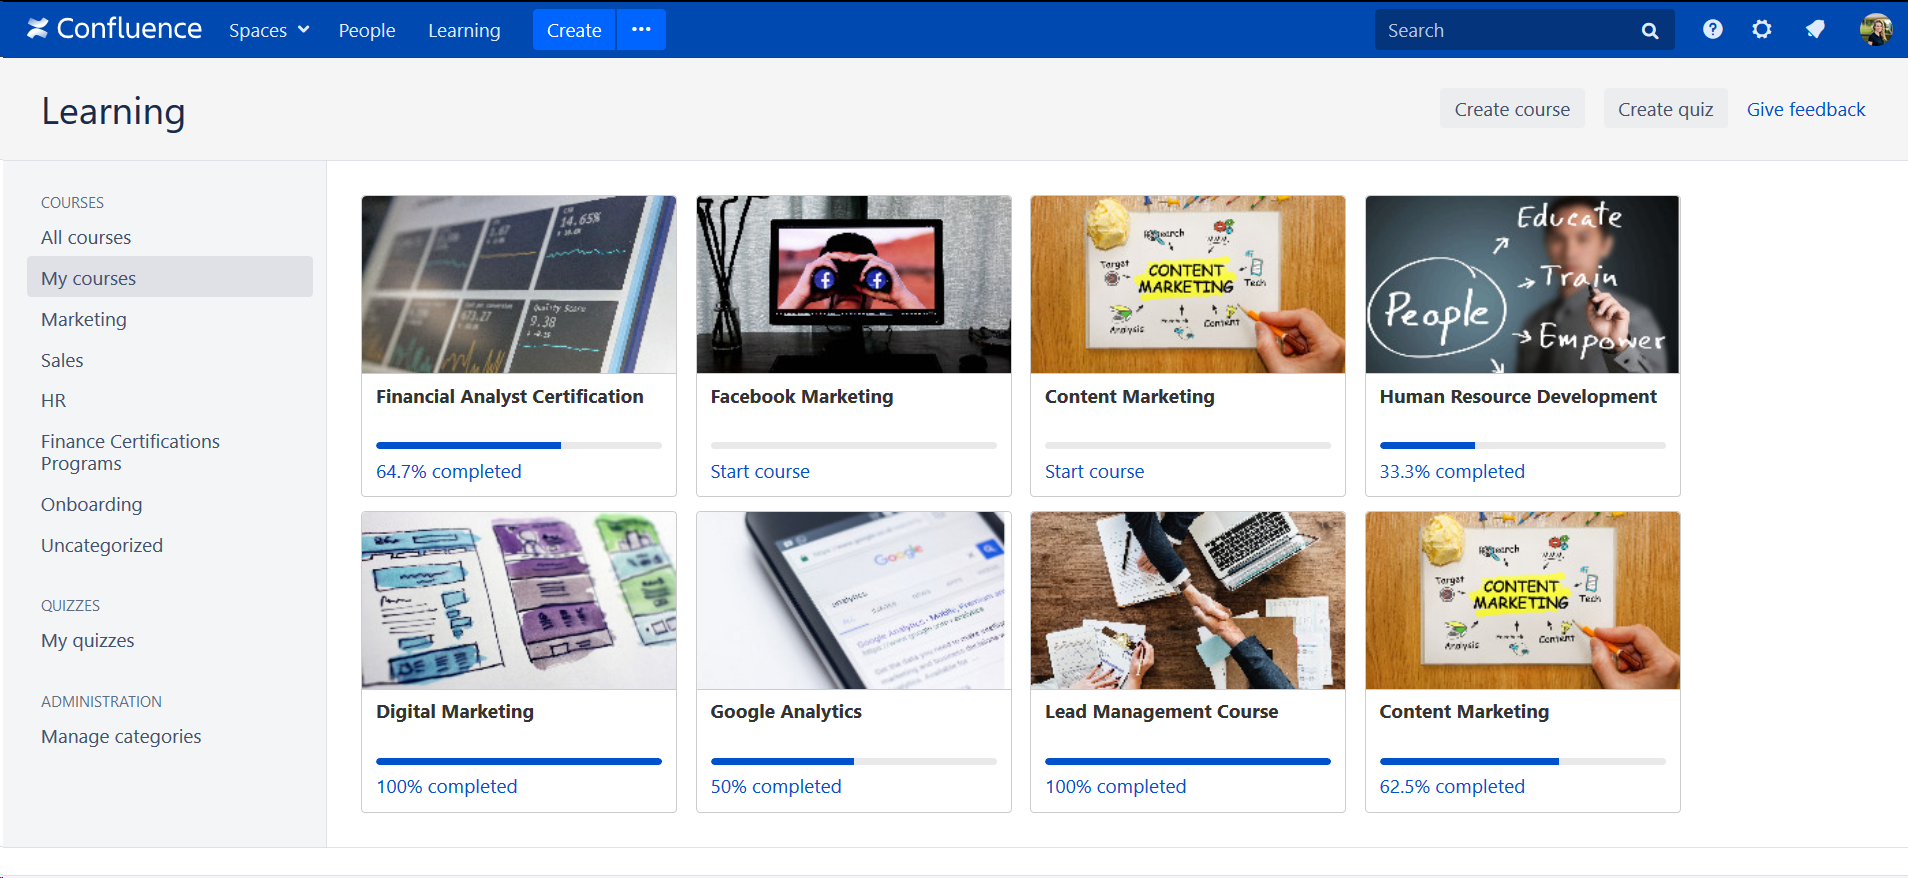
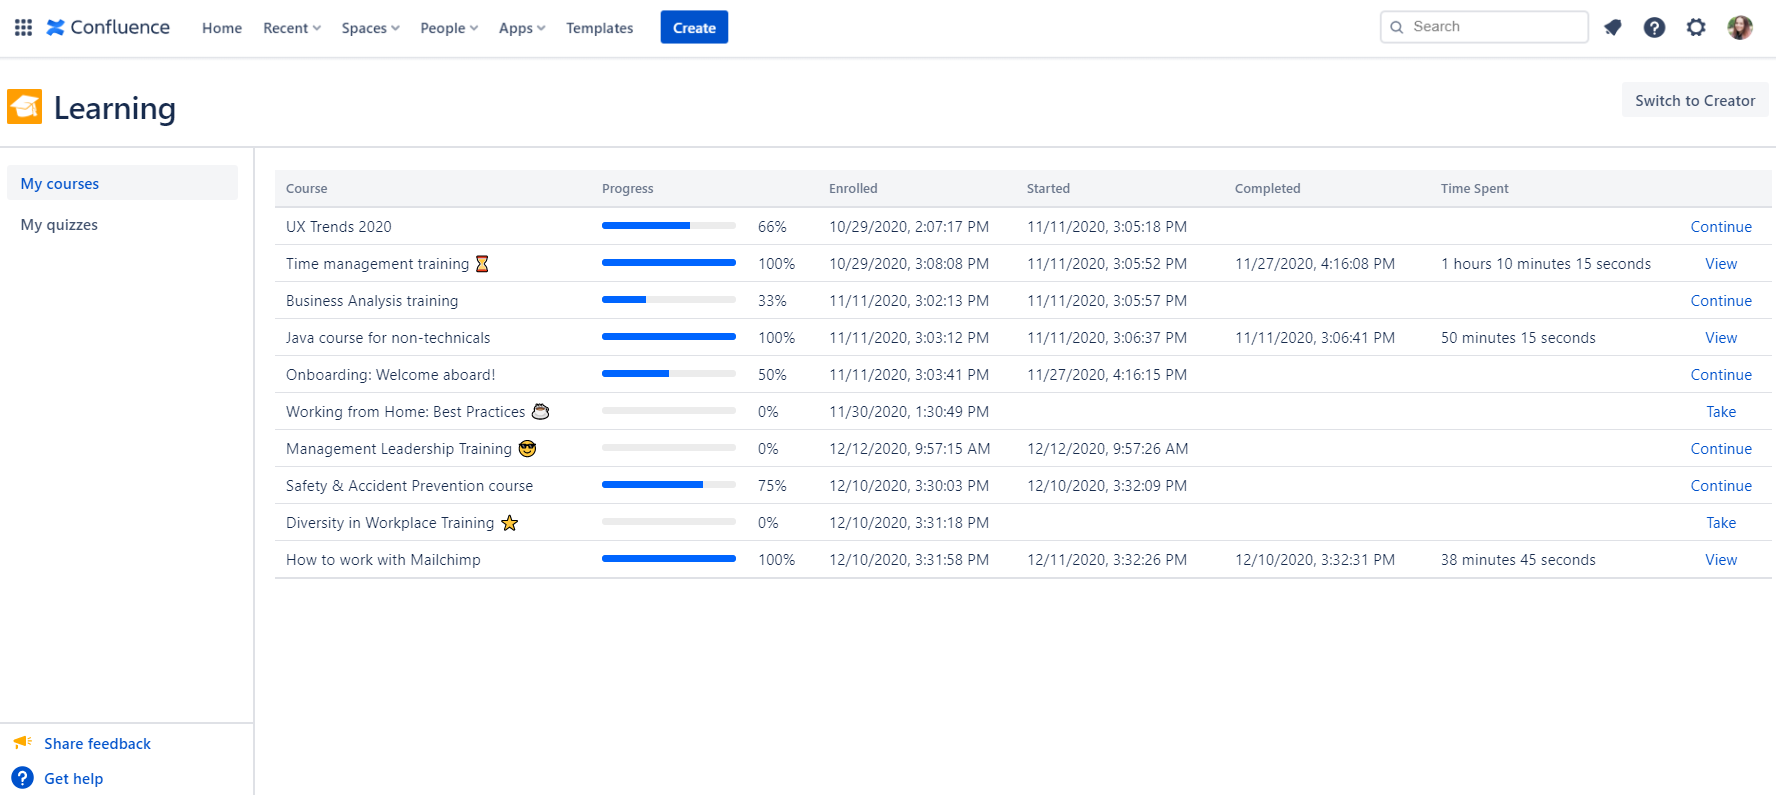
For example, when you build a course, you can create, add and organize modules, and enroll users or groups, even anonymous users, too. Once they begin, participants can use the My courses tab to see the learning portal to check which courses they’re enrolled in and track their progress.

Learning portal in Atlassian Confluence

As a creator, you’ll access a dashboard to create new courses and quizzes, as well as find those you’ve set up before. Creators can also be participants in courses others have built or even you’ve built yourself. Importantly, you’ll be able to check on who’s completed which course and who may need a nudge to keep learning.

tracking course progress in Confluence

One feature of izi – LMS for Confluence is the ability to create a quiz from anywhere in Confluence – just using the plus sign in the sidebar and selecting the Quiz blueprint. If you can’t find a feature you’d like, you can request it as well as share your feedback via a survey or an interview.

So, whichever way you look at it through the kaleidoscope of time, choosing an LMS is a major move for any business. You could be just a few clicks away from moving e-learning to the next level for your staff.

Try LMS for Confluence free

You’ll find IZI for Confluence – LMS, Training Courses, Quizzes in the Atlassian marketplace. izi is easy to download and try for free for 30 days, plus you can book a 30-minute demo to help you on your way to more seamless e-learning Confluence-style in your business.

Unlocking the Power of an LMS in Confluence for Efficient Employee Training

March 14, 2023
#Confluence#Learning Management
6 min

Employee training is an essential part of any business. It helps employees understand their roles, increase productivity, and stay current with industry trends.

To maximize the effectiveness of employee education, many companies turn to modern solutions for learning management. Of course, choosing the right solution for top-notch training can be challenging.

We think that one of the best ways to do this is to provide training tailored to each employee’s needs. As such, you can use the software that your team is familiar with, like Confluence. By adopting this approach, companies can reduce the time and resources they spend on training while also providing their staff with the tools they need to succeed.

Let’s see how to elevate employee education by leveraging a learning management system in Confluence.

Why use LMS in Confluence for employee training

Confluence is a remote-friendly team workspace that allows users to create and share content, collaborate, and access various learning resources. You get a centralized platform for managing content, reducing the need for multiple third-party tools. Furthermore, Confluence allows users to easily structure content in a cohesive way, which helps accelerate the learning process.

We bet that you already have a lot of information in your Confluence that training administrators can use for employee education. So turning your Confluence into a fully-fledged learning management system is a great idea. And it is possible with the help of izi – LMS for Confluence. This app requires minimal setup and makes Confluence more powerful and user-friendly, allowing companies to quickly get their courses up and running. And employees, in turn, get an interactive environment to engage in.

Create courses in Confluence

Setting up an LMS in Confluence is quick and easy. After installation of the app, creators and learners get immediate access to the Learning portal in Confluence.

lms-in-confluence

Learning administrators can create courses from the portal view or from anywhere in Confluence by clicking the Create button and using the Course template.

One of the main advantages is that izi LMS allows reusing the existing content and separate Confluence pages as training blocks of the course. Administrators can edit content if required to ensure each training module has a clear objective and the course is well-structured and easy to follow.

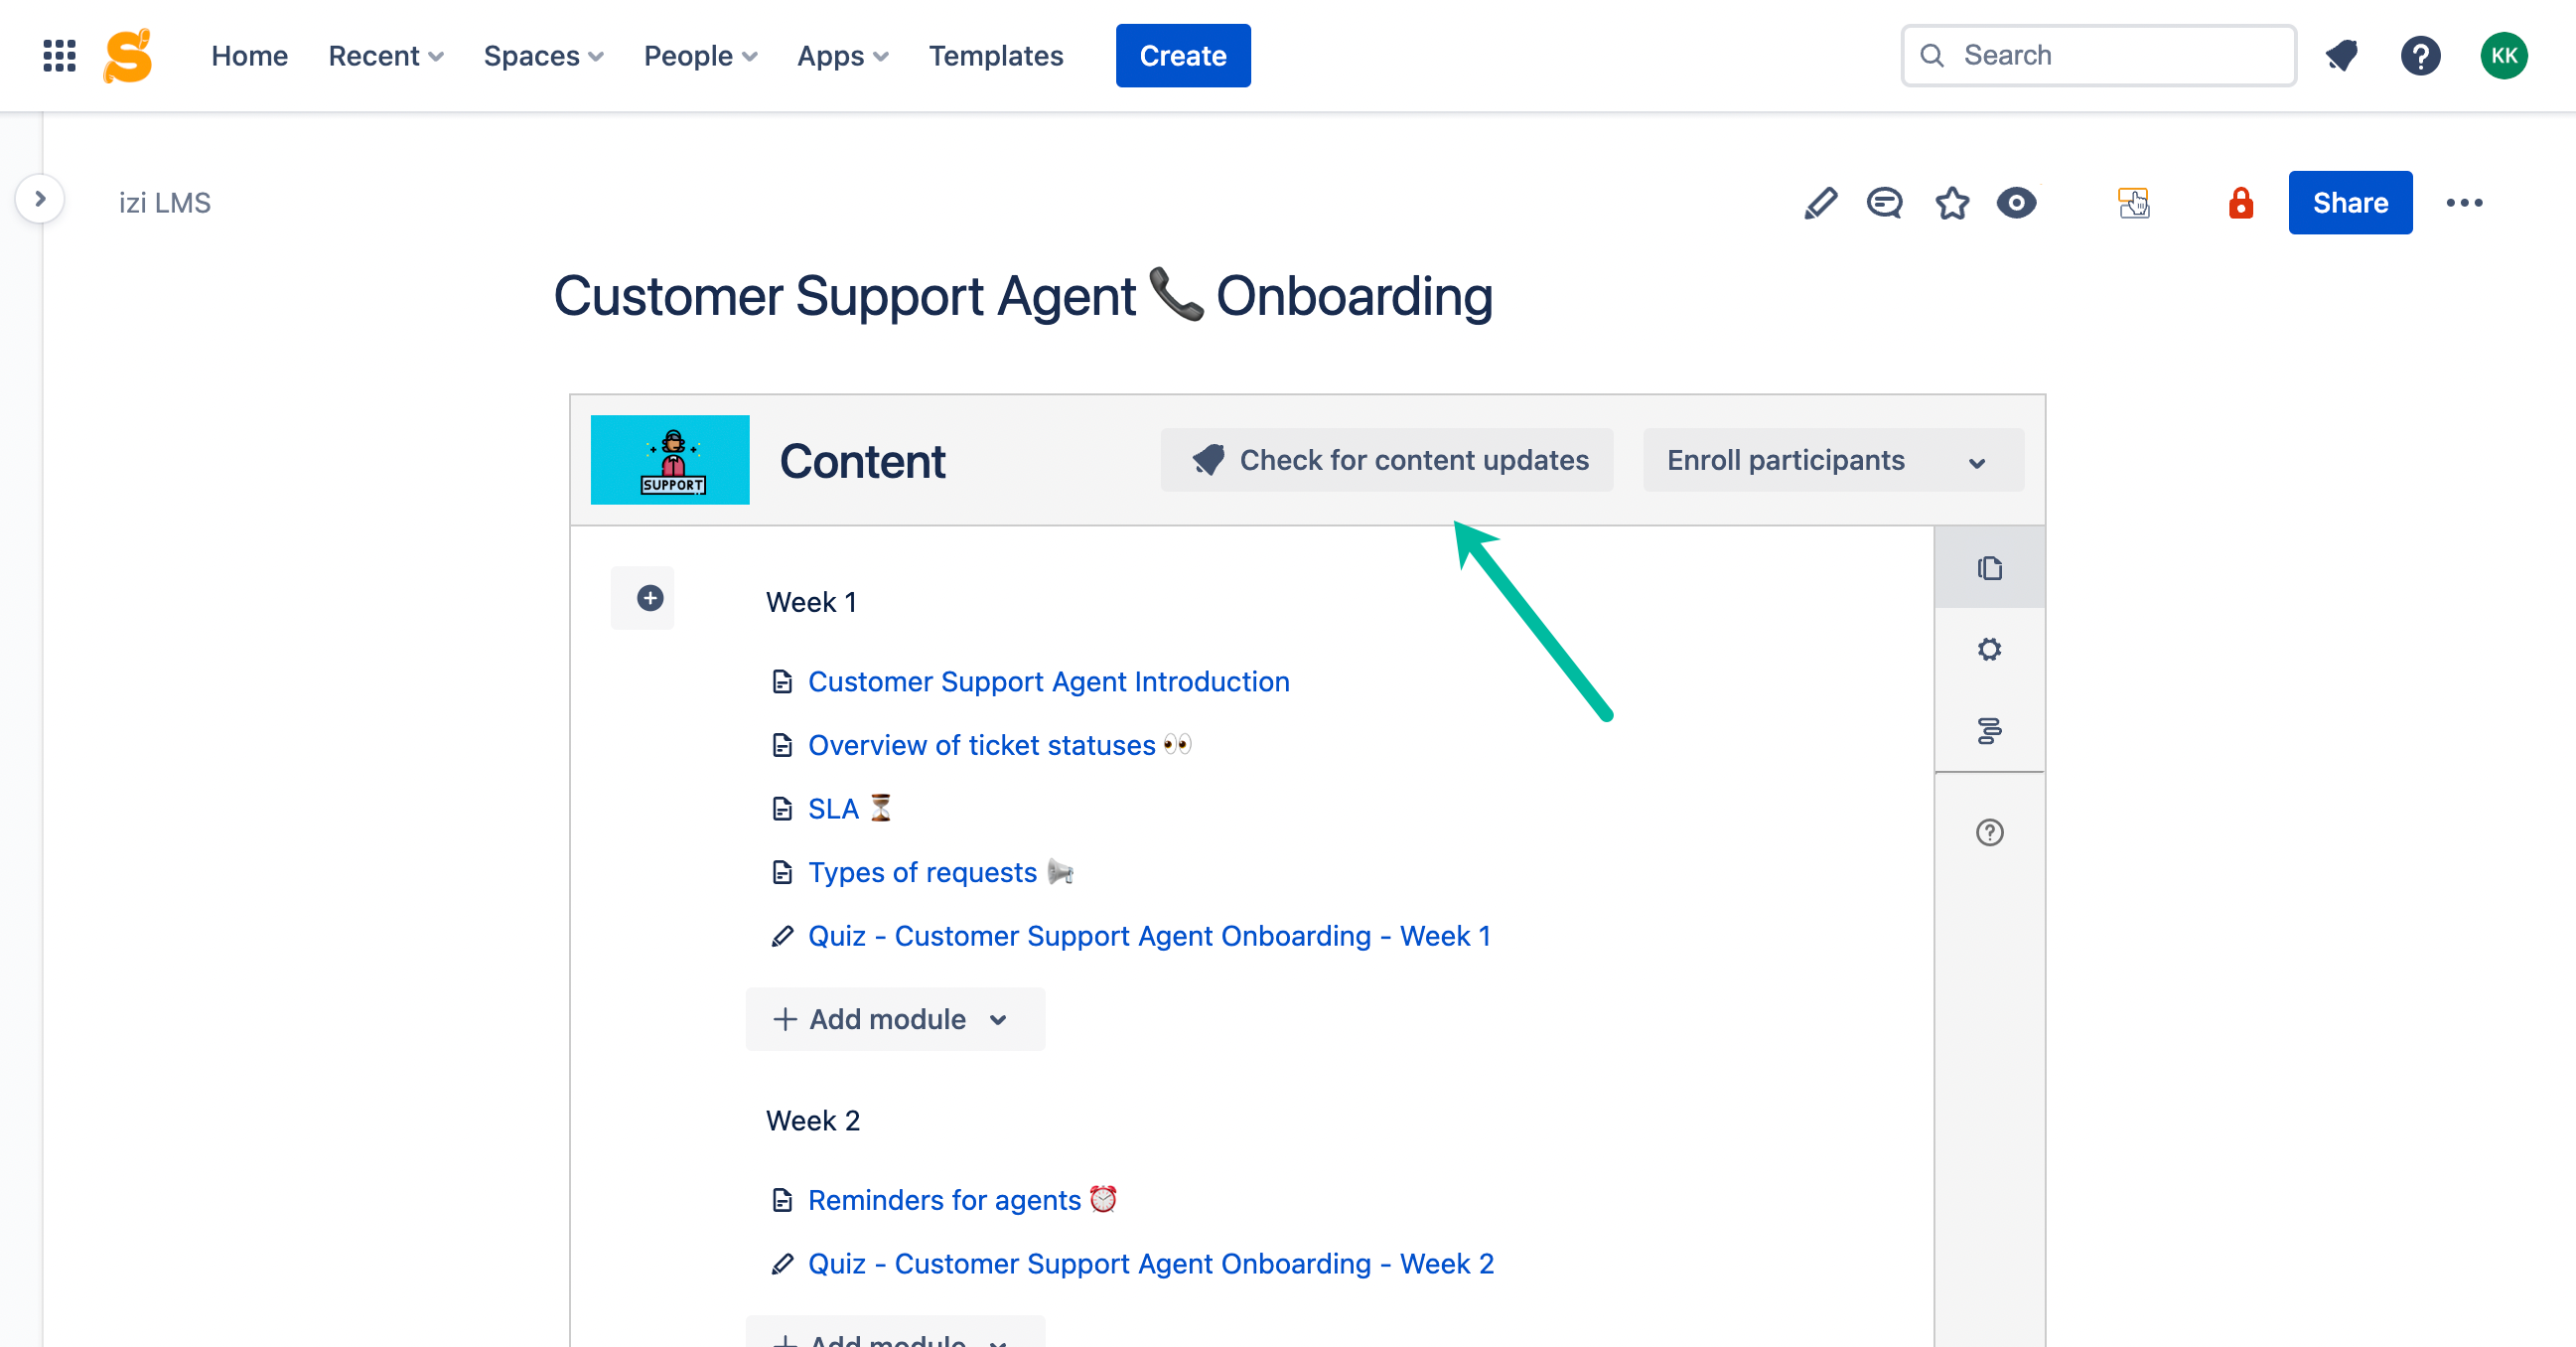
Populating training modules with images, videos, PDF files, and quizzes helps create engaging and interactive training materials. Moreover, administrators can update content for already enrolled course participants. In this case, employees receive the most up-to-date information when something has changed in the process covered in the course, or there is a new training module.

Check for content updates

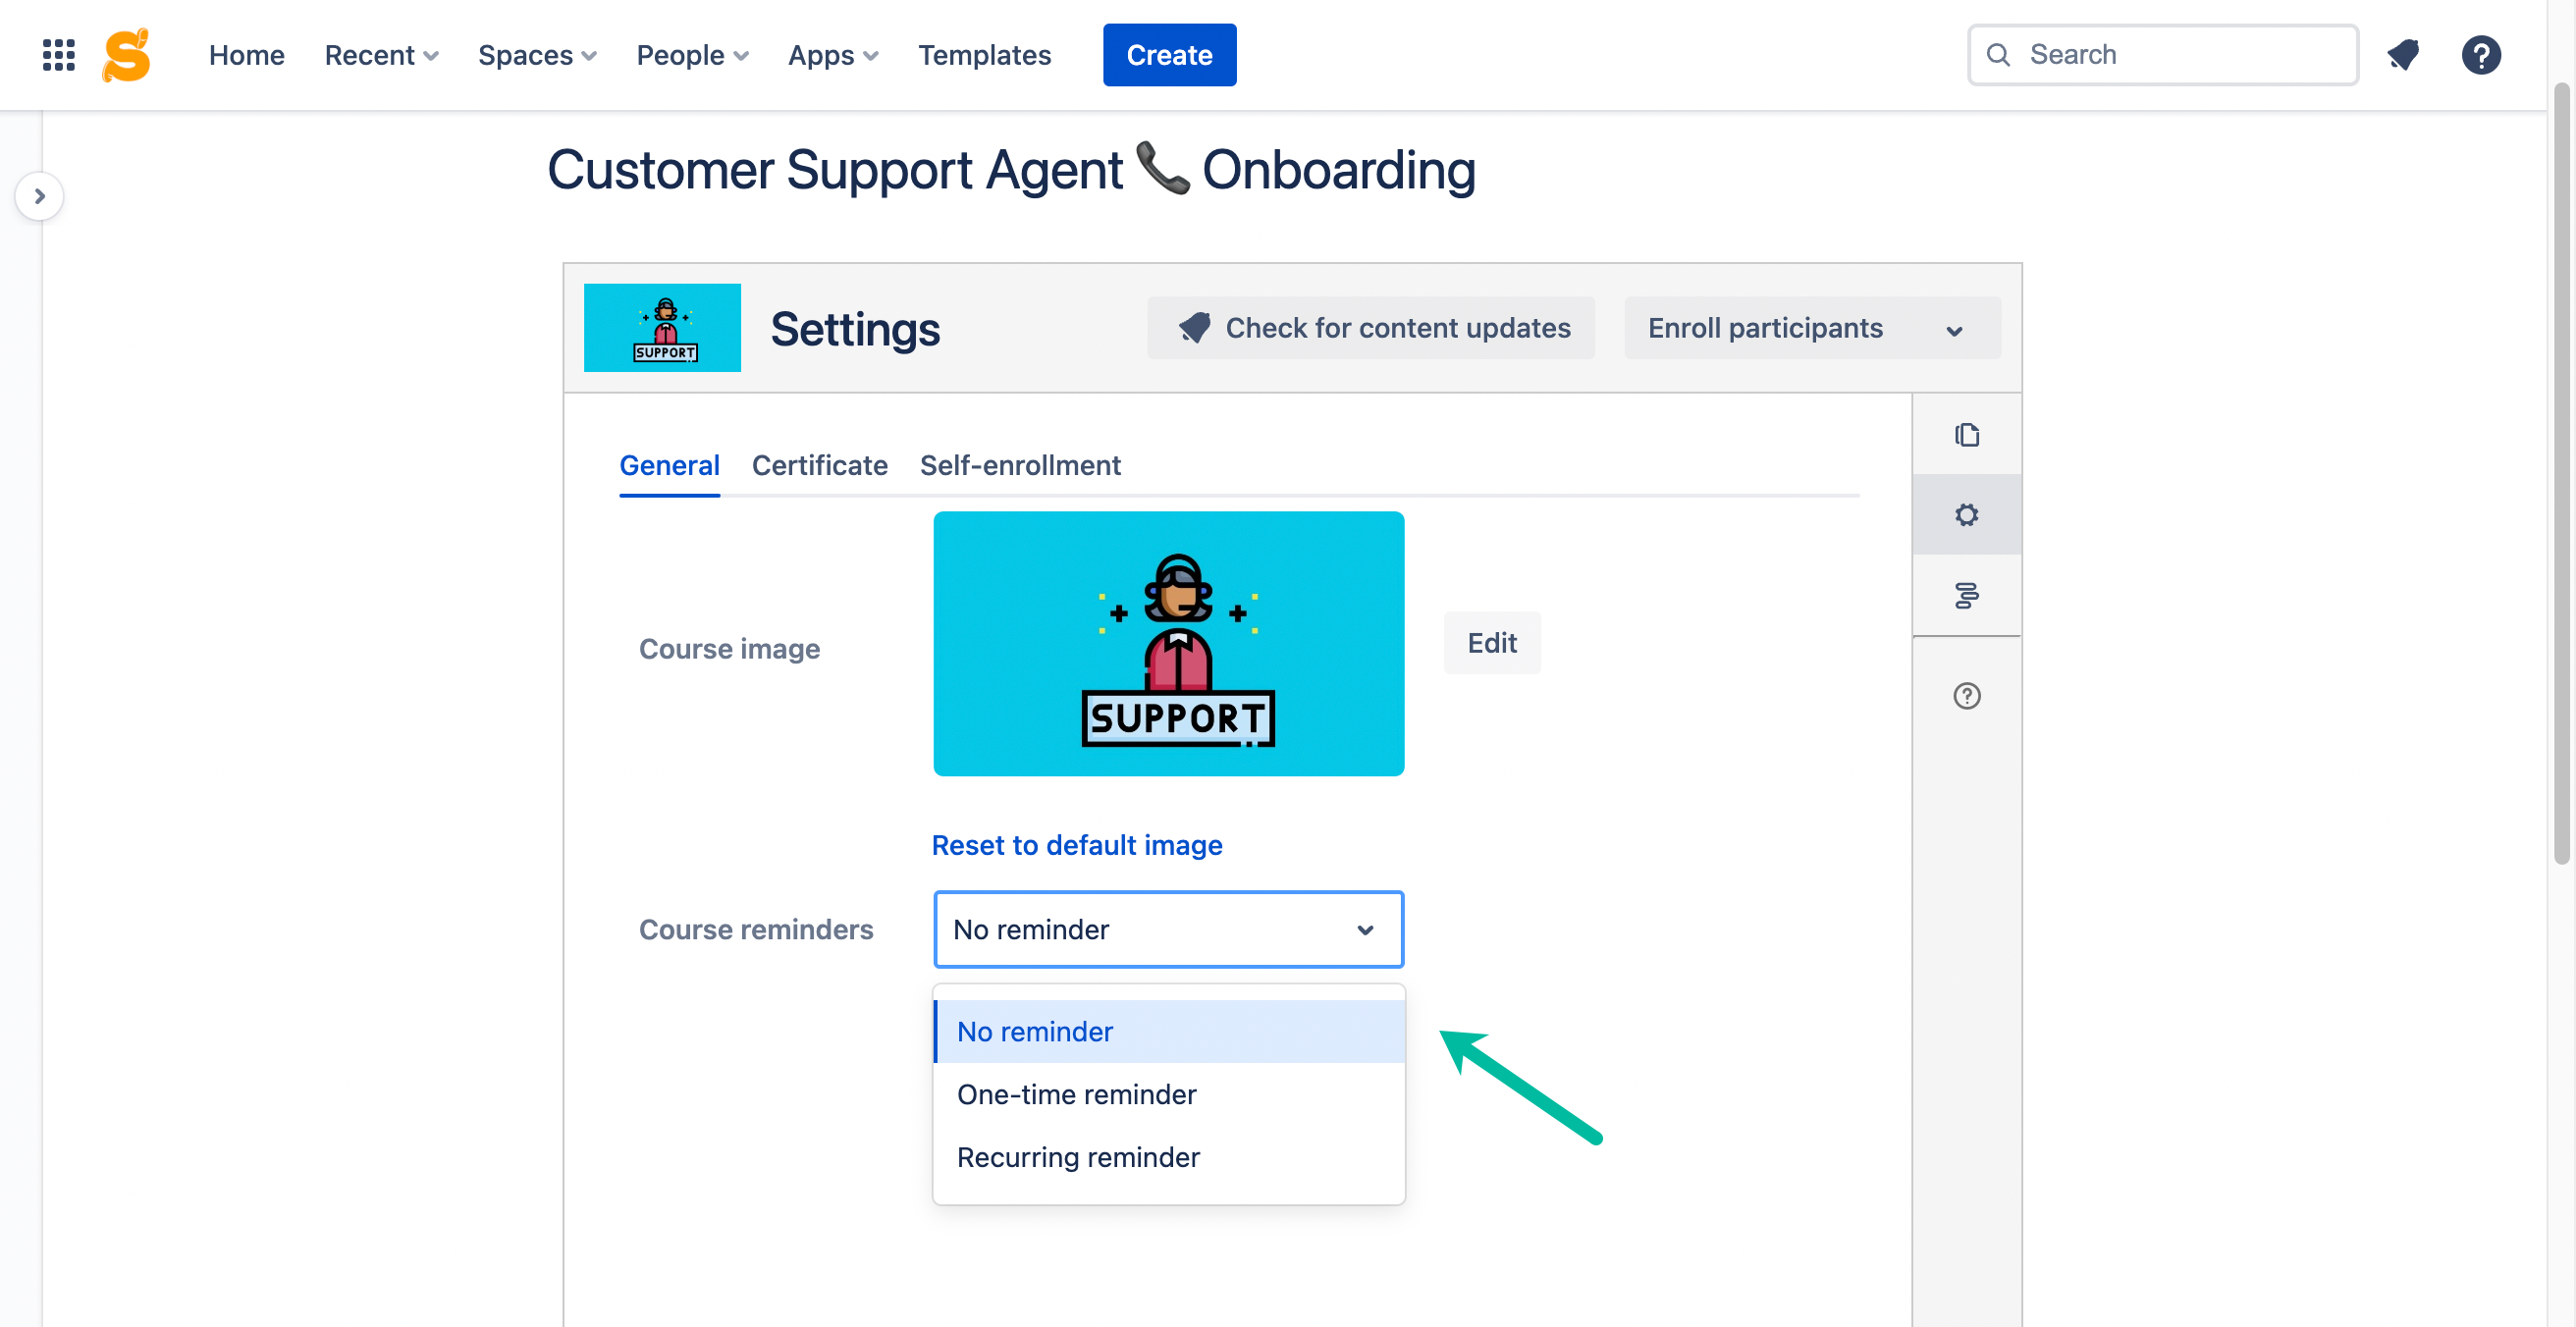
To notify course participants about the necessity to finish the course, creators can set up automatic reminders for course participants.

Course reminders

Enjoy a smooth learning process

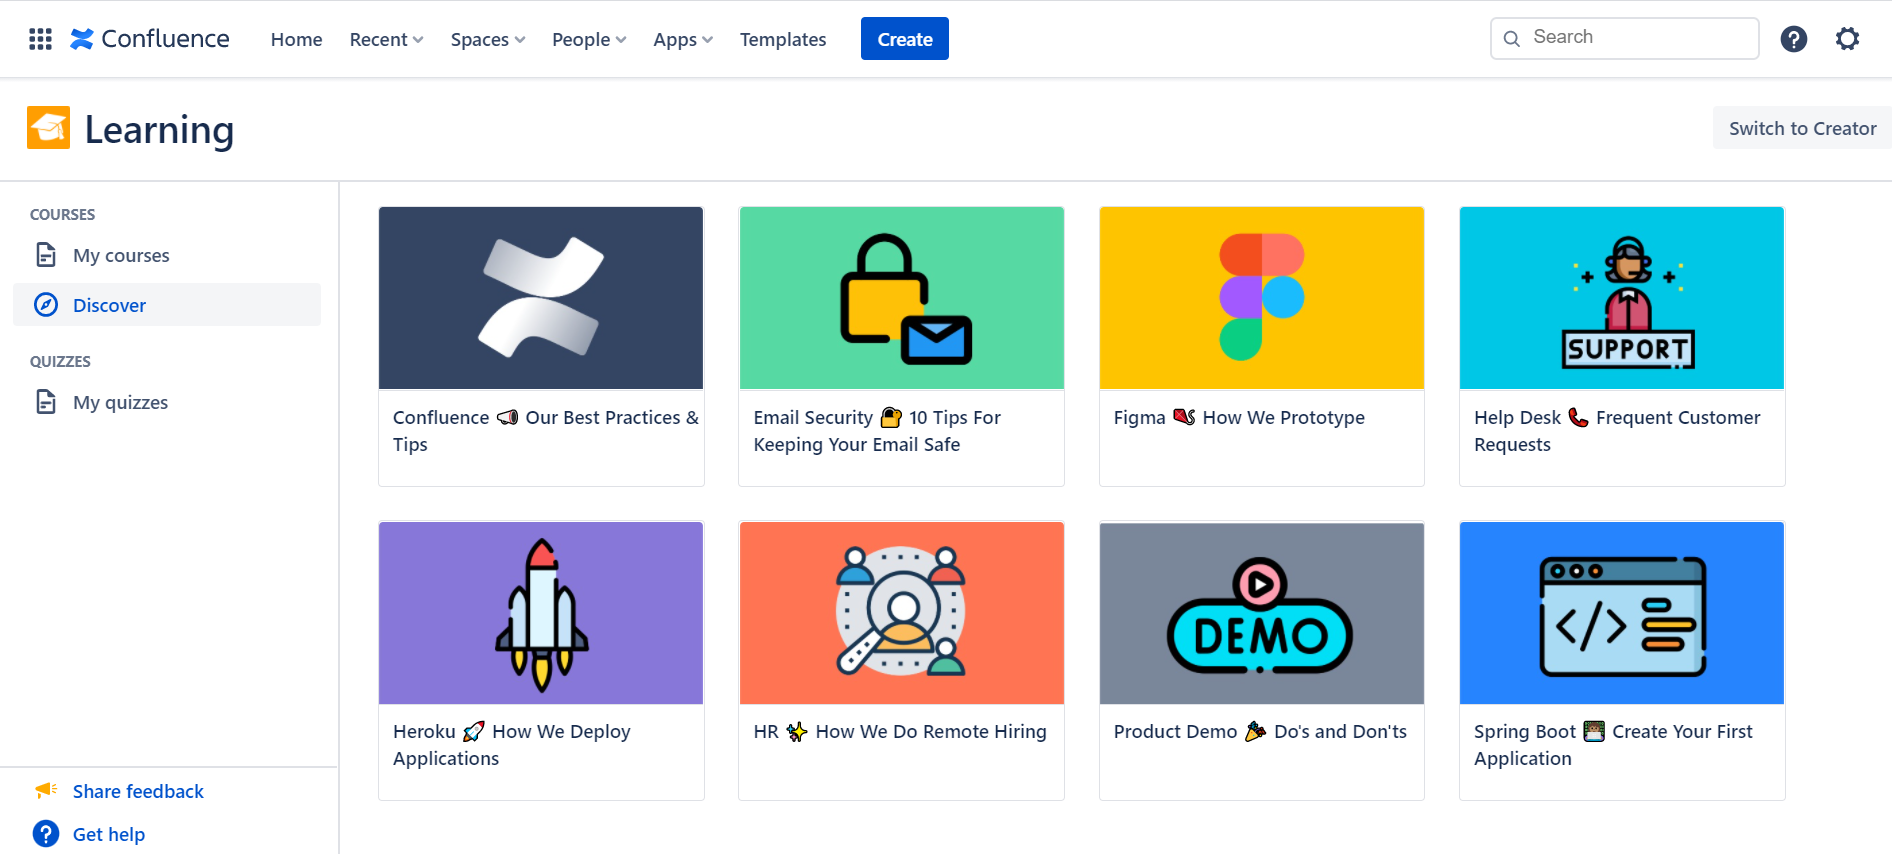
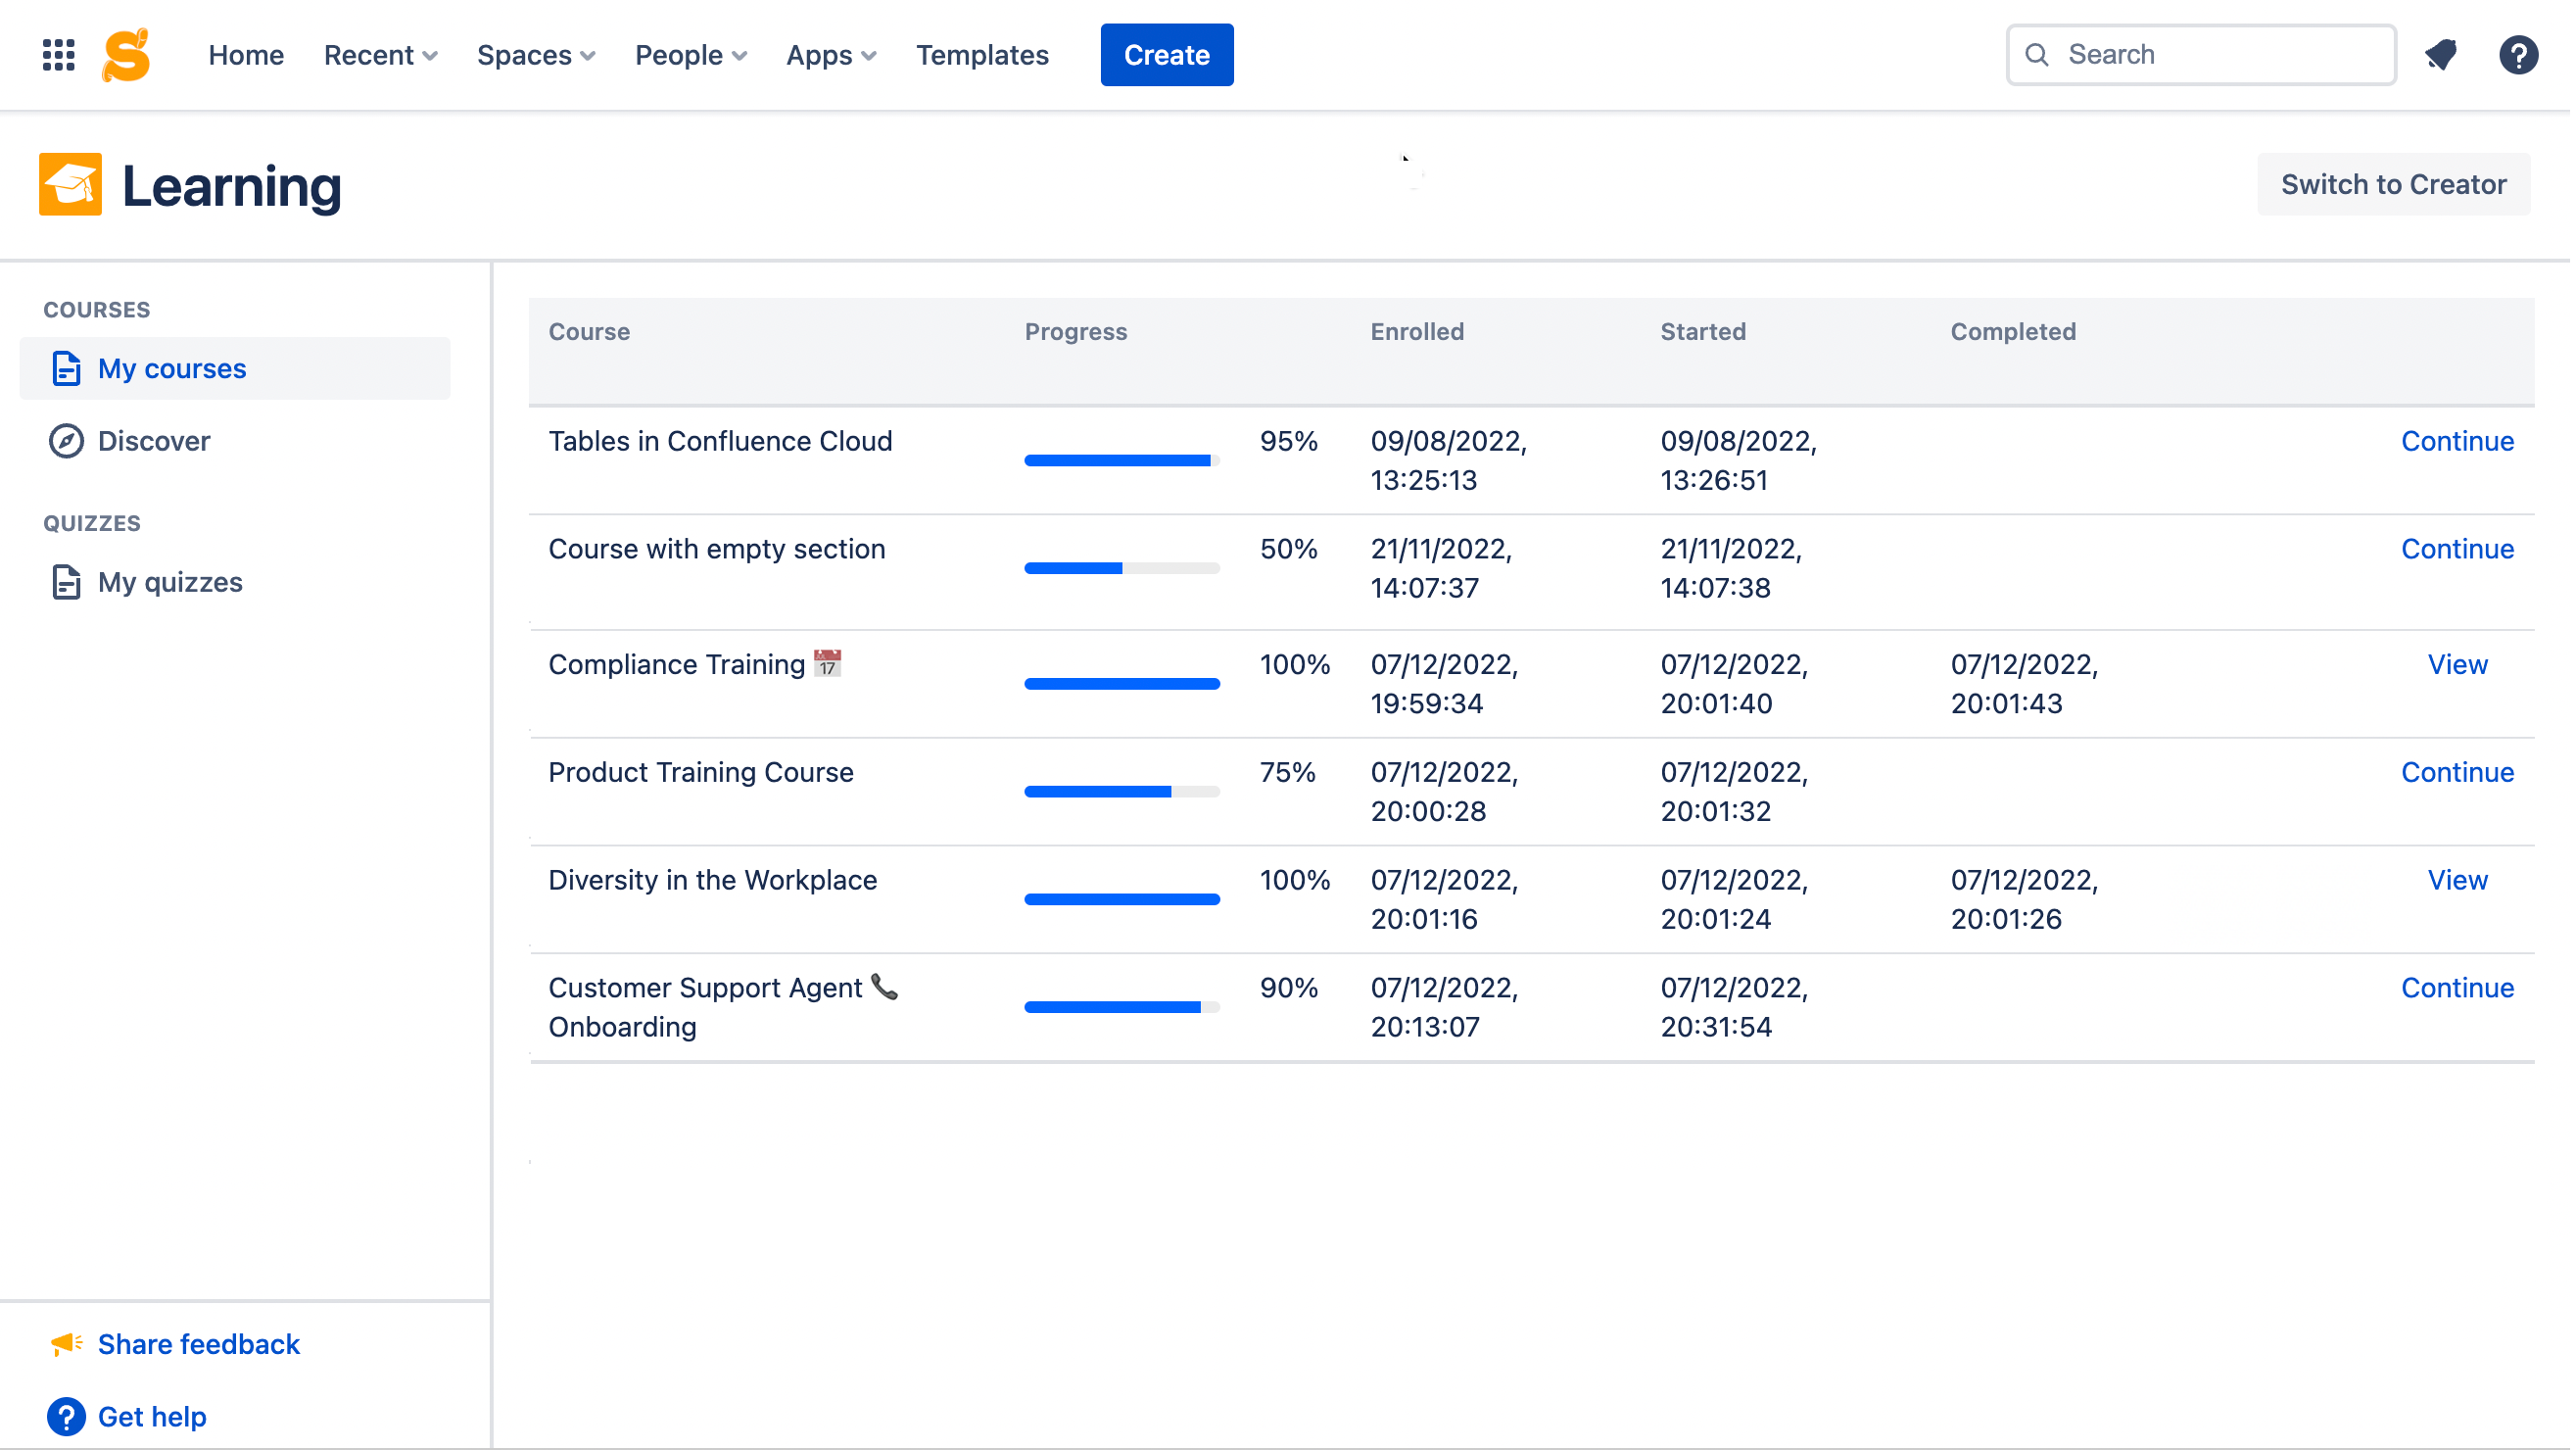
Confluence users can browse the Learning catalog of available courses and self-enroll in the ones they find interesting. Also, they see their progress in the courses they are taking.

My courses in Learning

Learners see every course as a set of training modules they need to study carefully and complete one by one. Courses can contain quizzes that help assess user knowledge and understanding. This allows course administrators to rapidly identify gaps in knowledge to pay attention to and adjust courses accordingly. Questions can be of four different types:

  • single choice
  • multiple choice
  • true/false
  • free text

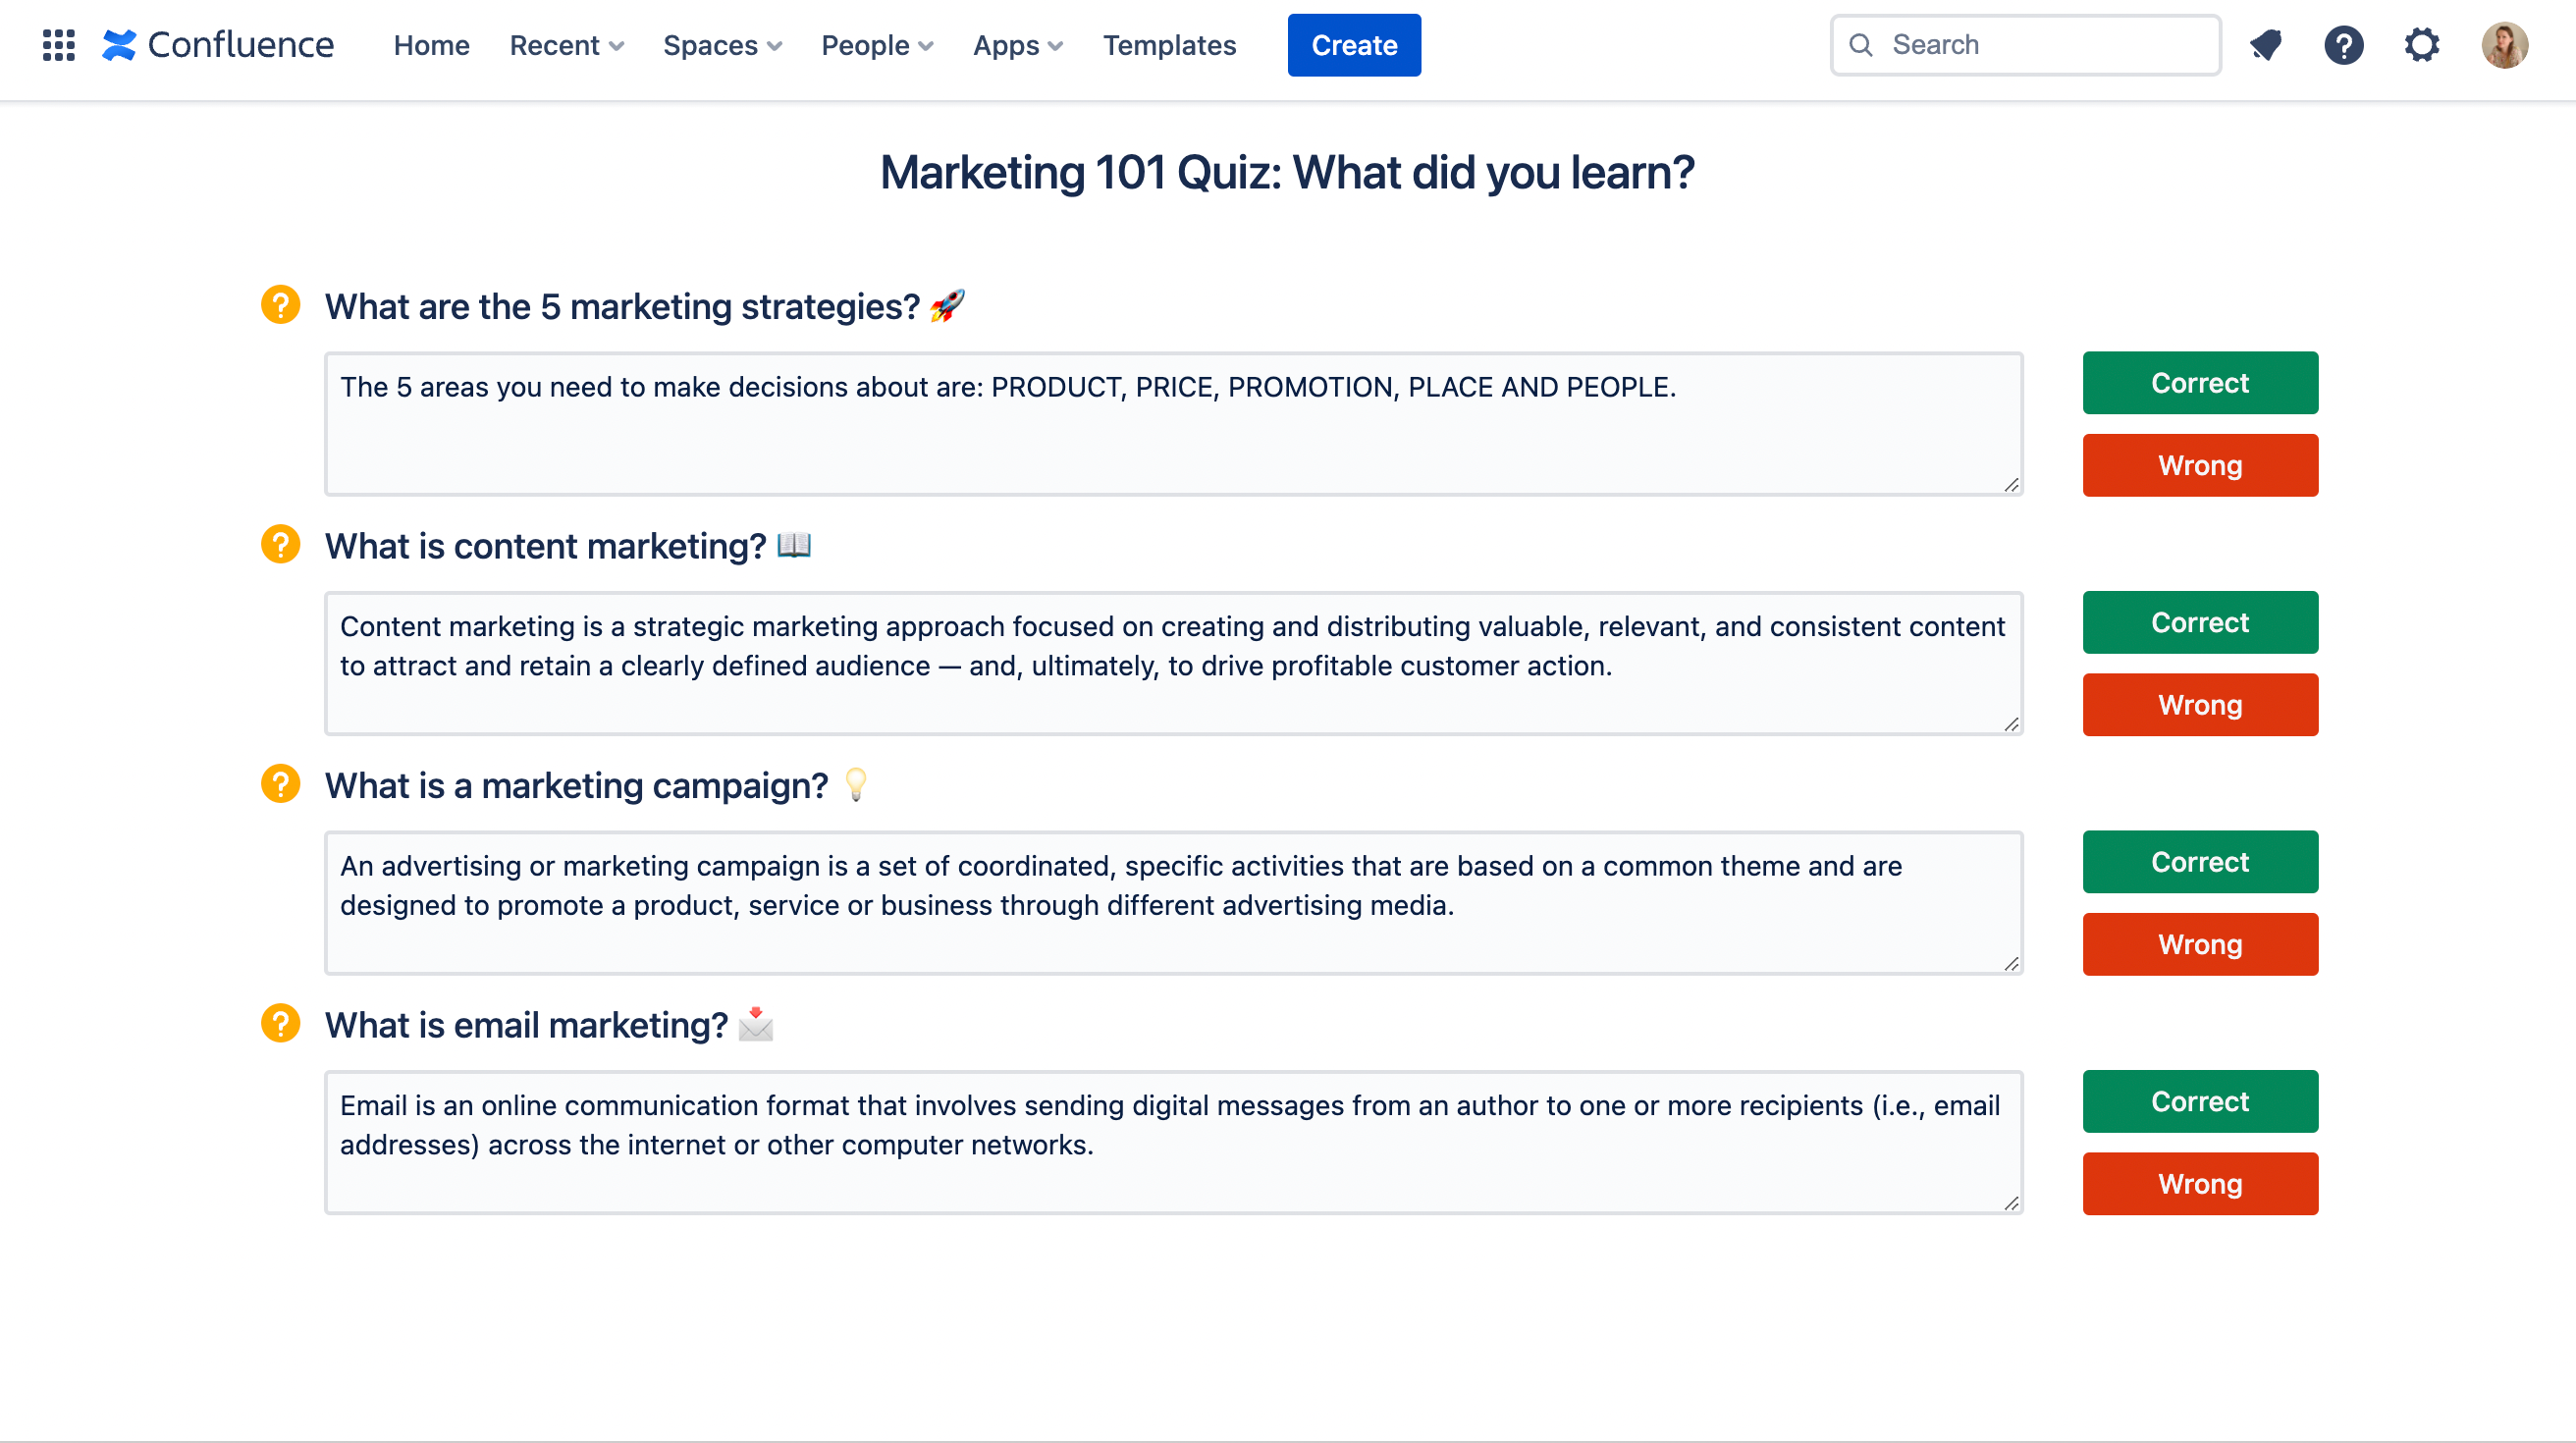
Free text questions let participants share their thoughts on the question with the course creator, who then needs to review answers and mark them as correct or wrong.

Free text review page

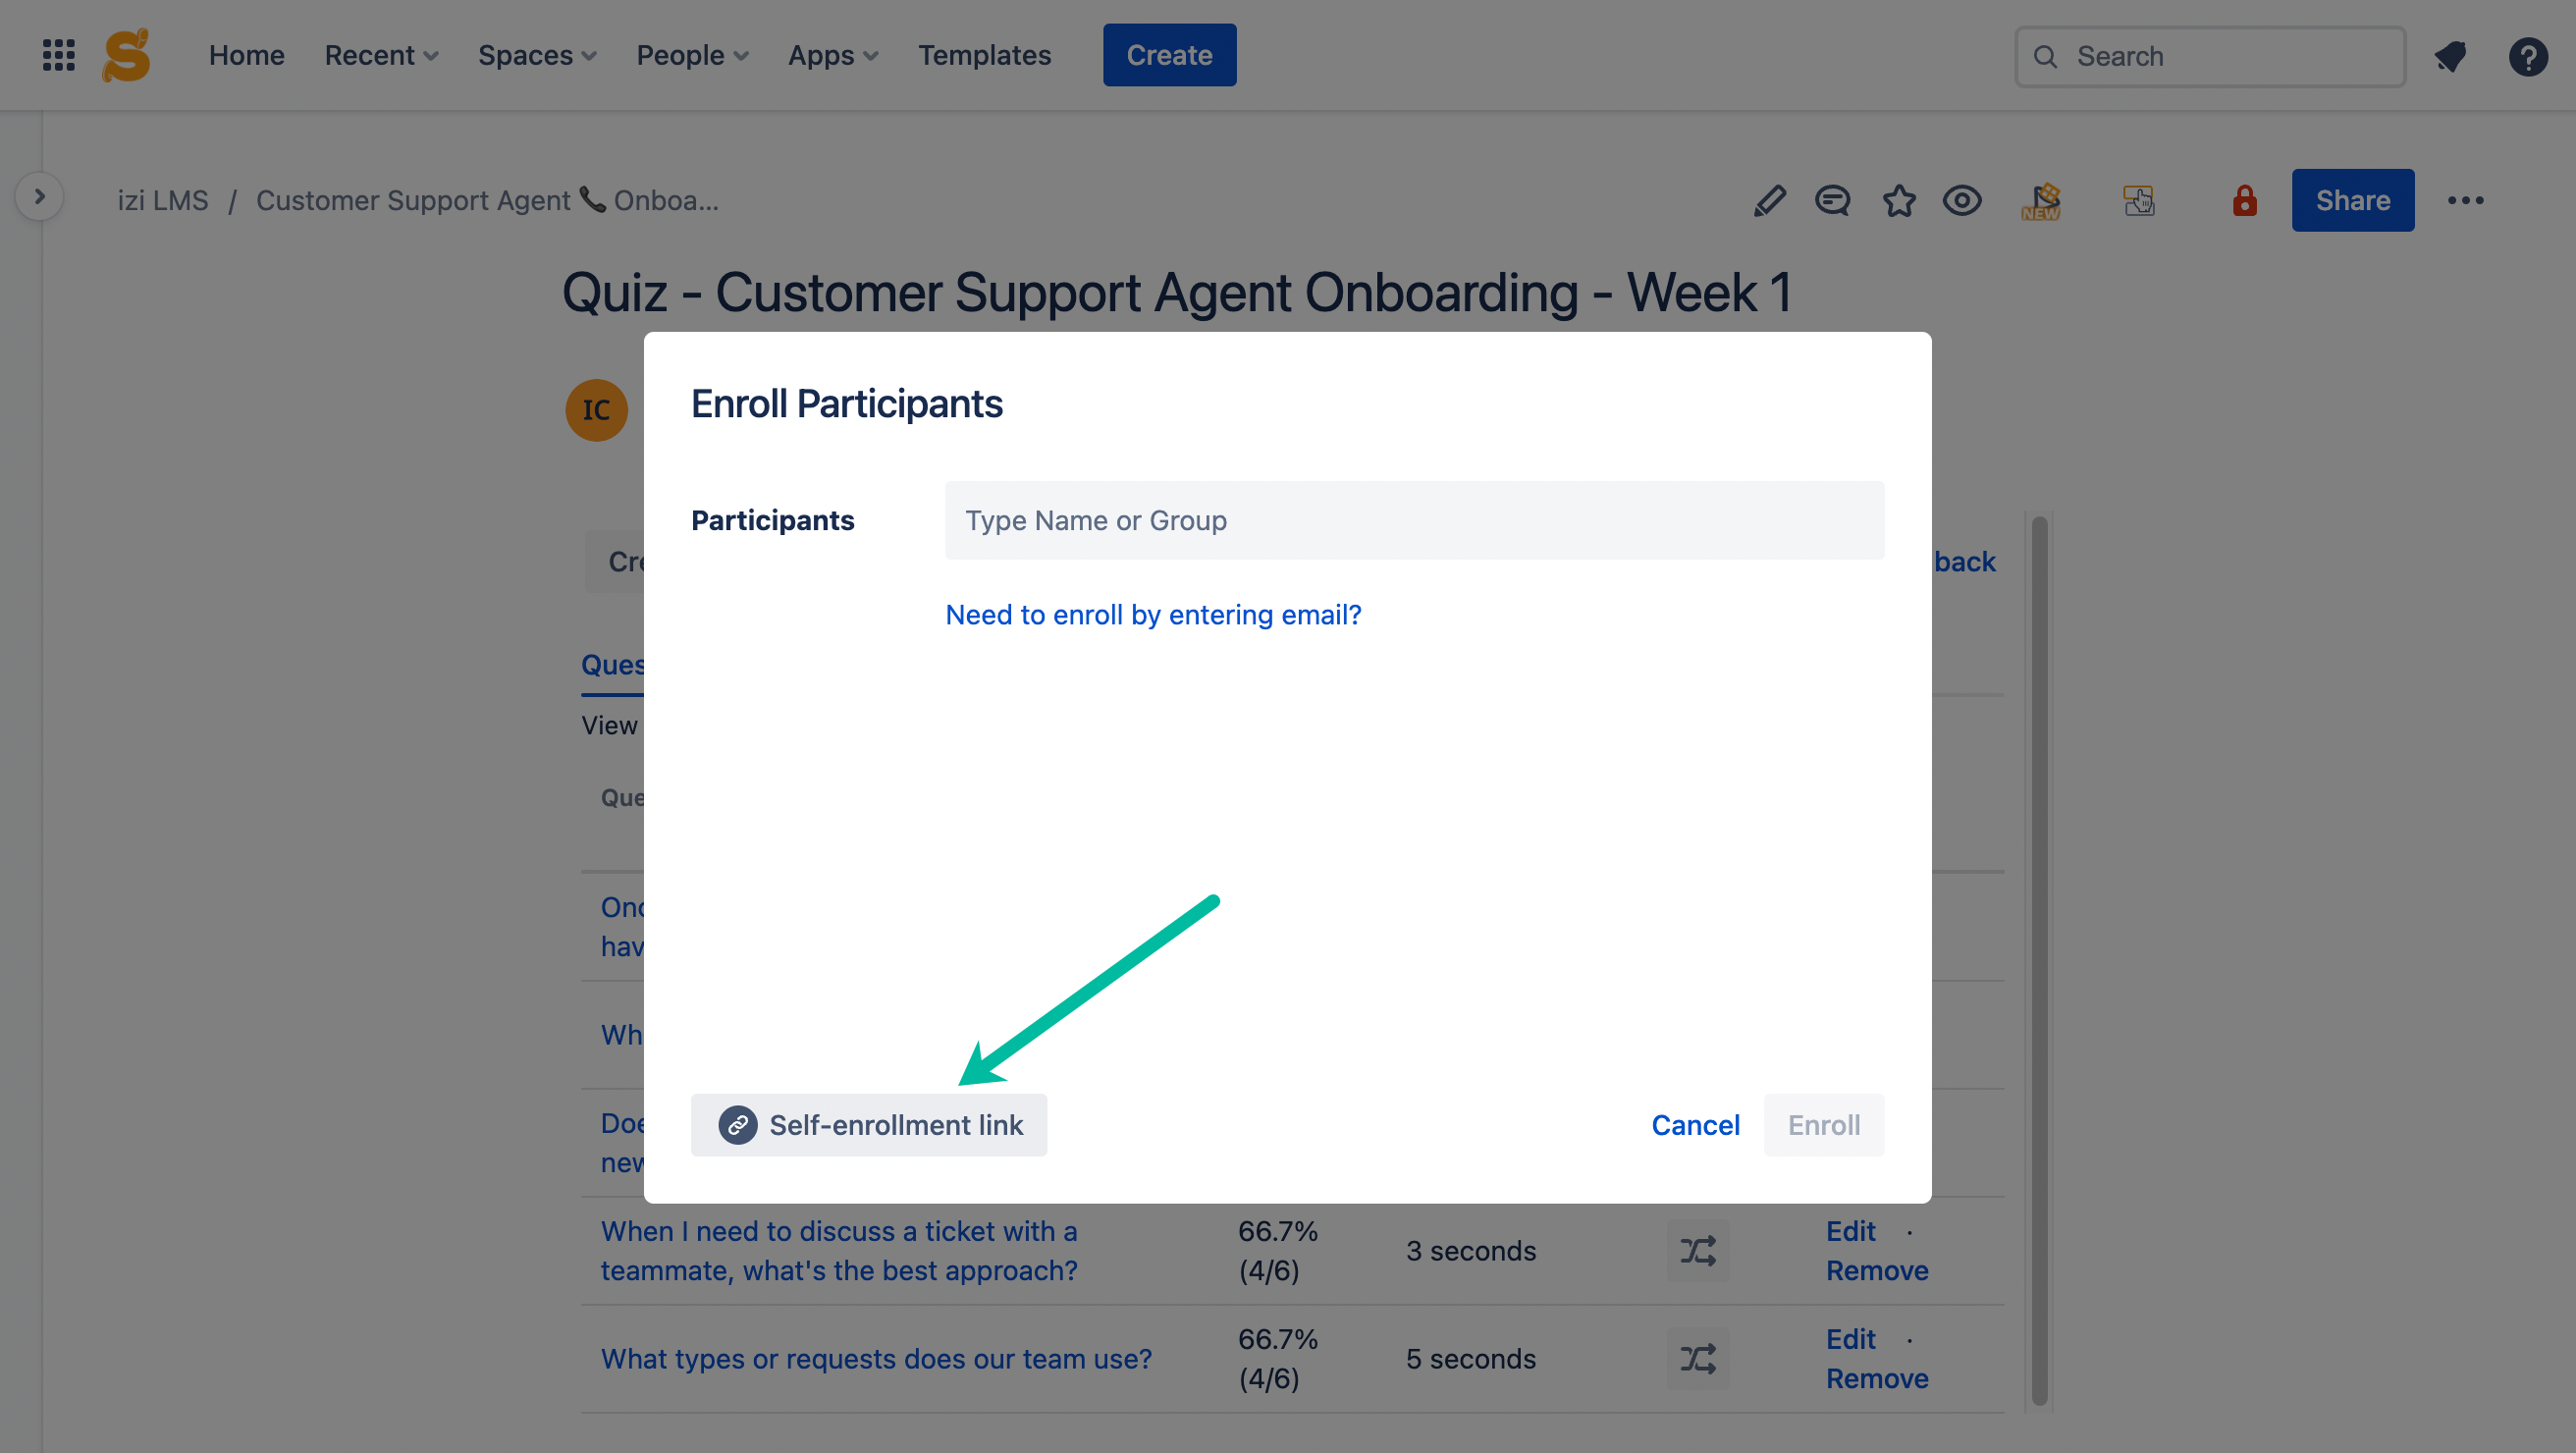
Participants can self-enroll in quizzes with a link. This facilitates the task of inviting multiple users to a quiz without typing their names individually.

Quiz self-enrollment link

After course completion, participants get certificates they can download and share with their colleagues or on social media. It helps increase employees’ engagement and productivity.

Course certificates for participants

Read more about how to ace employee certification in Confluence with the help of courses.

Track participants’ progress with reporting

One of the most common challenges is ensuring employees are motivated to complete courses. To overcome this challenge, it’s crucial to track their progress and guarantee they are meeting the necessary objectives, as well as gain insights into where additional training may be needed.

izi – LMS for Confluence lets course administrators track participants’ activity, assess their performance and generate reports both for courses and quizzes they take.

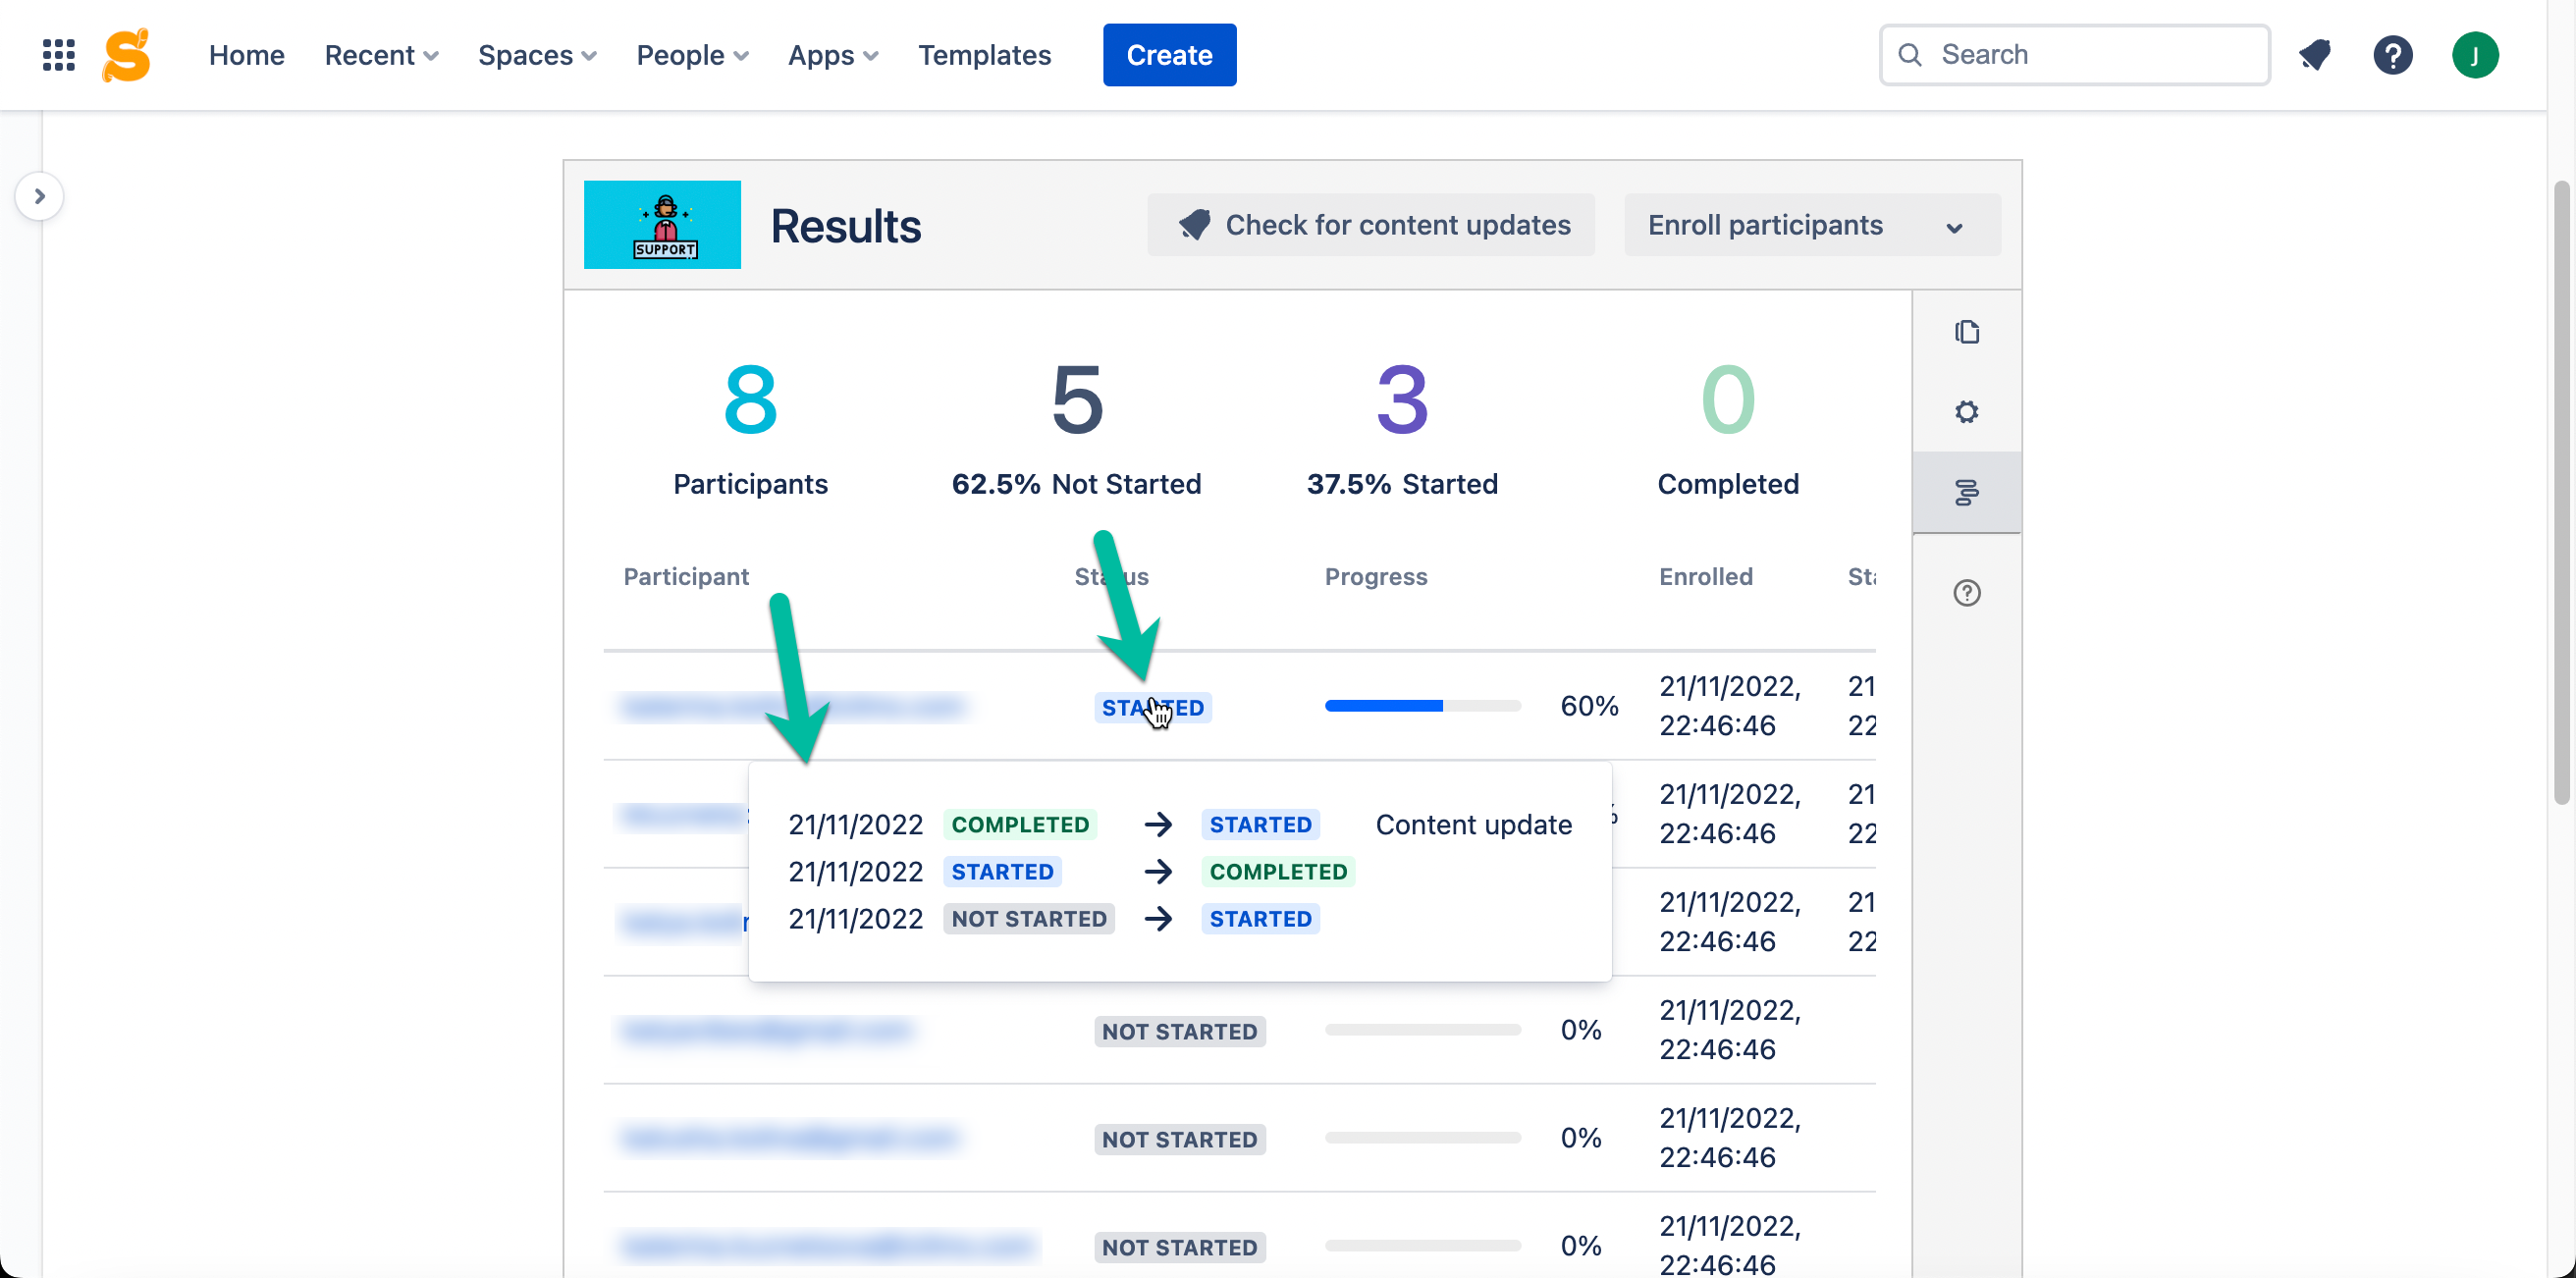
For example, every course report shows statuses such as Not started, Started, and Completed. Moreover, hovering over the status, you can see the status change history. This feature provides course administrators with a birds-eye view of course progress among all the participants.

Course history of status changes

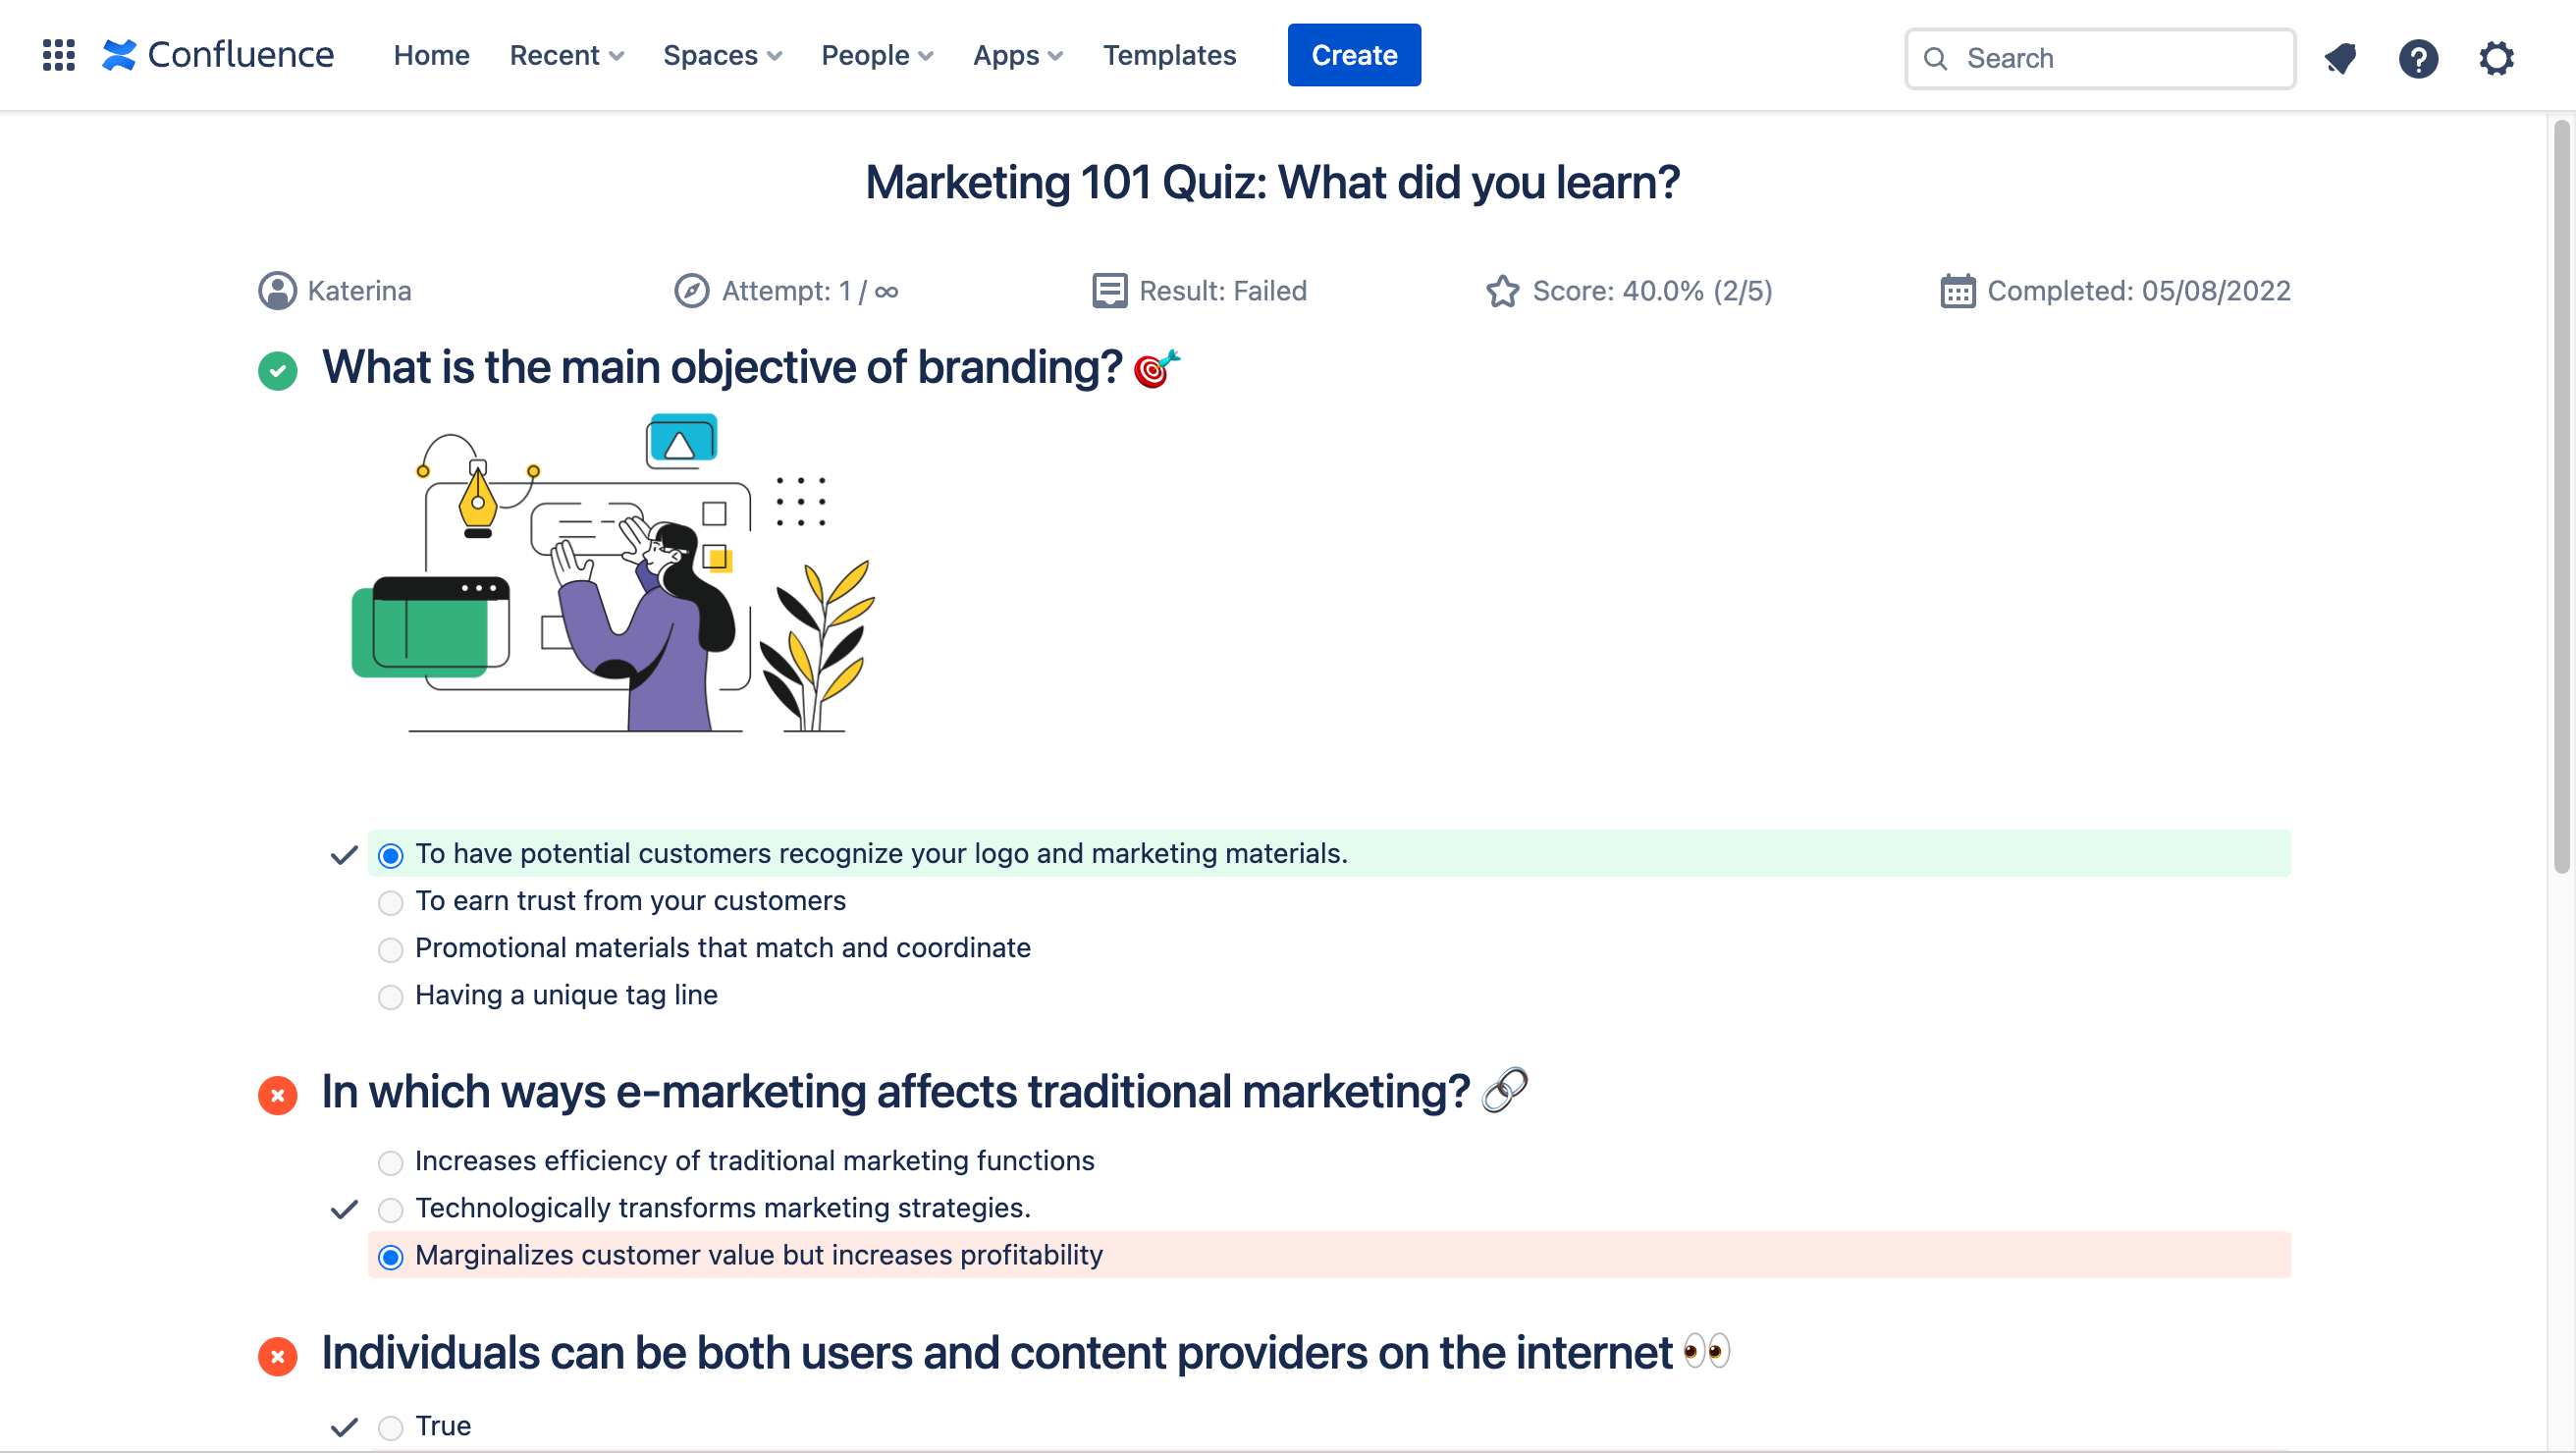
When it comes to quizzes, course creators can view answers participants gave while taking a quiz vs. correct answers.

Take advantage of an LMS in Confluence

With a suitable learning management system, businesses can ensure their employees receive the education and training they need to succeed. This approach benefits for both the company and its employees, as it allows them to manage their learning and development effectively.

Whether you’re looking for a way to master employee onboarding, level up compliance training, or improve self-directed employee education, izi – LMS for Confluence has got you covered. It allows you to set up courses, track employee progress, and measure their performance on the fly right in Confluence, the software you already know and enjoy using.

Try izi LMS for free and check how it can power up your training processes. The app is available for Confluence Cloud and Data Center.